
What’s new in Grafana v11.0-preview
Welcome to Grafana 11.0-preview! This release contains some major improvements: most notably, the ability to explore your Prometheus metrics and Loki logs without writing any PromQL or LogQL, using Explore Metrics and Explore Logs. The dashboard experience is better than ever with edit mode for dashboards, AI-generated dashboard names and descriptions, and general availability for subfolders. You can also take advantage of improvements to the canvas and table visualizations, new transformations, a revamp of the Alert Rule page, and more.
Why “preview?” The Grafana 11.0 stable release is planned for this May. This is an early release to coincide with Grafanacon 2024, so that you can try the new functionality early. To understand the differences between preview and GA releases, review the release life cycle.
For even more detail about all the changes in this release, refer to the changelog. For the specific steps we recommend when you upgrade to v11.0-preview, check out our Upgrade Guide.
Breaking changes
For Grafana v11.0-preview, we’ve also provided a list of breaking changes to help you upgrade with greater confidence. For information about these along with guidance on how to proceed, refer to Breaking changes in Grafana v11.0-preview.
Explore Metrics and Logs
Explore Metrics
Public preview in all editions of Grafana
Explore Metrics is a query-less experience for browsing Prometheus-compatible metrics. Search or filter to find a metric. Quickly find related metrics - all in just a few clicks. No PromQL to be found anywhere! With Explore Metrics, you can:
- easily slice and dice metrics based on their labels, so you can see anomalies right away
- See the right visualization for your metric based on its type (e.g. gauge vs. counter) without writing it yourself
- surface other metrics relevant to the current metric
- “explore in a drawer” - expand a drawer over a dashboard with more content, so you don’t lose your place
- view a history of user steps when navigating through metrics and their filters
- easily pivot to other related telemetry - IE, logs or traces
… all without writing any queries!
To learn more, refer to the Explore Metrics documentation as well as the following video demo:
Explore Logs
Experimental in Grafana Open Source and Enterprise
Explore Logs is a queryless experience for exploring Loki logs - no LogQL required! The primary interaction modes are point-and-click based on log volume, similar to Explore Metrics.
Highlights:
- View log volume and log line samples when you first land in Explore Logs (no more “blank screen!”)
- Explore additional labels and detected fields in a similar way, focusing on volume and distribution; add them to your “query” to refine your logs search without needing LogQL – See common patterns in your log lines, to easily filter out noise or focus in on anomalies
- For power users, an easy way to hop into the familiar Explore while preserving context
Explore Logs is Open Source, and experimental - some papercuts are to be expected. Give it a try and let us know what you think!
Dashboards and visualizations
Scenes powered Dashboards
Available in public preview in all editions of Grafana
For the past few months we’ve been working on a major update of our Dashboards architecture and migrated it to the Scenes library. This migration provides us with more stable, dynamic, and flexible dashboards as well as setting the foundation for what we envision the future of Grafana dashboards will be. Here are two of the improvements that are being introduced as part of this work.
Edit mode
It can be difficult to efficiently navigate through the visually cluttered options during the dashboard editing process. With the introduction of the edit mode, we aim to provide an easier way to discover and interact with the dashboard edit experience.
Fixed positioning of template variables and time picker
We moved the time picker into the dashboard canvas and now, together with template variables, it will stick to the top as you scroll through your dashboard. This has historically been a very requested feature that we’re very happy to be able to finally roll out!
Known limitations
- The variable dependency graph is not yet available.
- It’s no longer possible to switch a regular panel to a library panel from the edit view.
If you want to learn more, in detail, about all the improvements we’ve made, don’t miss our blog post.
Scenes for viewers
Generally available in all editions of Grafana
Dashboards, when accessed by users with the Viewer role, are now using the Scenes library. Those users shouldn’t see any difference in the dashboards apart from two small changes to the user interface (UI): the variables UI has slightly changed and the time picker is now part of the dashboard container.
Dashboards aren’t affected for users in other roles.
This is the first step towards a more robust and dynamic dashboarding system that we’ll be releasing in the upcoming months.
Subfolders
Generally available in all editions of Grafana
Subfolders are here at last!
Some of you want subfolders in order to keep things tidier. It’s easy for dashboard sprawl to get out of control, and setting up folders in a nested hierarchy helps with that.
Others of you want subfolders in order to create nested layers of permissions, where teams have access at different levels that reflect their organization’s hierarchy.
We are thrilled to bring this long-awaited functionality to our community of users! Subfolders are currently being rolled out to Grafana Cloud instances and will be generally available to all Grafana users for the Grafana 11 release.
Just a quick note: the upgrade to enable subfolders can cause some issues with alerts in certain cases. We think these cases are pretty rare, but just in case, you’ll want to check for this:
If you’ve previously set up a folder that uses a forward slash in its name, and you have an alert rule in that folder, and the notification policy is set to match that folder’s name, notifications will be sent to the default receiver instead of the configured receiver.
To correct this, take the following steps:
- Create a copy of the affected routes
- Rewrite the matchers for the new copy. For example, if the original matcher was
grafanafolder=folder_with/in_title, then the new route matcher will begrafana_folder=folder_with/_in_title - After rewriting the matchers, you can delete the old routes.
If you use file provisioning, you can upgrade and update the routes at the same time.
Use AI to generate titles and descriptions for panels and dashboards
Generally available in all editions of Grafana
You can now use generative AI to assist you in your Grafana dashboards. So far generative AI can help you generate panel and dashboard titles and descriptions - You can now generate a title and description for your panel or dashboard based on the data you’ve added to it. This is useful when you want to quickly visualize your data and don’t want to spend time coming up with a title or description.
Make sure to enable and configure Grafana’s LLM app plugin. For more information, refer to the Grafana LLM app plugin documentation.
When enabled, look for the ✨ Auto generate option next to the Title and Description fields in your panels and dashboards, or when you press the Save button.
Improvements to the canvas visualization
Generally available in all editions of Grafana
We’ve made a number of improvements to the canvas visualization.
Enhanced flowcharting functionality
With this release, we’ve updated the canvas visualization to include much-requested flowcharting features. These improvements are:
- Addition of widely-used elements: cloud, parallelogram, and triangle.
- Addition of midpoint controls so that the connectors no longer have to be straight lines.
- Addition of more connector styles including dashed lines as well as corner radius and direction control.
- Horizontal and vertical snapping for connectors.
- Addition of rounded corner styling for elements.
- Ability to rotate elements in the canvas.
Universal data link support
We’ve updated data links so that you can add them to almost all elements or element properties that are tied to data. Previously, you could only add data links to text elements or elements that used the TextConfig object. This update removes that limitation.
Note
This update doesn’t apply to the drone and button elements.
Infinite panning for the canvas visualization
Available in public preview in all editions of Grafana
With the newly added Infinite panning editor option, you can now view and navigate very large canvases. This option is displayed when the Pan and zoom switch is enabled.
To try out this feature, you must first enable the canvasPanelPanZoom feature toggle.
Colored table rows with conditional formatting
Generally available in all editions of Grafana
Grafana 11 adds the ability to color full table rows using the Colored background cell type of the table visualization. When you configure fields in a table to use this cell type, an option to apply the color of the cell to the entire row becomes available.
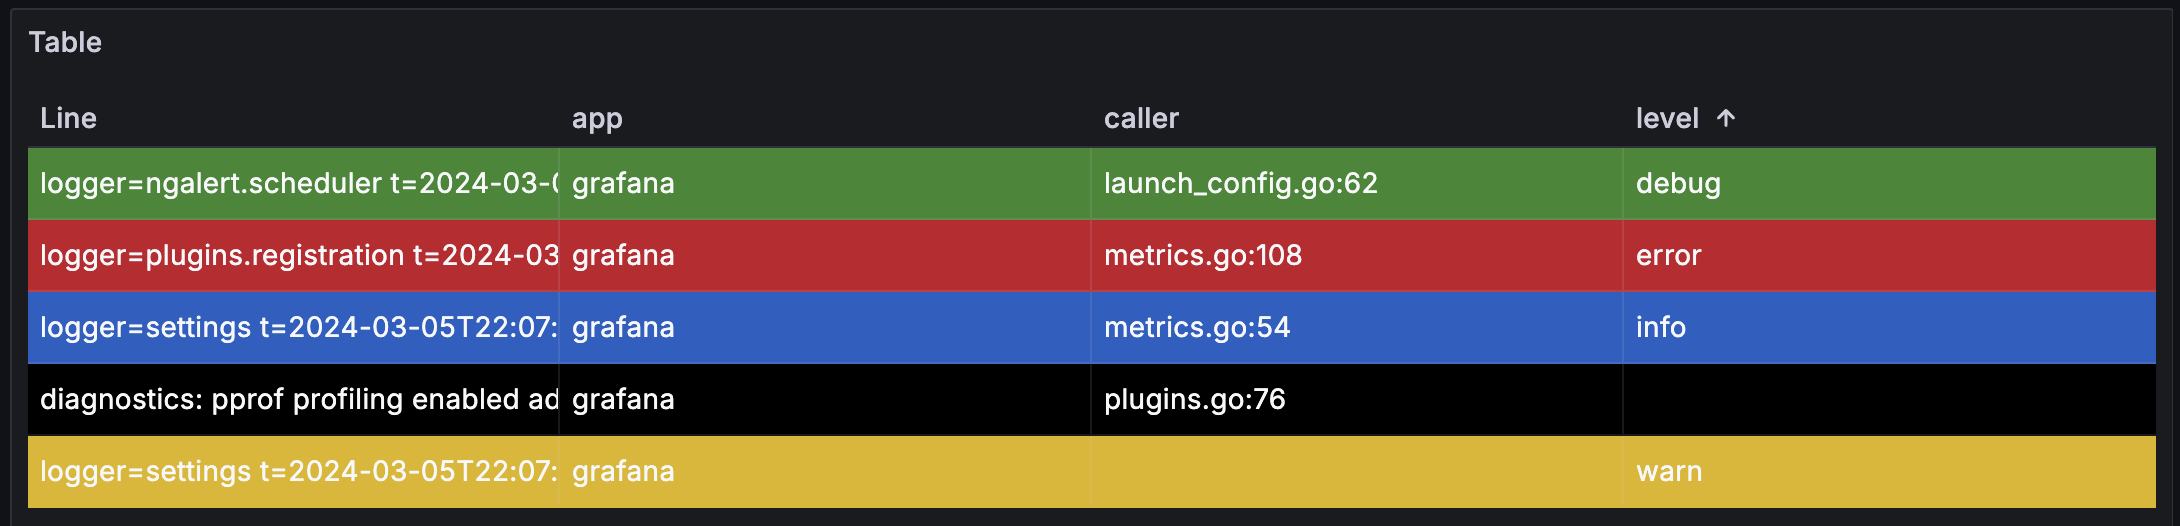
This feature is useful for a wide variety of use cases including mapping status fields to colors (for example, info, debug, warning) and allowing rows to be colored based on threshold values. This is one of the first steps in making formatting tables more seamless, and allows for quick scanning of data using the table visualization.
To learn more, refer to the documentation for the Colored background cell type.
Set threshold colors in the Config from query transformation
Generally available in all editions of Grafana
You now have the ability to customize specific colors for individual thresholds when using the Config from query results transformer. Previously, when you added multiple thresholds, they all defaulted to the same color, red. With this addition, you gain the flexibility to assign distinct colors to each threshold.
This feature addresses a common pain point highlighted by users. With customizable threshold colors, you now have greater control over your data representation, fostering more insightful and impactful analyses across diverse datasets.
Substring matcher added to the Filter by value transformation
Generally available in Grafana Cloud and Open Source
This update to the Filter data by values transformation simplifies data filtering by enabling partial string matching on field values thanks to two new matchers: Contains substring and Does not contain substring. With the substring matcher built into the Filter data by values transformation, you can efficiently filter large datasets, displaying relevant information with speed and precision. Whether you’re searching for keywords, product names, or user IDs, this feature streamlines the process, saving time and effort while ensuring accurate data output.
In the Filter data by values transformation, simply add a condition, choose a field, choose your matcher, and then input the string to match against.
This update will be rolled out to customers over the next few weeks.
Reporting
PDF export improvements
Available in public preview in Grafana Cloud and Enterprise
Introducing a major performance improvement for the PDF export feature.
Are you tired of waiting for your PDF to be generated or your report to be sent? We’re working on a major update of the dashboard-to-PDF feature to make it faster for large dashboards. The generation time will no longer be proportional to the number of panels in your dashboard. As an example, an SLO dashboard containing around 200 panels has gone from taking more than seven minutes to be generated to only eleven seconds.
This update also fixes all caveats related to rendering a report with panels or rows set to repeat by a variable, like rendering repeating panels inside collapsed rows.
To try out this update, enable the newPDFRendering feature toggle.
Alerting
Keep Last State for Grafana Managed Alerting
Generally available in all editions of Grafana
(Re-)introducing “Keep Last State” to Grafana managed alert rules.
You can now choose to keep the last evaluated state of an alert rule when that rule produces “No Data” or “Error” results. Simply choose the “Keep Last State” option for no data or error handling when editing a rule. Refer to the Alerting documentation on state and health of alert rules for more information.
Alert detail view redesign
Generally available in all editions of Grafana
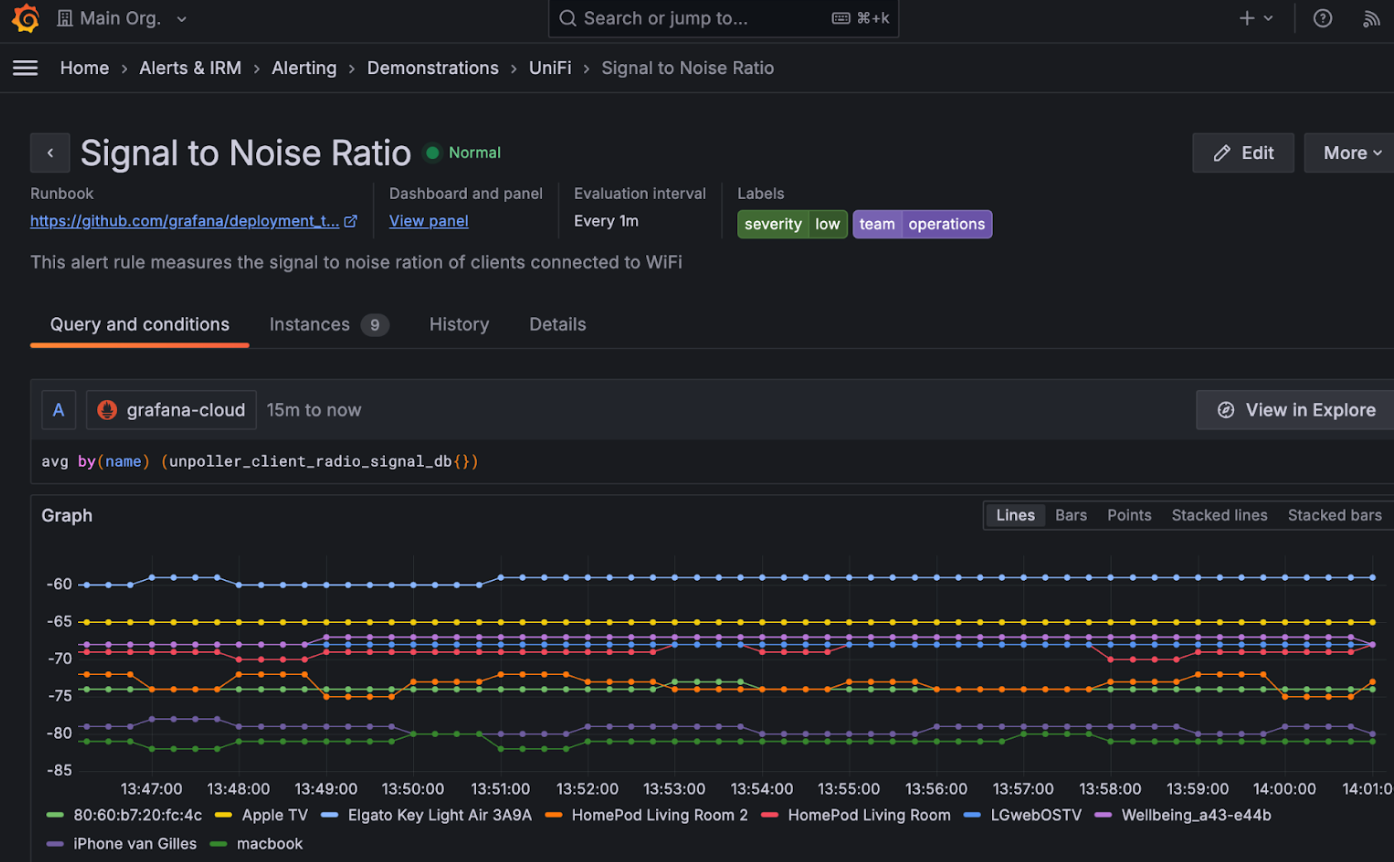
The new alert rule detail view has a new look and feel with helpful metadata at the top. The namespace and group are shown in the breadcrumb navigation. This is interactive and can be used to filter rules by namespace or group. The rest of the alert detail content is split up into tabs:
Query and conditions
View the details of the query that is used for the alert rule, including the expressions and intermediate values for each step of the expression pipeline. A graph view is included for range queries and data sources that return time series-like data frames.
Instances
Explore each alert instance, its status, labels and various other metadata for multi-dimensional alert rules.
History
Explore the recorded history for an alert rule.
Details
Debug or audit using the alert rule metadata and view the alert rule annotations.
Data sources
Azure Monitor: Current User authentication
Experimental in all editions of Grafana
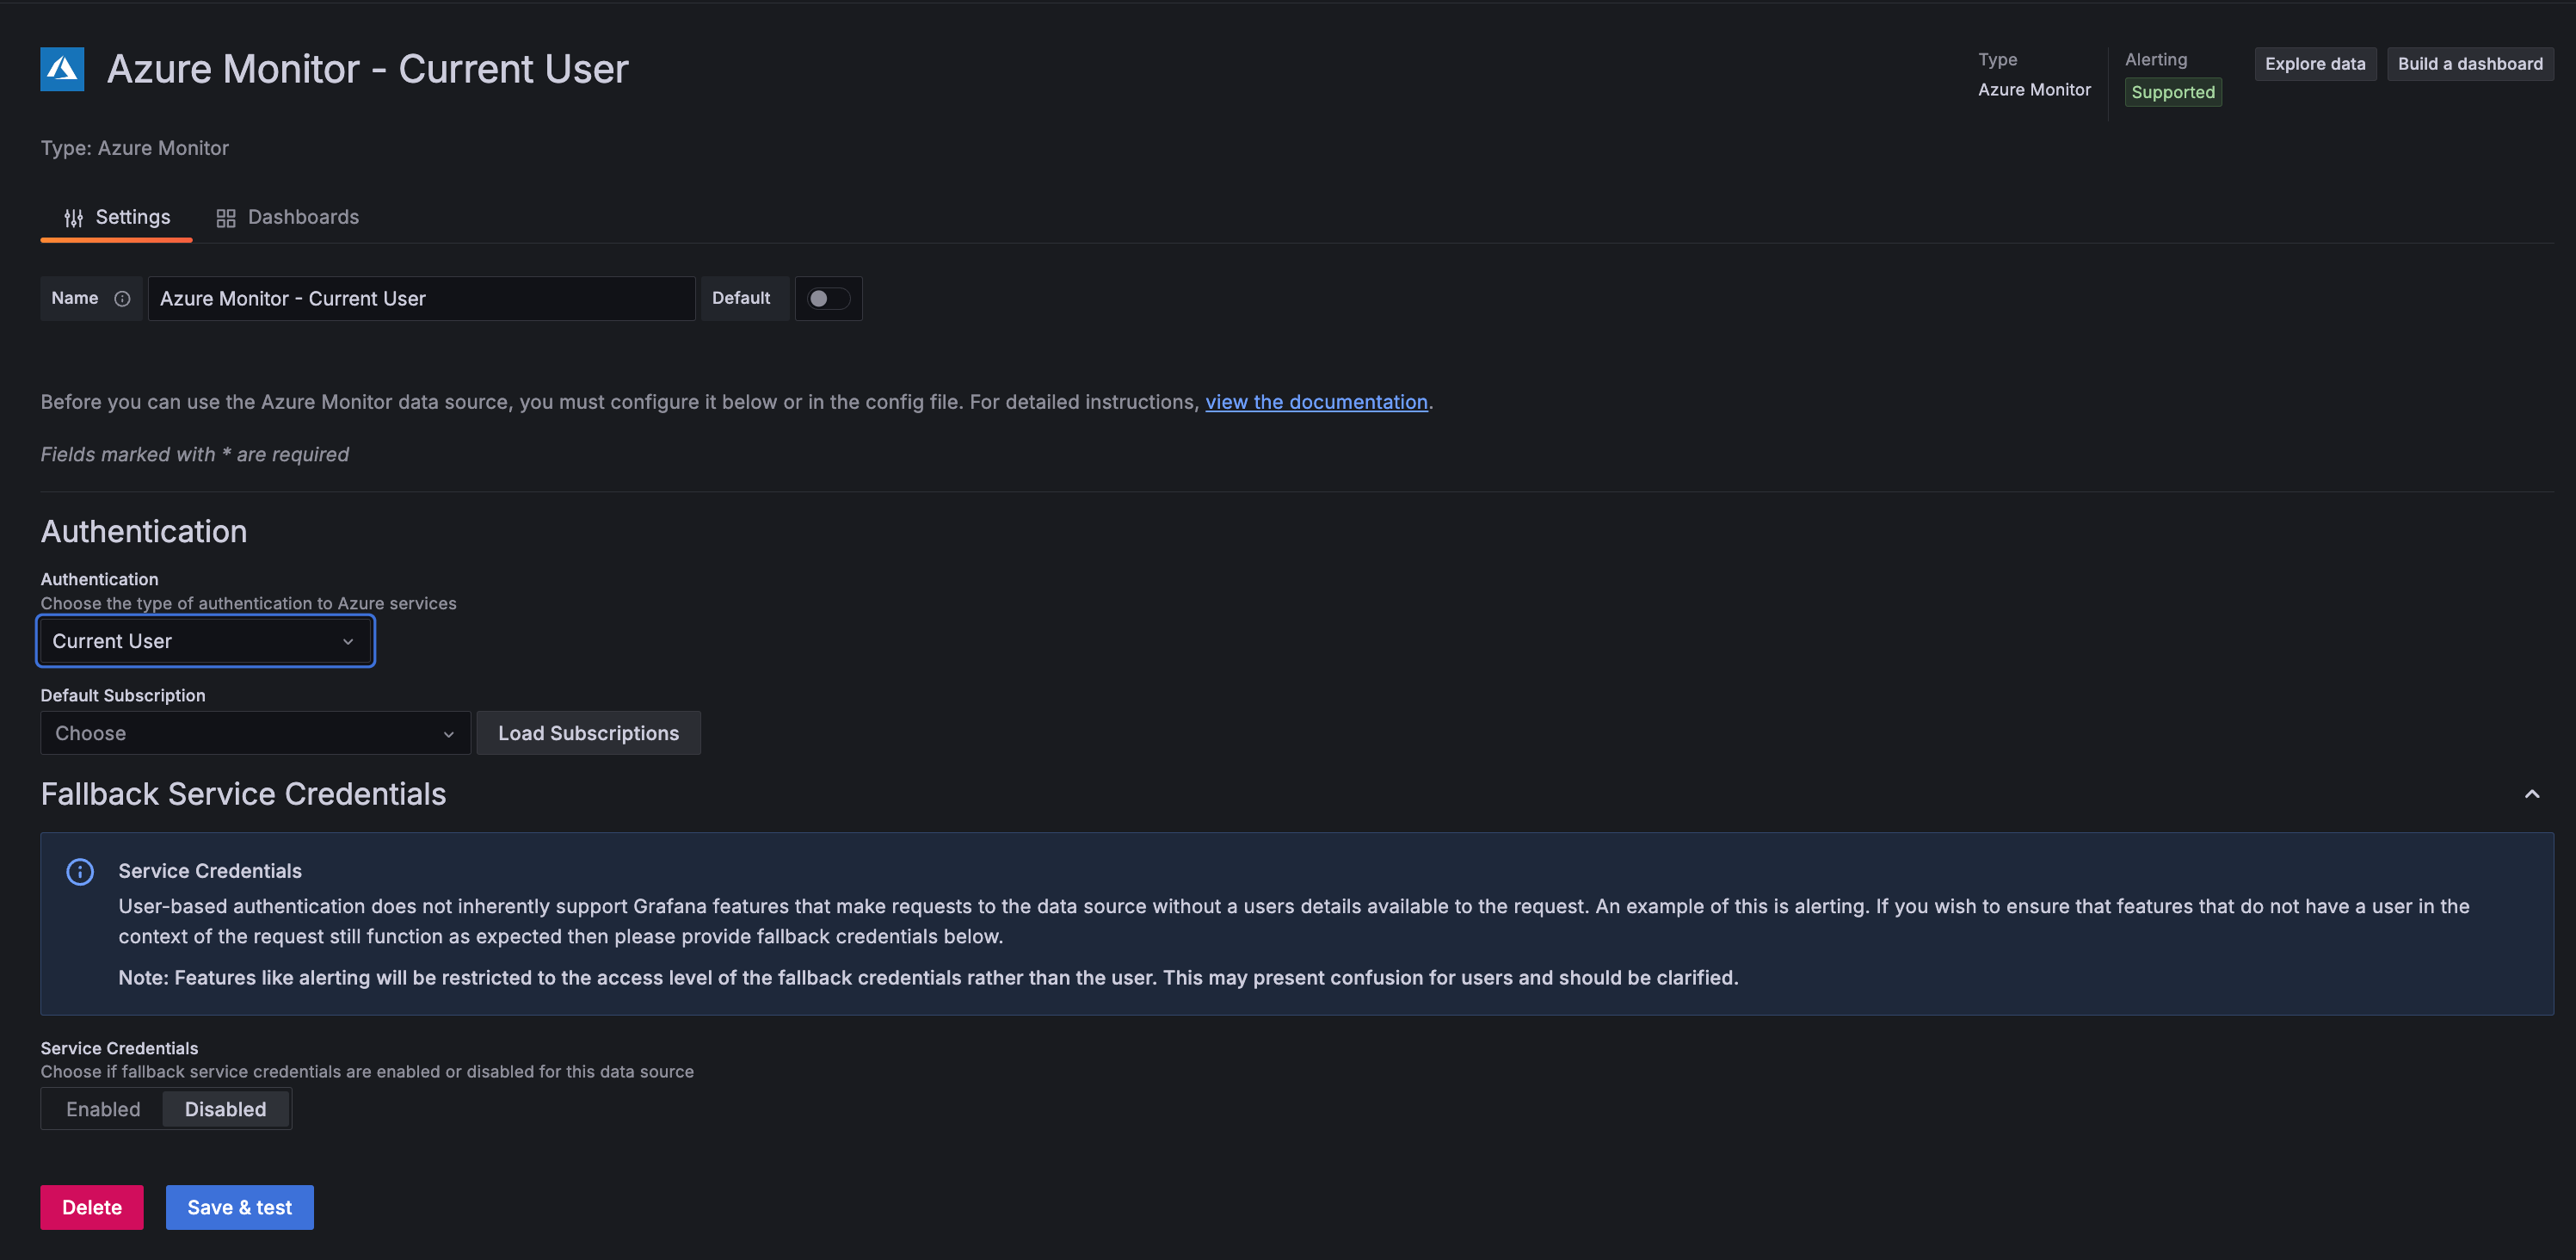
You can now configure the Azure Monitor data source to authenticate as the logged-in Grafana user when making query and resource requests if you also use Azure Entra to sign your users into Grafana.
Current User authentication allows you to enforce Azure RBAC restrictions on your Grafana users by removing the need to provide broad service credentials. Once a data source is configured with Current User authentication a user will only have access to resources they can access directly in Azure.
Additionally, data sources configured to use Current User authentication are less likely to be impacted by throttling issues due to the individual level of access.
Current User authentication does not inherently support backend features such as alerting. To account for this, data sources configured with Current User authentication can optionally specify service credentials that will be utilized for backend features when no signed-in user is available.
To get started with Current User authentication, refer to the Azure Monitor data source documentation.
Removal of old Tempo Search and Loki Search in Tempo
Generally available in all editions of Grafana
Removal of old Tempo Search tab
In Grafana v10.1, we added a Tempo search editor powered by TraceQL (search tab). We also recommended using this new editor over the older non-TraceQL powered editor.
The older non-TraceQL powered editor has been removed. Any existing queries using the older editor will be automatically migrated to the new TraceQL-powered editor.
The new TraceQL-powered editor makes it much easier to build your query by way of static filters, better input/selection validation, copy query to the TraceQL tab, query preview, dedicated status filter, and the ability to run aggregate by (metrics summary) queries.
Refer to Query tracing data to learn more.
Removal of Loki Search tab in Tempo
The Loki Search tab has been around since before we could natively query Tempo for traces. This search is used by a low number of users in comparison to the TraceQL-powered editor (Search tab) or the TraceQL tab itself.
If you would like to see what logs are linked to a specific trace or service, you can use the Trace to logs feature, which provides an easy way to create a custom link and set an appropriate time range if necessary.
MSSQL: Windows Active Directory (Kerberos) authentication
[an error occurred while processing the directive]Generally available in Grafana Open Source and Enterprise
You can now use Windows Active Directory (or Kerberos) to authenticate to MSSQL servers from Grafana.
There are four primary ways to authenticate from Grafana to a MSSQL instance with Windows Active Directory:
- Windows Active Directory username and password
- Specify the path to a valid keytab file.
- Specify the path to an up to date credential cache.
- Specify the path to a JSON document that holds information about several credential caches and the user and database for each one.
To get started, refer to the Getting Started documentation for MSSQL.
Authentication and authorization
New strong password policy
Available in public preview in Grafana Open Source and Enterprise
If you manage your users using Grafana’s built-in basic authorization as an identity provider, consider enabling our new strong password policy feature.
Starting with Grafana v11.0, you can enable an opinionated strong password policy feature. This configuration option validates all password updates to comply with our strong password policy.
To learn more about Grafana’s strong password policy, refer to the documentation.
Anonymous users are billed in Grafana Enterprise
Generally available in Grafana Enterprise
We are announcing a license change to the anonymous access feature in Grafana 11. As you may already be aware, anonymous access allows users access to Grafana without login credentials. Anonymous access was an early feature of Grafana to share dashboards; however, we recently introduced Public Dashboards which allows you to share dashboards in a more secure manner. We also noticed that anonymous access inadvertently resulted in user licensing issues. After careful consideration, we have decided to charge for the continued use of anonymous access starting in Grafana 11.
Affected Grafana versions
Anonymous authentication is disabled by default in Grafana Cloud. This licensing change only affects Grafana Enterprise (self-managed) edition. Anonymous users will be charged as active users in Grafana Enterprise.
Was this page helpful?
Related resources from Grafana Labs


