

New in Grafana 9: The Prometheus query builder makes writing PromQL queries easier
When Grafana started in 2014, its main goal was to be a great dashboarding solution for Graphite. Around the same time, the Prometheus project started to gain steam, but it wasn’t clear whether it should be added to Grafana. After all, Grafana was a Graphite frontend, it was uncertain at the time if Prometheus would take off in popularity, and it would take resources away from the core purpose of why Grafana was created.
Fast forward to today and we now know it was a pivotal decision to include Prometheus in Grafana as it has become the industry standard for metrics and the most used data source for Grafana and its users. But up until recently, the only way to interact with Prometheus in Grafana was using text input. Yes, we added lots of nice features to make the user experience better — syntax highlighting, autocomplete, and a metrics browser. But the main mode of operation was to write PromQL code, which for many people isn’t the most straightforward language. This is in stark contrast to Graphite or SQL data sources where we provide both code input and a visual query builder that allows users to create a query without knowing the exact syntax.
At long last, however, with the release of Grafana 9 at GrafanaCONline 2022 came the introduction of the Prometheus query builder.
Like many awesome features that we have released at Grafana Labs, the Prometheus query builder started as a Grafana Labs hackathon project, which built the foundations for the Prometheus query builder. After an amazing demo that everyone at Grafana Labs fell in love with right away, it took an additional six months of work before the Prometheus query builder was production ready for Grafana 9. This is a great example of how innovation at Grafana Labs can be kickstarted by anyone and how we don’t let good ideas just wither on a Git branch. So let’s see how the Prometheus query builder actually works.
How the Grafana Prometheus query builder helps write queries
Metric and labels filter
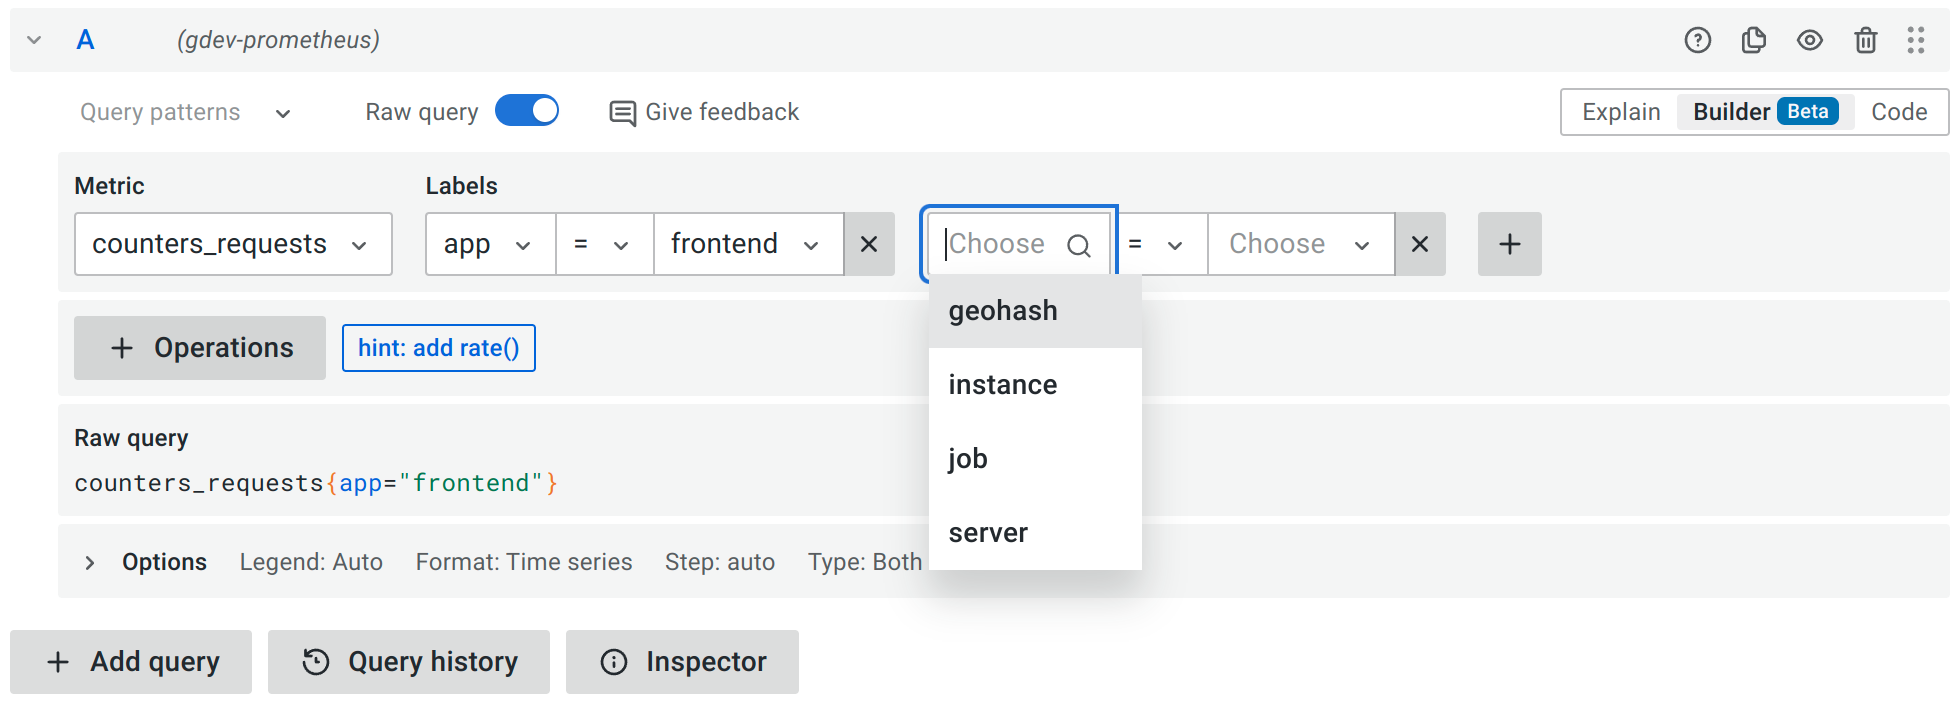
As is common practice with Prometheus queries, we start with selecting a metric and label filter. You can select your desired metric from a dropdown that is dynamically populated with existing metrics from your Prometheus instance. At any time, you can access help text for metrics by briefly hovering over the metric name.
To select a label, simply click on the label selector. The label selector includes search functionality, so you can also type out the label you are looking for and the labels can be dynamically retrieved from Prometheus. Same applies to metrics. After you select the label, you can move on to the value. In the value dropdown, you will see only values available for your selected label. If you would like to select multiple values, you can change exactly equal operator (=) to regex match (=~). On the other hand, if you want to omit some values, you can use not equal (!=) or regex does not match (!~) label matching operator.
To add more label-value combinations, you can use the + button.
Operations
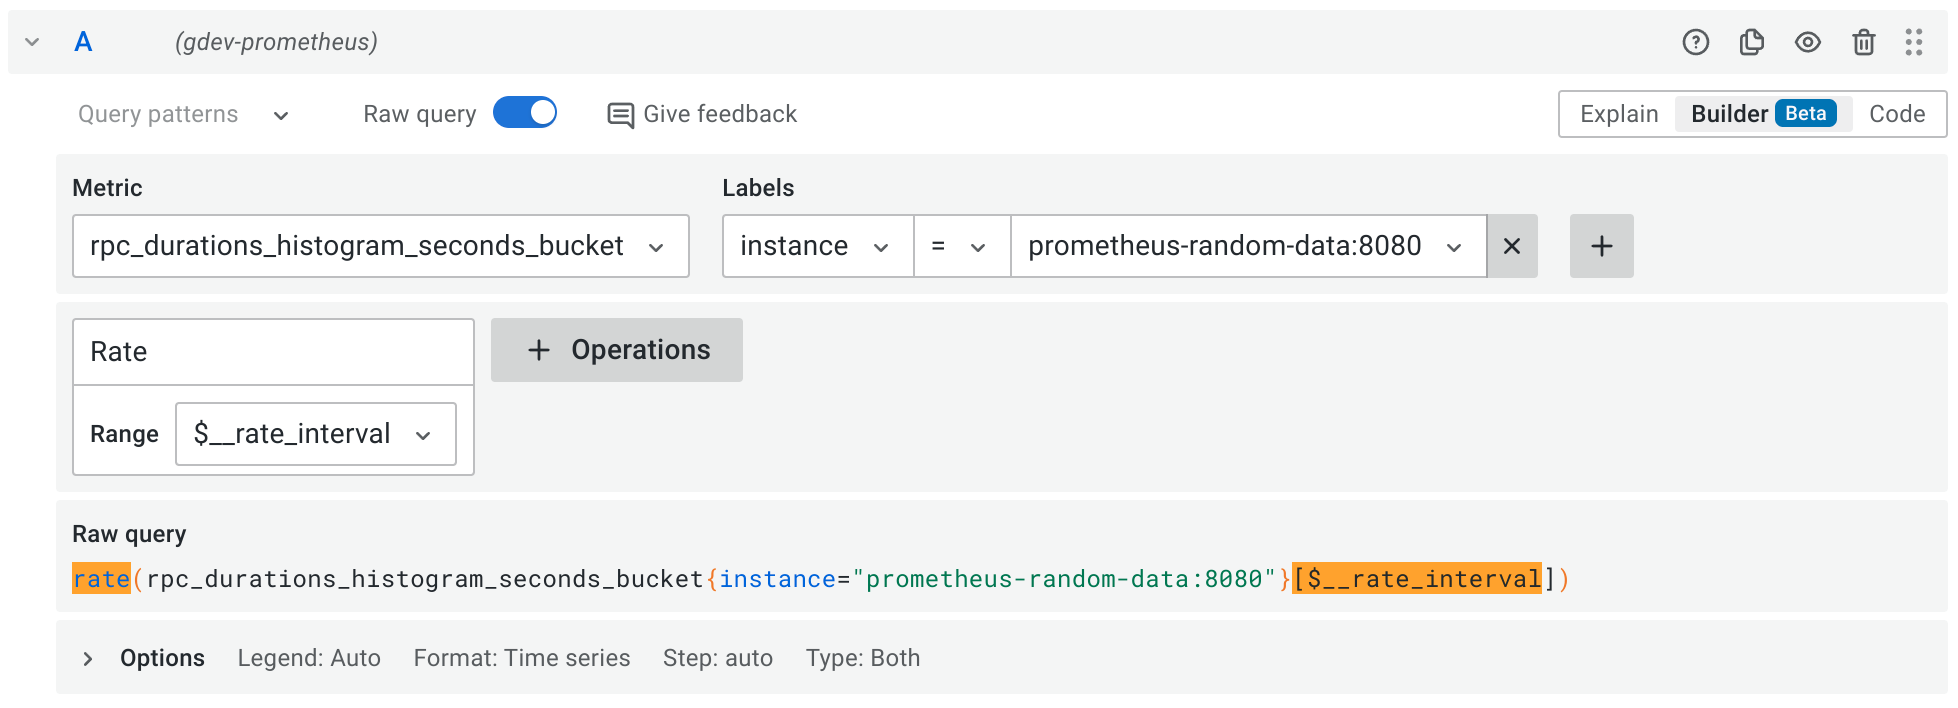
Selecting metrics and labels already builds a valid Prometheus query, but you can create more complex queries using operations.
Add operations using + Operations button
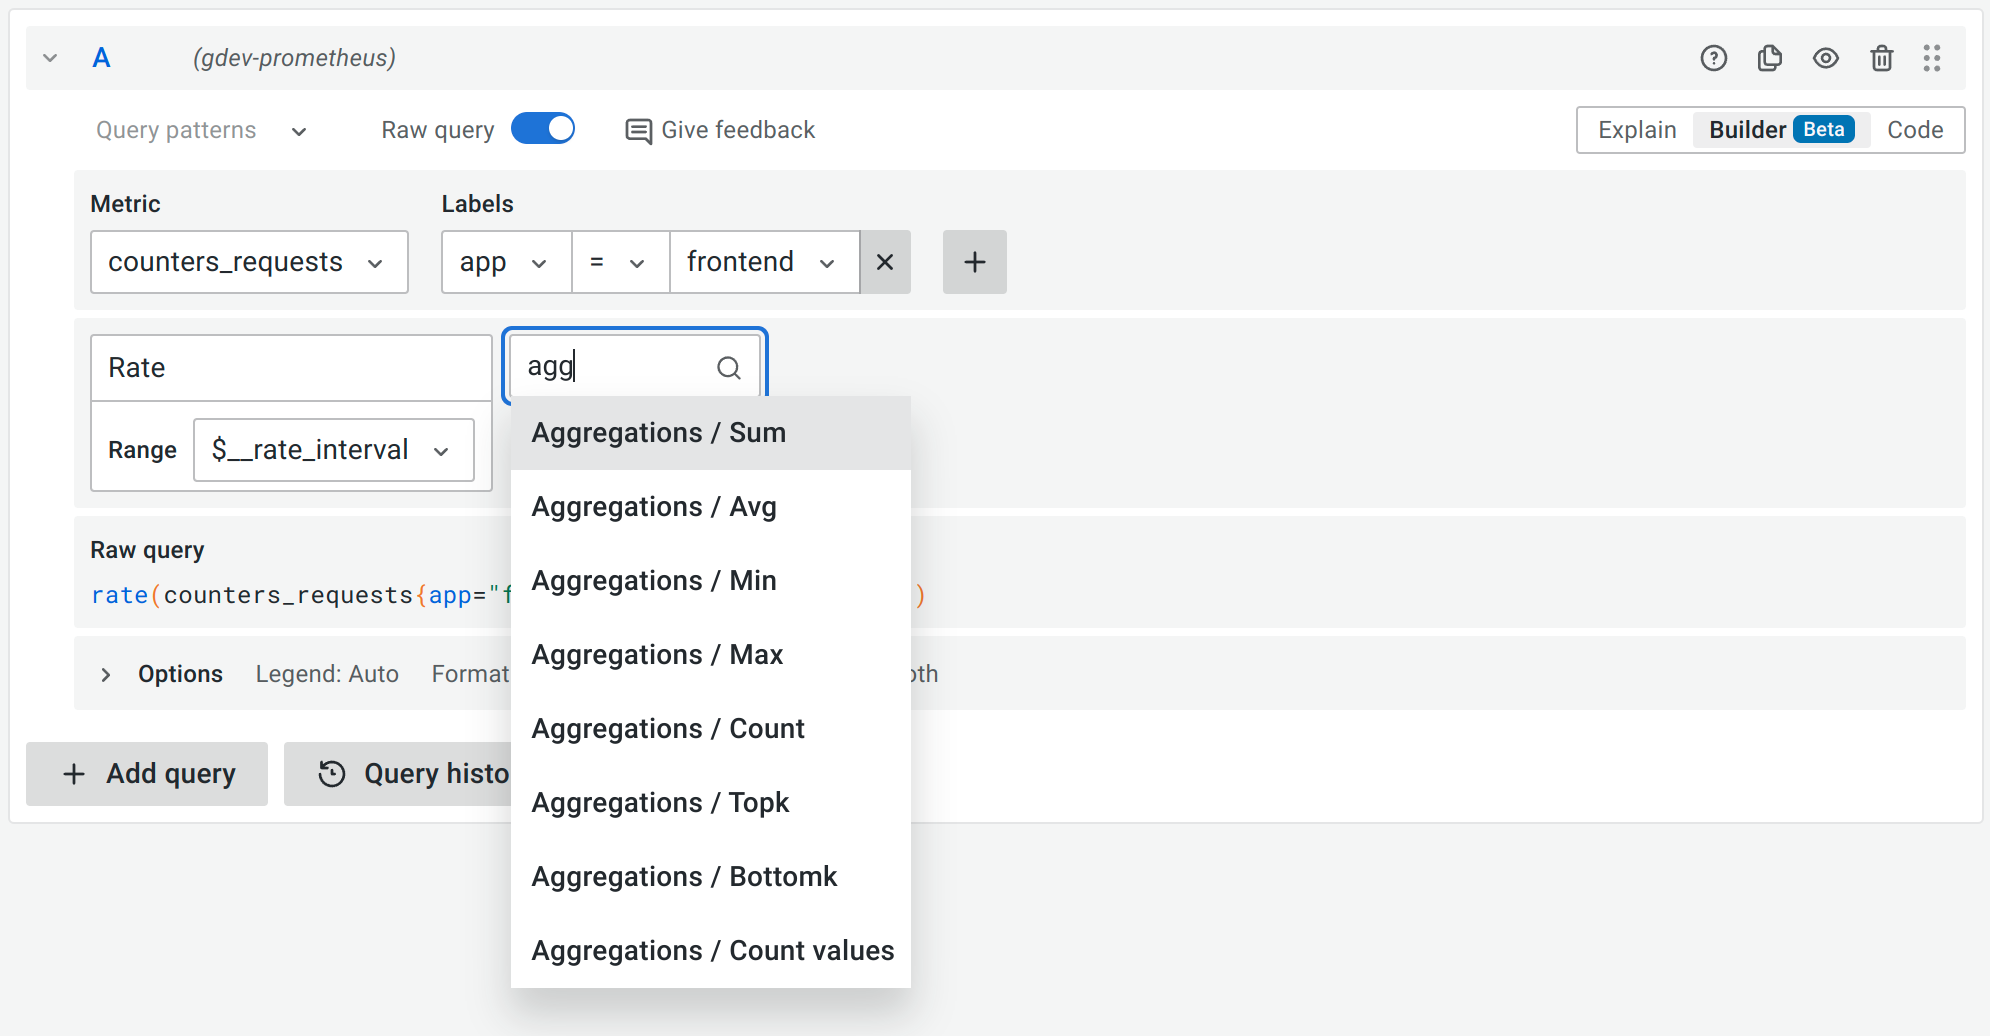
Prometheus query builder supports all the functions and operators of PromQL calling them operations. To select any (or all) of these, you can click on + Operations and either look through different operation categories or use the search to find the operation you want to use.
Note: Prometheus query builder supports simple binary operations like multiple or divide by scalar. Or even binary operations on nested query expressions.
Every available operation comes with a tooltip on its use case and query syntax. Just click on the information button next to the operation name.
Moreover, if you click on the arrow next to the name of operation, you get a list of alternative operations in the same category that you can choose from.

Add operations using query patterns
Not everybody knows all the Prometheus functions and how to use them (myself included!), in which case query patterns will be a super-useful feature in the new query editor. Query patterns offers a list of helpful operation patterns that can be used to quickly add multiple operations to your query to achieve a specific goal. This can be useful in cases when you know what you would like to achieve, but you are not sure about which operations would get you there. To choose the pattern, simply click on the Query patterns button and look through possible options. It includes commonly used patterns you may use with Prometheus.
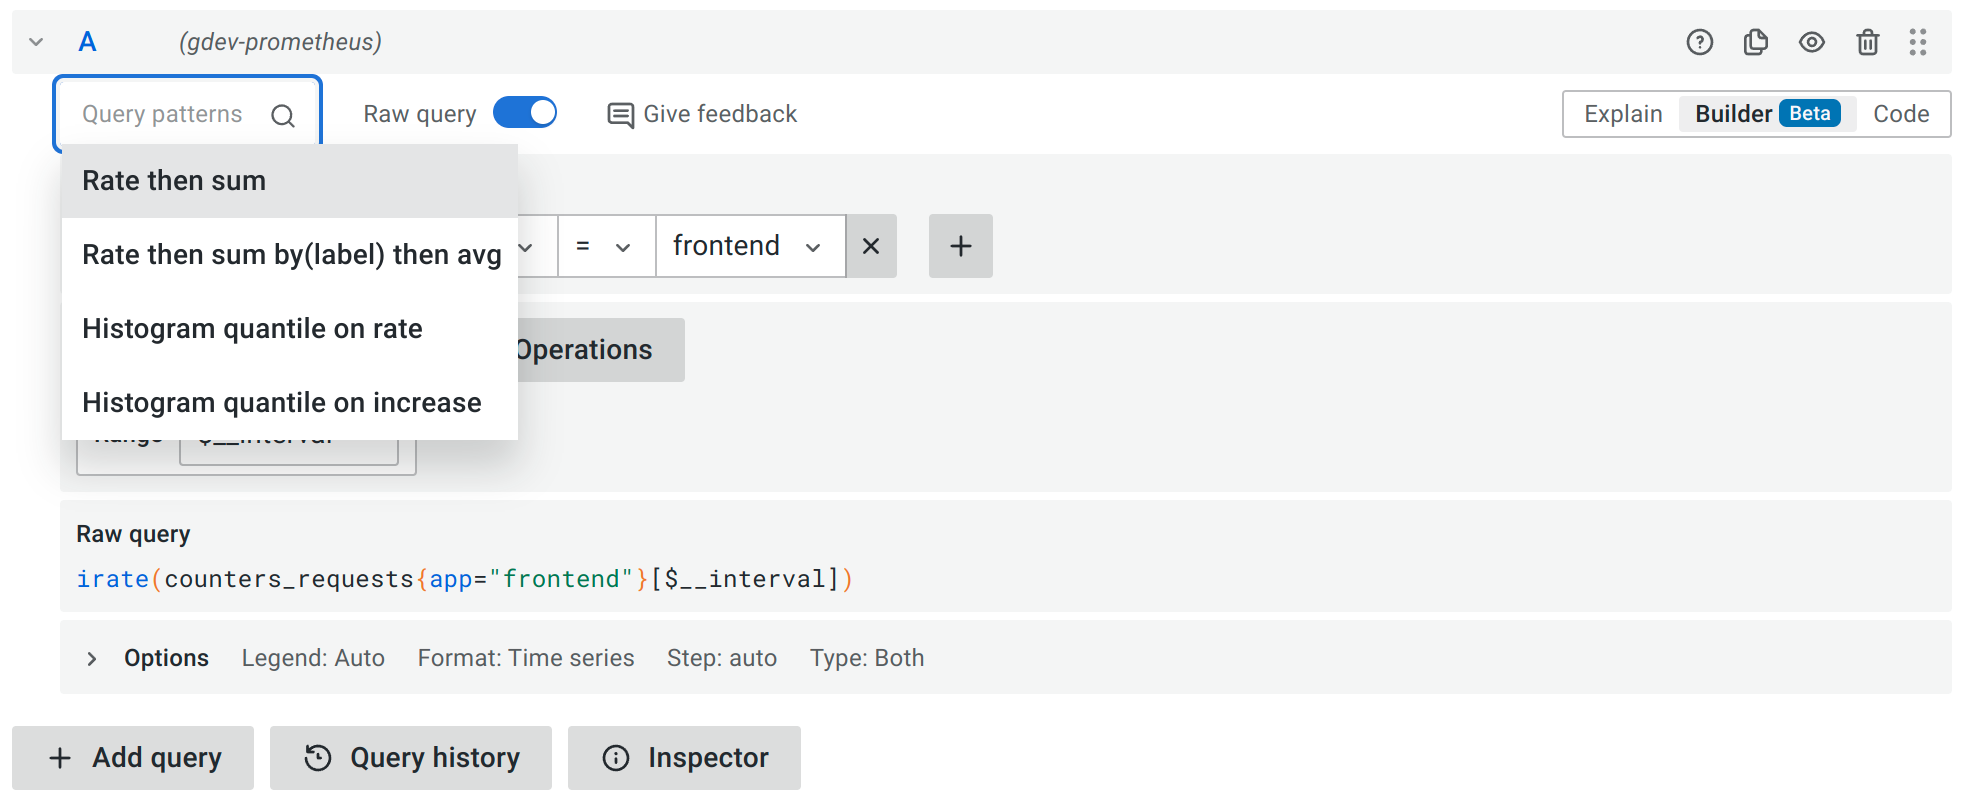
If you’ve found the pattern you would like to use, click on it. To demonstrate how quickly you can build up a query with query patterns, let’s walk through creating a query to get 95 percentile of a metric. While this may not be the most complex query, it can be much faster to do this with query patterns.
During this process you can use the operation tooltip to learn more about each operation. Or use the list of alternative operations to update the operation you want.
There’s supposed to be a video here, but for some reason there isn’t. Either we entered the id wrong (oops!), or Vimeo is down. If it’s the latter, we’d expect they’ll be back up and running soon. In the meantime, check out our blog!
How the Prometheus query builder helps with understanding queries
The Prometheus query builder helps with understanding queries in a couple of different ways.
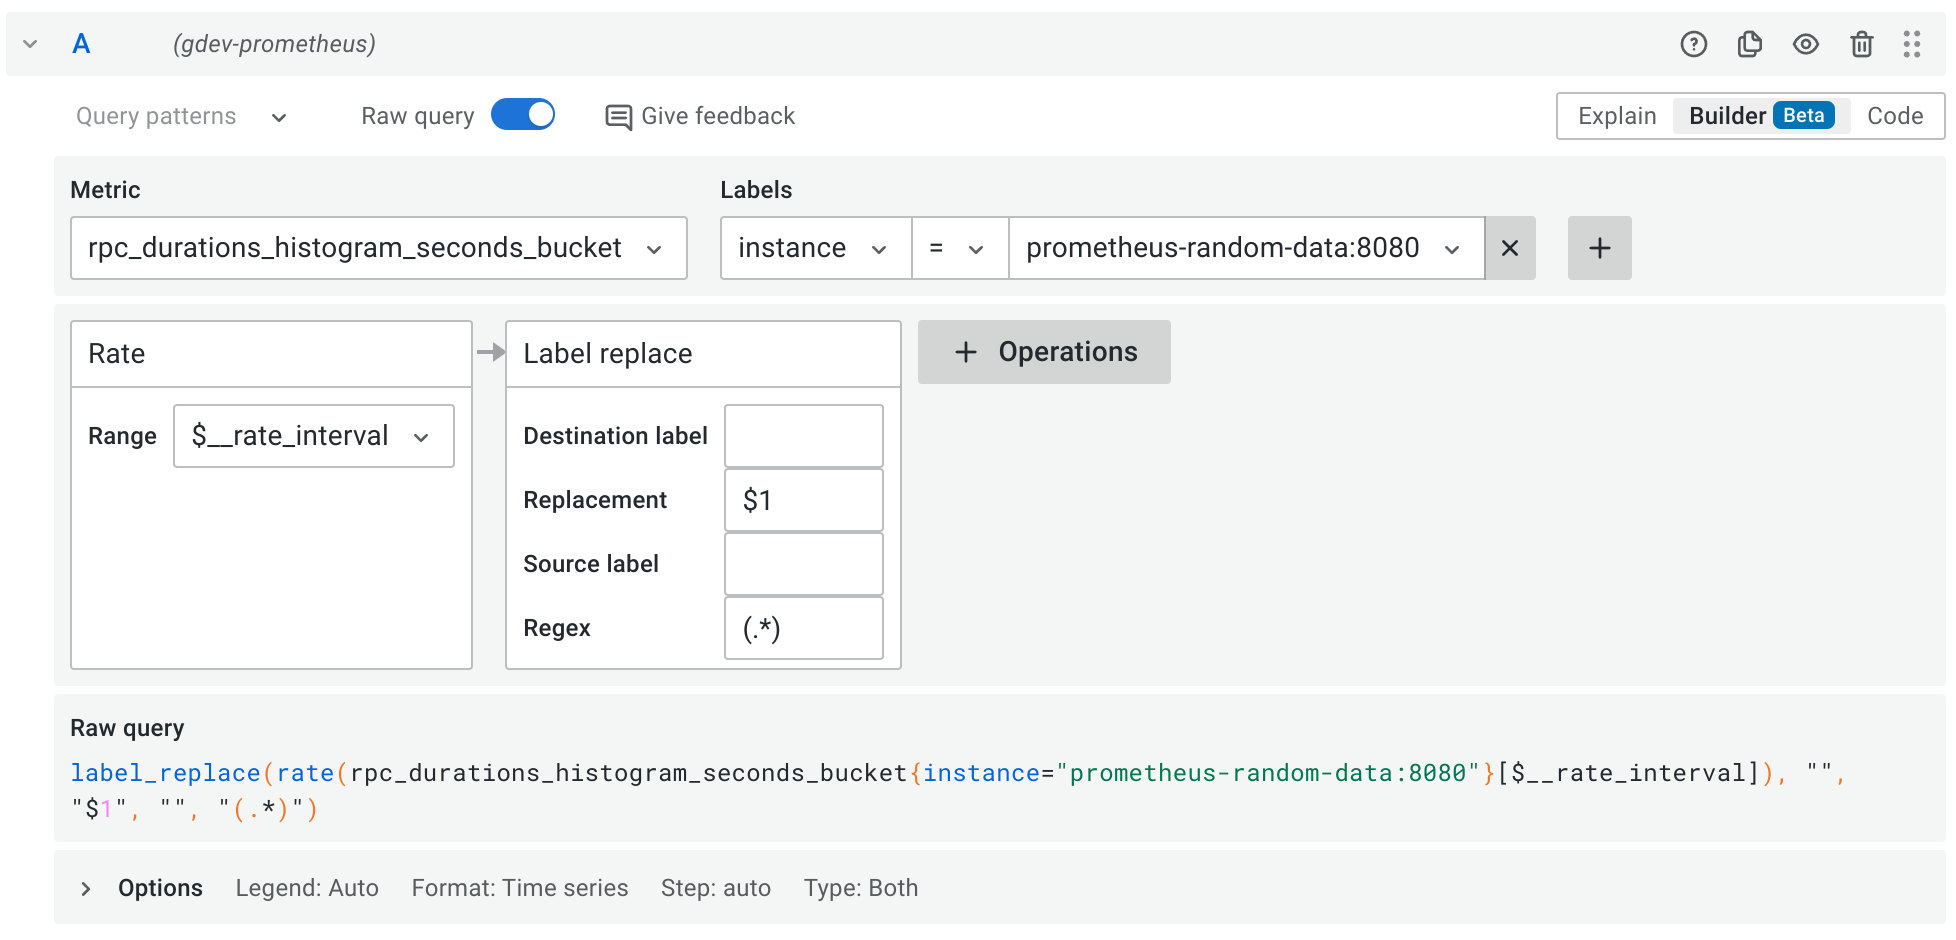
One downside in raw PromQL is that functions are nested, which means you read the query from the inside out and arguments for a function can be far away from the function name. In the Prometheus query builder in Grafana, we instead lay out operations left to right in a pipeline, which means it can be read more naturally and arguments are right next to the operation name.
Secondly, it provides names for parameters, which makes it easier to figure out its meaning and also can help understand the meaning of the operation.
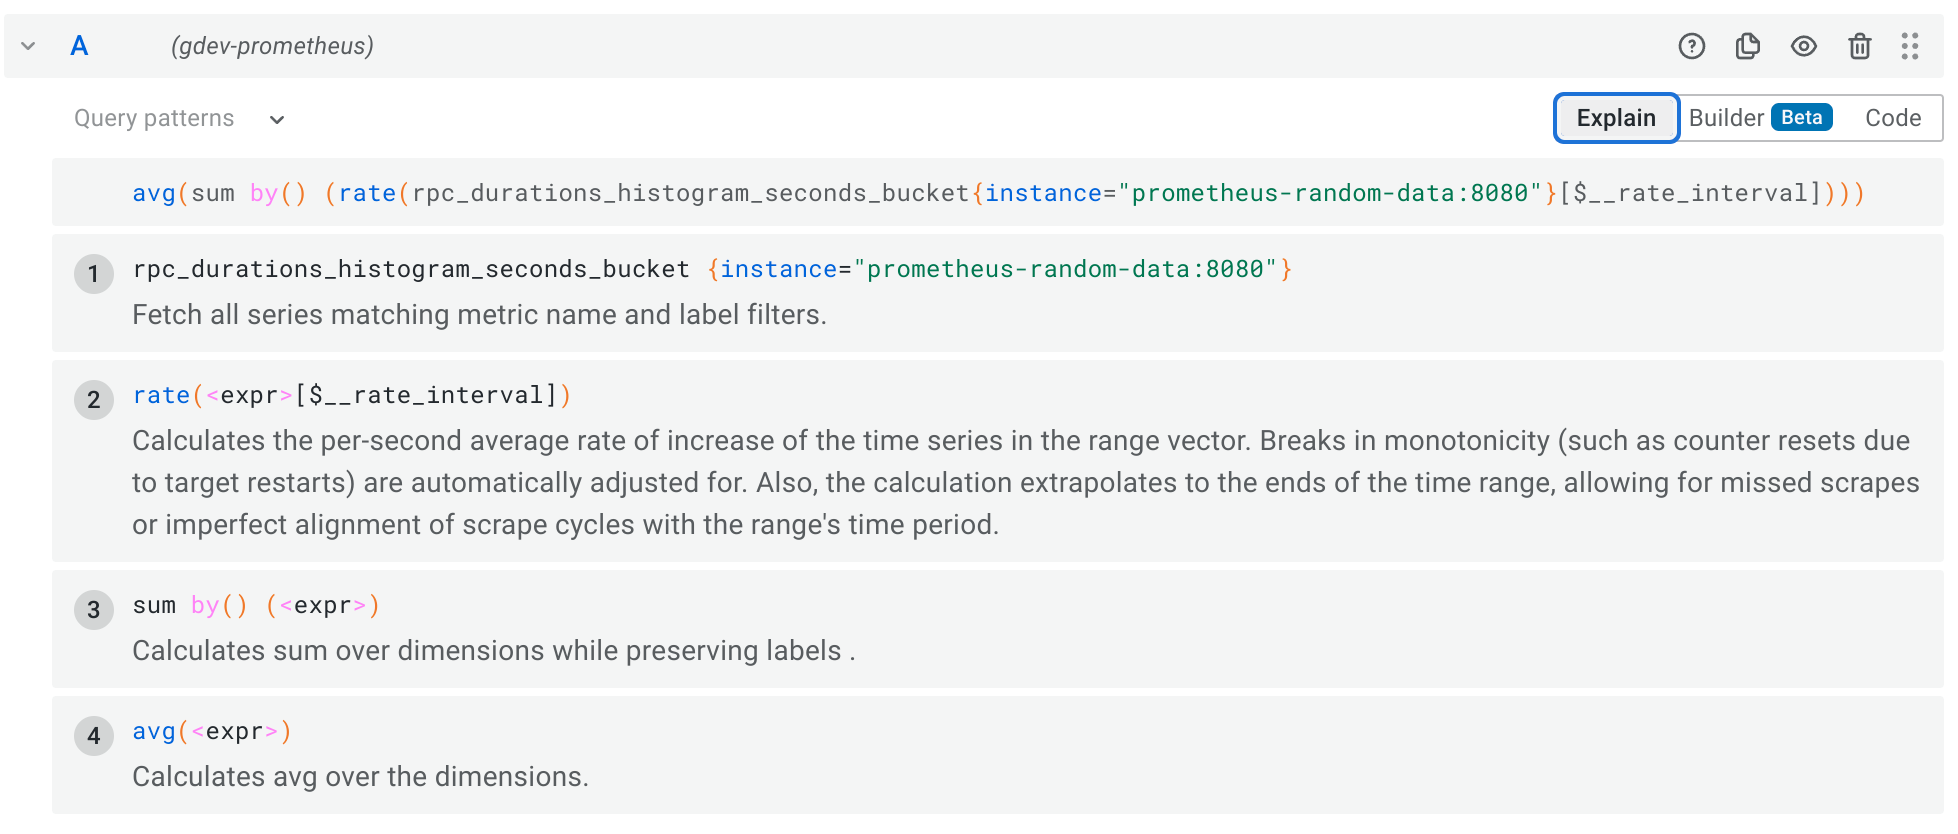
While the tooltip for each operation definitely helps with understanding the query, it gives you information only about that specific operation. To learn more about the query as a whole, there is also the Explain mode, which shows a step-by-step explanation of all query parts and the operations. This is going to help you learn about your query, or the queries of your teammates that you are not familiar with.
Switch between Code, Builder, and Explain mode at any time
Part of the great user experience in Grafana 9 is that you can jump between Code, Builder, and Explain mode anytime while keeping your query intact. So if you are stuck in Code mode not sure how to finish or extend the query, just switch to Builder and add the operations that you need or you can go back to Code if you feel more confident with raw PromQL.
Technical design behind the Prometheus query builder
If you are not interested in what is under the hood, you can skip this section and enjoy the new experience right away with Grafana 9. The easiest way to get started with Grafana is with Grafana Cloud, which offers a generous free tier and plans for each use case. (Sign up for a free account today!)
But if you are curious, read on! Or if you are curious but want to explore on your own, you can head to GitHub and dive directly into the code.
At first, this started as a project to build a visual editor for Prometheus, but it became pretty clear that this pattern of selector + operations is applicable for more data sources. Grafana Loki was an obvious example here because LogQL, the query language in Loki, started with the design goal of being as close to PromQL as possible. But other data sources also have a similar pattern.
So one of the goals was to easily repurpose this functionality in other tools, and you can see it in the code. All the operations are defined with a generic object that isn’t tied to a specific data source or query language. The main parts of that model are arguments and a renderer function that defines how that operation translates to the actual text of the query. This allows us to define different operations for Loki to cover the LogQL, and we are (almost) done.
Another important part for us was that we did not want the Builder mode to feel like a completely separate experience. We wanted all the modes —Code, Builder, and Explain — to simply present a different view of the same query. So we needed two-way synchronization between Code and Builder mode (I don’t mention Explain mode because you cannot edit the query there). To achieve that we use a PromQL (or LogQL) parser to first get an AST of the query and then traverse that and convert it into our own data structures used for the query builder. So in one direction, we have parsing and transformation, and in the other direction, objects of the visual query model render themselves into a text query.
Help us improve the Prometheus query builder
We strongly believe that this is just the beginning for the Prometheus query builder. Our goal is to make sure that all of our Prometheus users have the best experience while working with their queries in Grafana. If you have any thoughts, ideas, or feedback on how to make the Prometheus query builder better for you, please let us know in the GitHub discussion, or you can join us on our Grafana Labs Community Slack.
Also if you want to work on the Prometheus query builder and other awesome features in Grafana full time, we’re hiring!
If you are interested in seeing Prometheus and Grafana Loki query builders in action, join us on the Grafana Community call on July 21 at 16:00 UTC, during which the Grafana’s observability squad will lead discussions about these query builders and other features. And last but not least, if you would like to participate in the user research around the Prometheus query builder, you can contact our team.
For a demo of all the latest features in Grafana 9, including the Grafana Loki query builder, the new command palette, enhanced search and navigation features, and improved role-based access control (RBAC) functionality, watch the “Deep dive into Grafana 9” session from GrafanaCONline 2022.
Grafana Cloud is the easiest way to get started with metrics, logs, traces, and dashboards. We have a generous free forever tier and plans for every use case. Sign up for free now!