

Introducing the Sentry data source plugin for Grafana
We’re thrilled to announce the addition of the Sentry data source plugin to Grafana. Grafana Labs worked in partnership with Sentry, the code observability platform, to help development teams see the issues that matter and solve them faster — across their entire tech stack — so they can remove silos and ship with confidence.
What is Sentry?
Sentry is a code observability platform. With prioritized views, real-time alerting, and deep issue context, Sentry gives developers code-level visibility into their application so they can see crashes, slowdowns, and errors that matter; solve them faster with actionable details; and learn from historical trends to optimize code health over time.
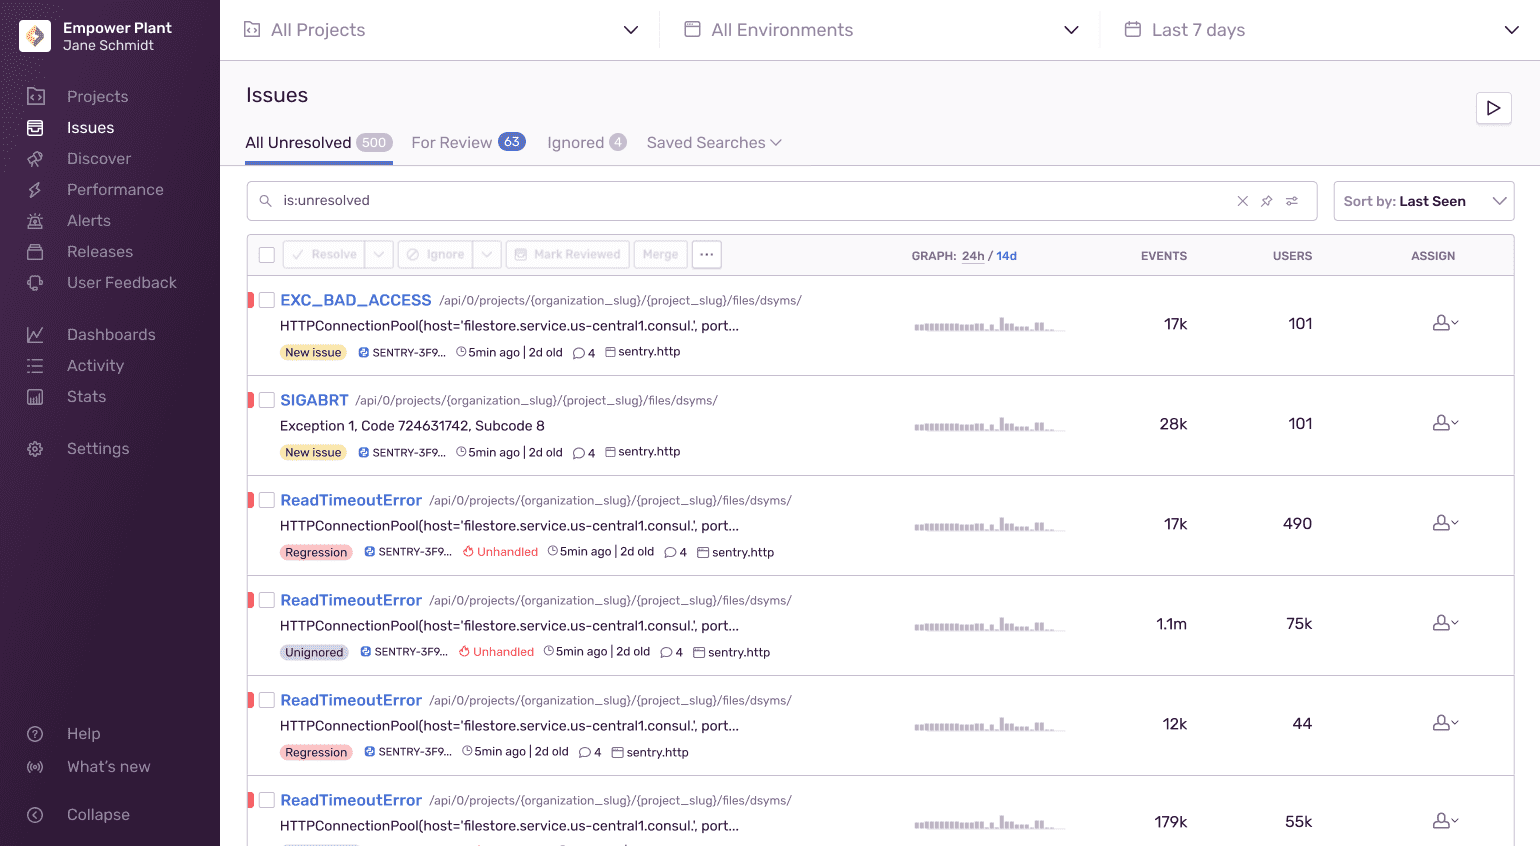
Getting started with Sentry is easy. Simply add a small snippet of code to your project, and Sentry captures information about events you care about, such as errors and performance issues.
Sentry then intelligently groups these events into issues. So instead of looking at 50,000 errors, you will see just the handful of issues in your application causing those errors alongside detailed context such as the commit that introduced the error, device type, release version, the code owner, and the user actions and functions leading up to when it occurred. As a result, you’ll be able to assign, troubleshoot, and resolve issues faster.
It’s super powerful, and just like Grafana, Sentry is open source and used by millions of people to make sense of billions of events happening on hundreds of platforms.
Why Sentry and Grafana?
By combining issue data from Sentry alongside information from other tools such as infrastructure health or support tickets into a single view in Grafana, you can detect and monitor critical issues faster, measure team effectiveness, and learn how to improve application health and team velocity over time. This means happier developers and happier users.
Getting Started
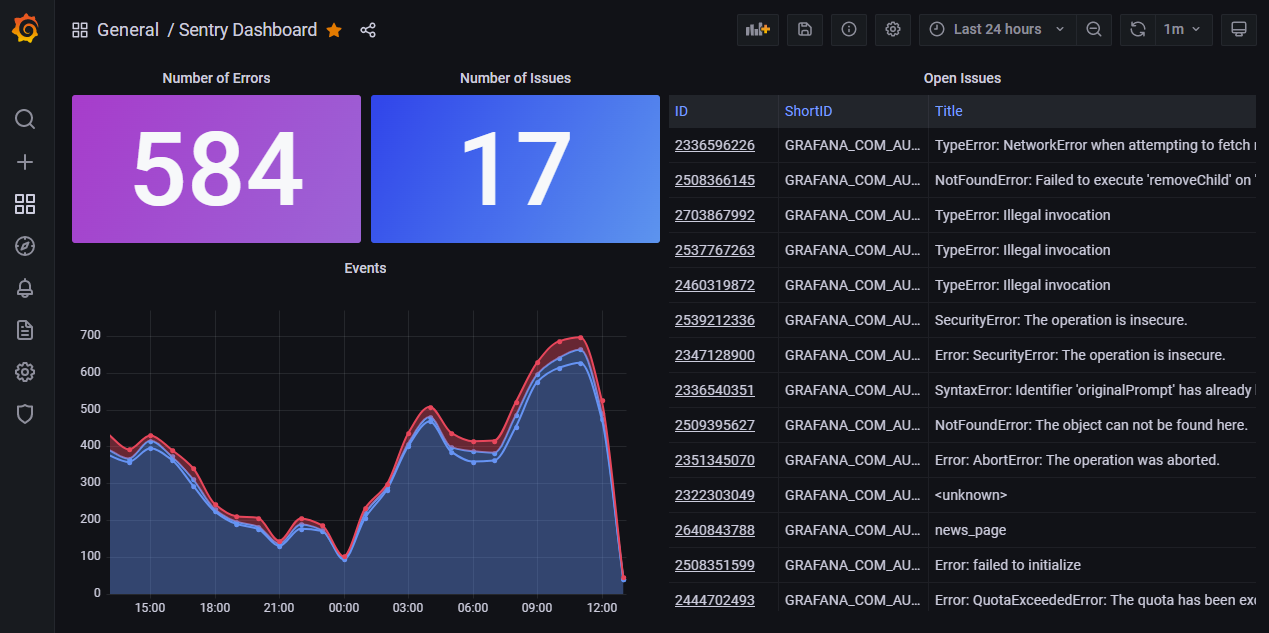
You can install the Sentry plugin for free today and start visualizing your Sentry issues and organization stats!
For example, below is a sample dashboard for a web-based hardware store. Now that we can combine the error rates from Sentry with sales data on completed purchases stored in our Snowflake data warehouse, we can quickly see if issues with the website are impacting transaction rates.

With Sentry now part of Grafana’s “big tent,” users can view the crucial data from Sentry alongside their other observability data — whether that’s more context from additional metrics and logs stored in other systems or even business data in data warehouses like Snowflake.
Thanks to the Sentry team for partnering with us on this! Grafana Labs is committed to continuing the partnership and maintaining this plugin, and we’re excited to add more features and to grow with Sentry.
To learn more about the Sentry plugin for Grafana, sign up now for our free webinar with Sentry on Jan. 13, 2022.


