
Set service level objectives and manage SLO alerts in Grafana Cloud
Grafana SLO is an application that makes it easy to create, manage, and scale service level objectives, SLO dashboards, and error budget alerts in Grafana Cloud.
The actually useful Grafana Cloud Free plan
- 10K metrics
- 3 active users
- Integration with Grafana Cloud IRM
Set SLOs in minutes
Create SLIs and SLOs with a guided UI and get started with prebuilt dashboards, alerts, and recording rules that help you prioritize your incident response.
Deploy SLOs as code
Scale SLOs as code with API and Terraform support, eliminating the need for repetitive, manual setup.
Get a high-level overview of your services
Track the metrics that matter with a snapshot of service level indicators and error budgets across your critical services.
Why use Grafana Cloud for service level objectives?
Assistance with setting SLOs
Having trouble getting started with SLOs? Grafana SLO provides step-by-step guidance to create service level objectives and prevents errors in your SLO setup.
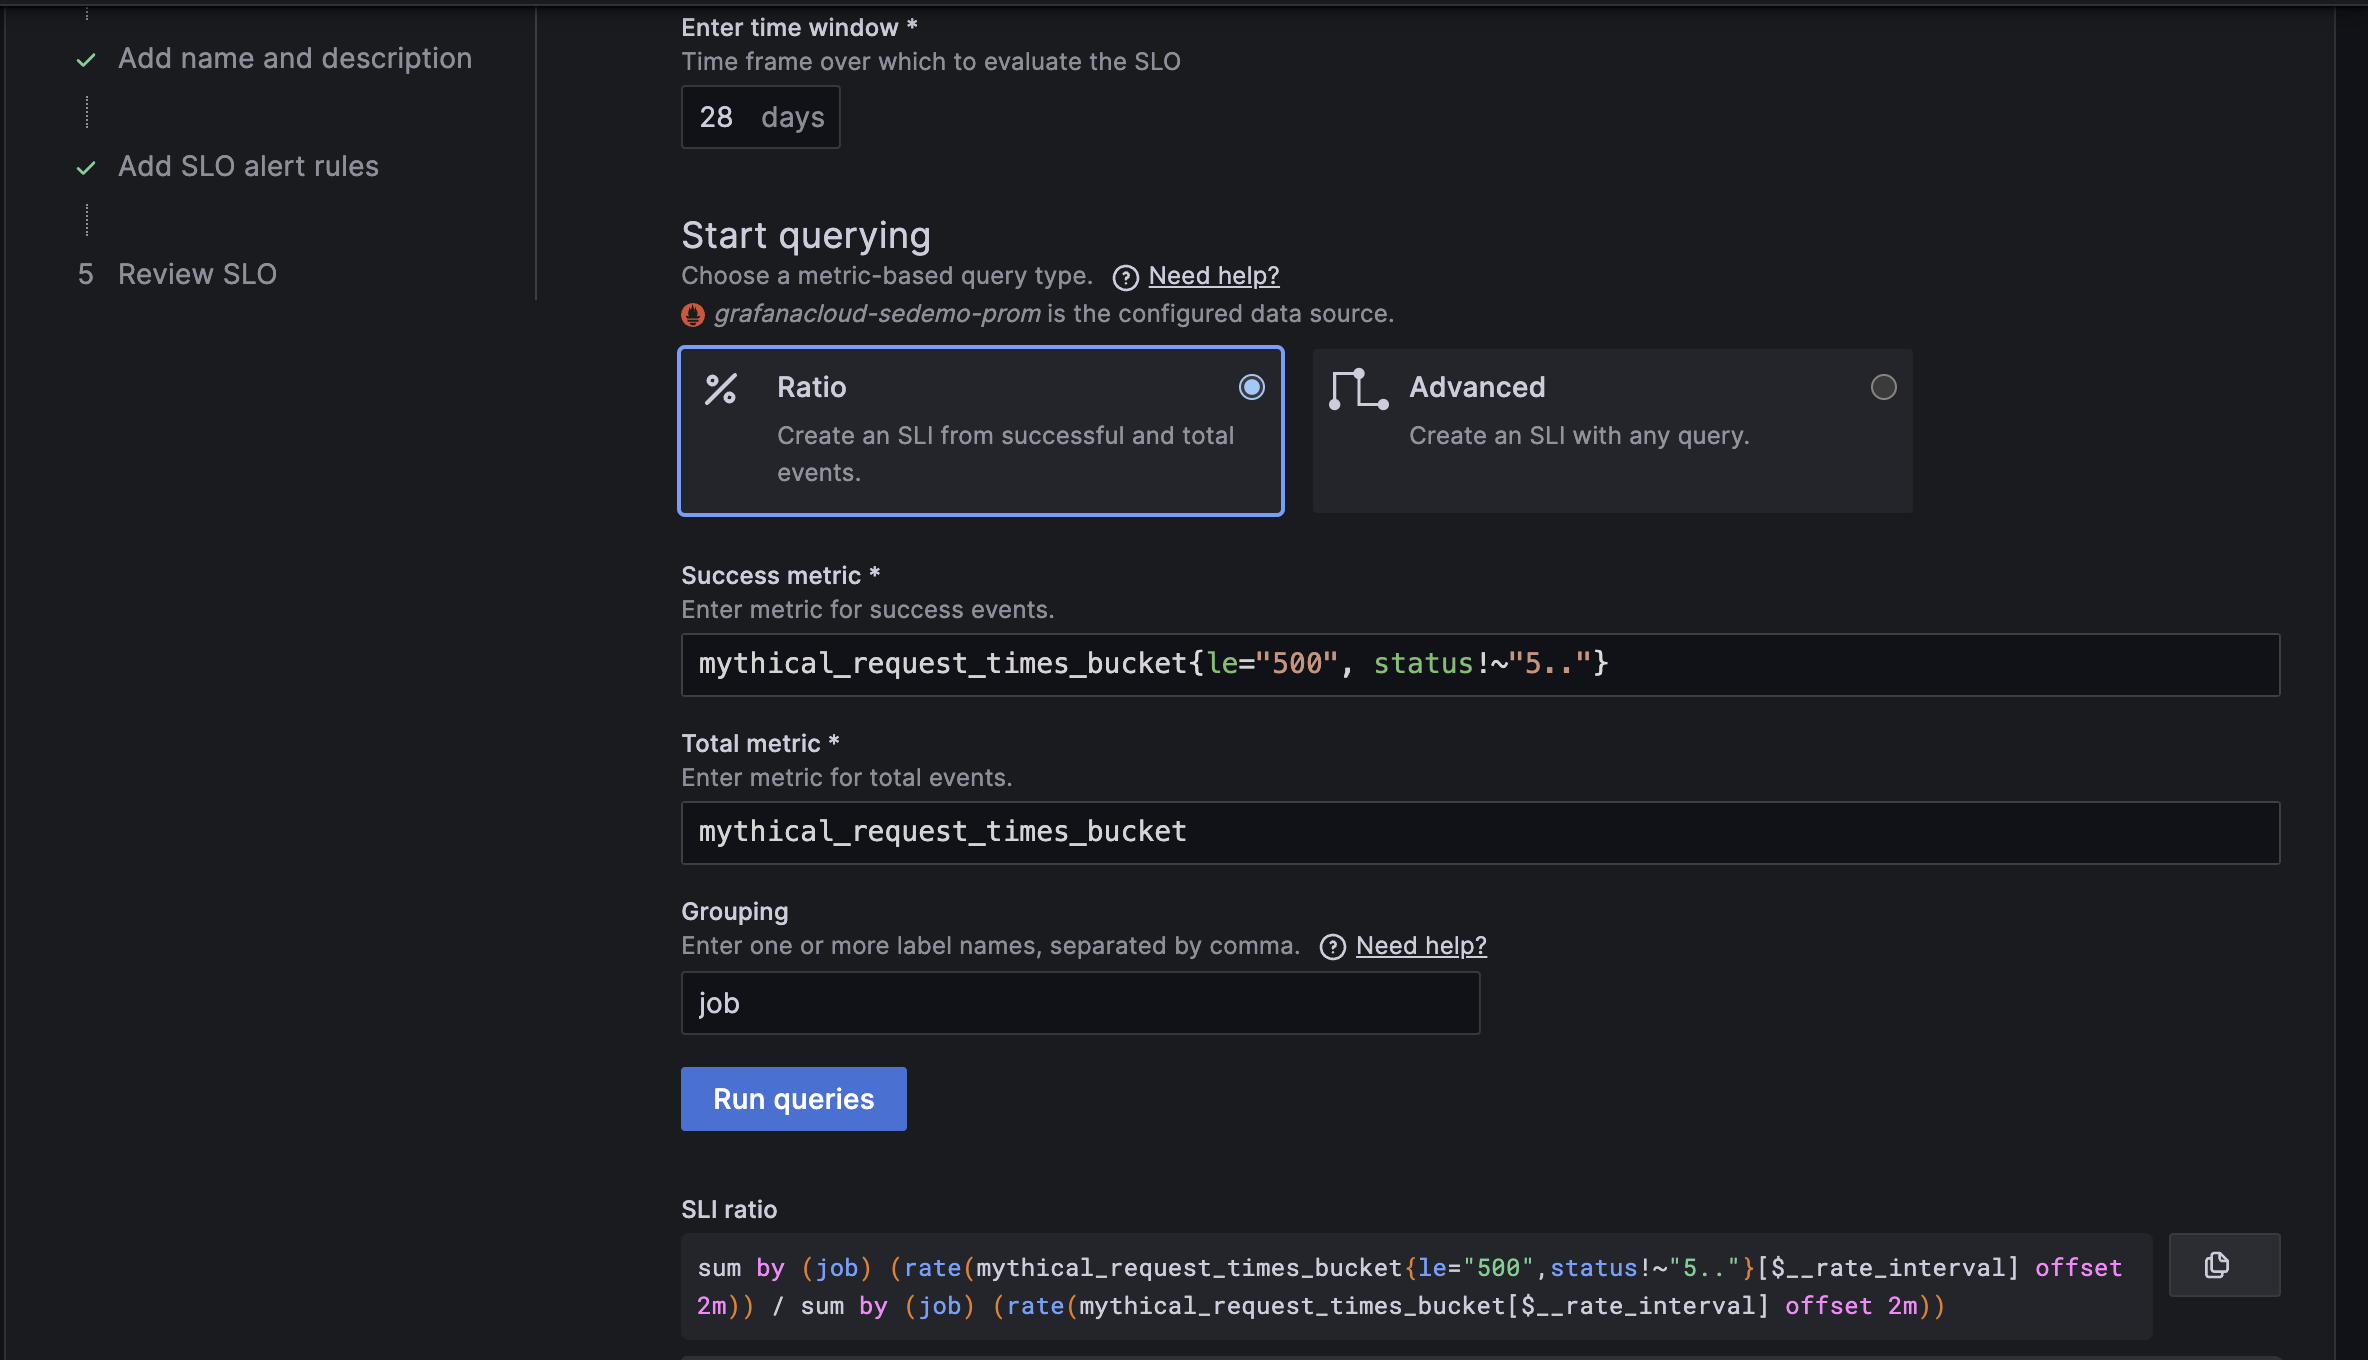
- Define service level indicators and configure an SLO with a guided wizard
- Create an SLO ratio with our query builder (no PromQL required!)
- Determine metrics and targets with useful tooltips to help you get started
Auto-generated SLO dashboards and alerts
Want to reduce your SLO-related workload? Grafana SLO builds dashboards and alerts for you once you define your SLO targets.
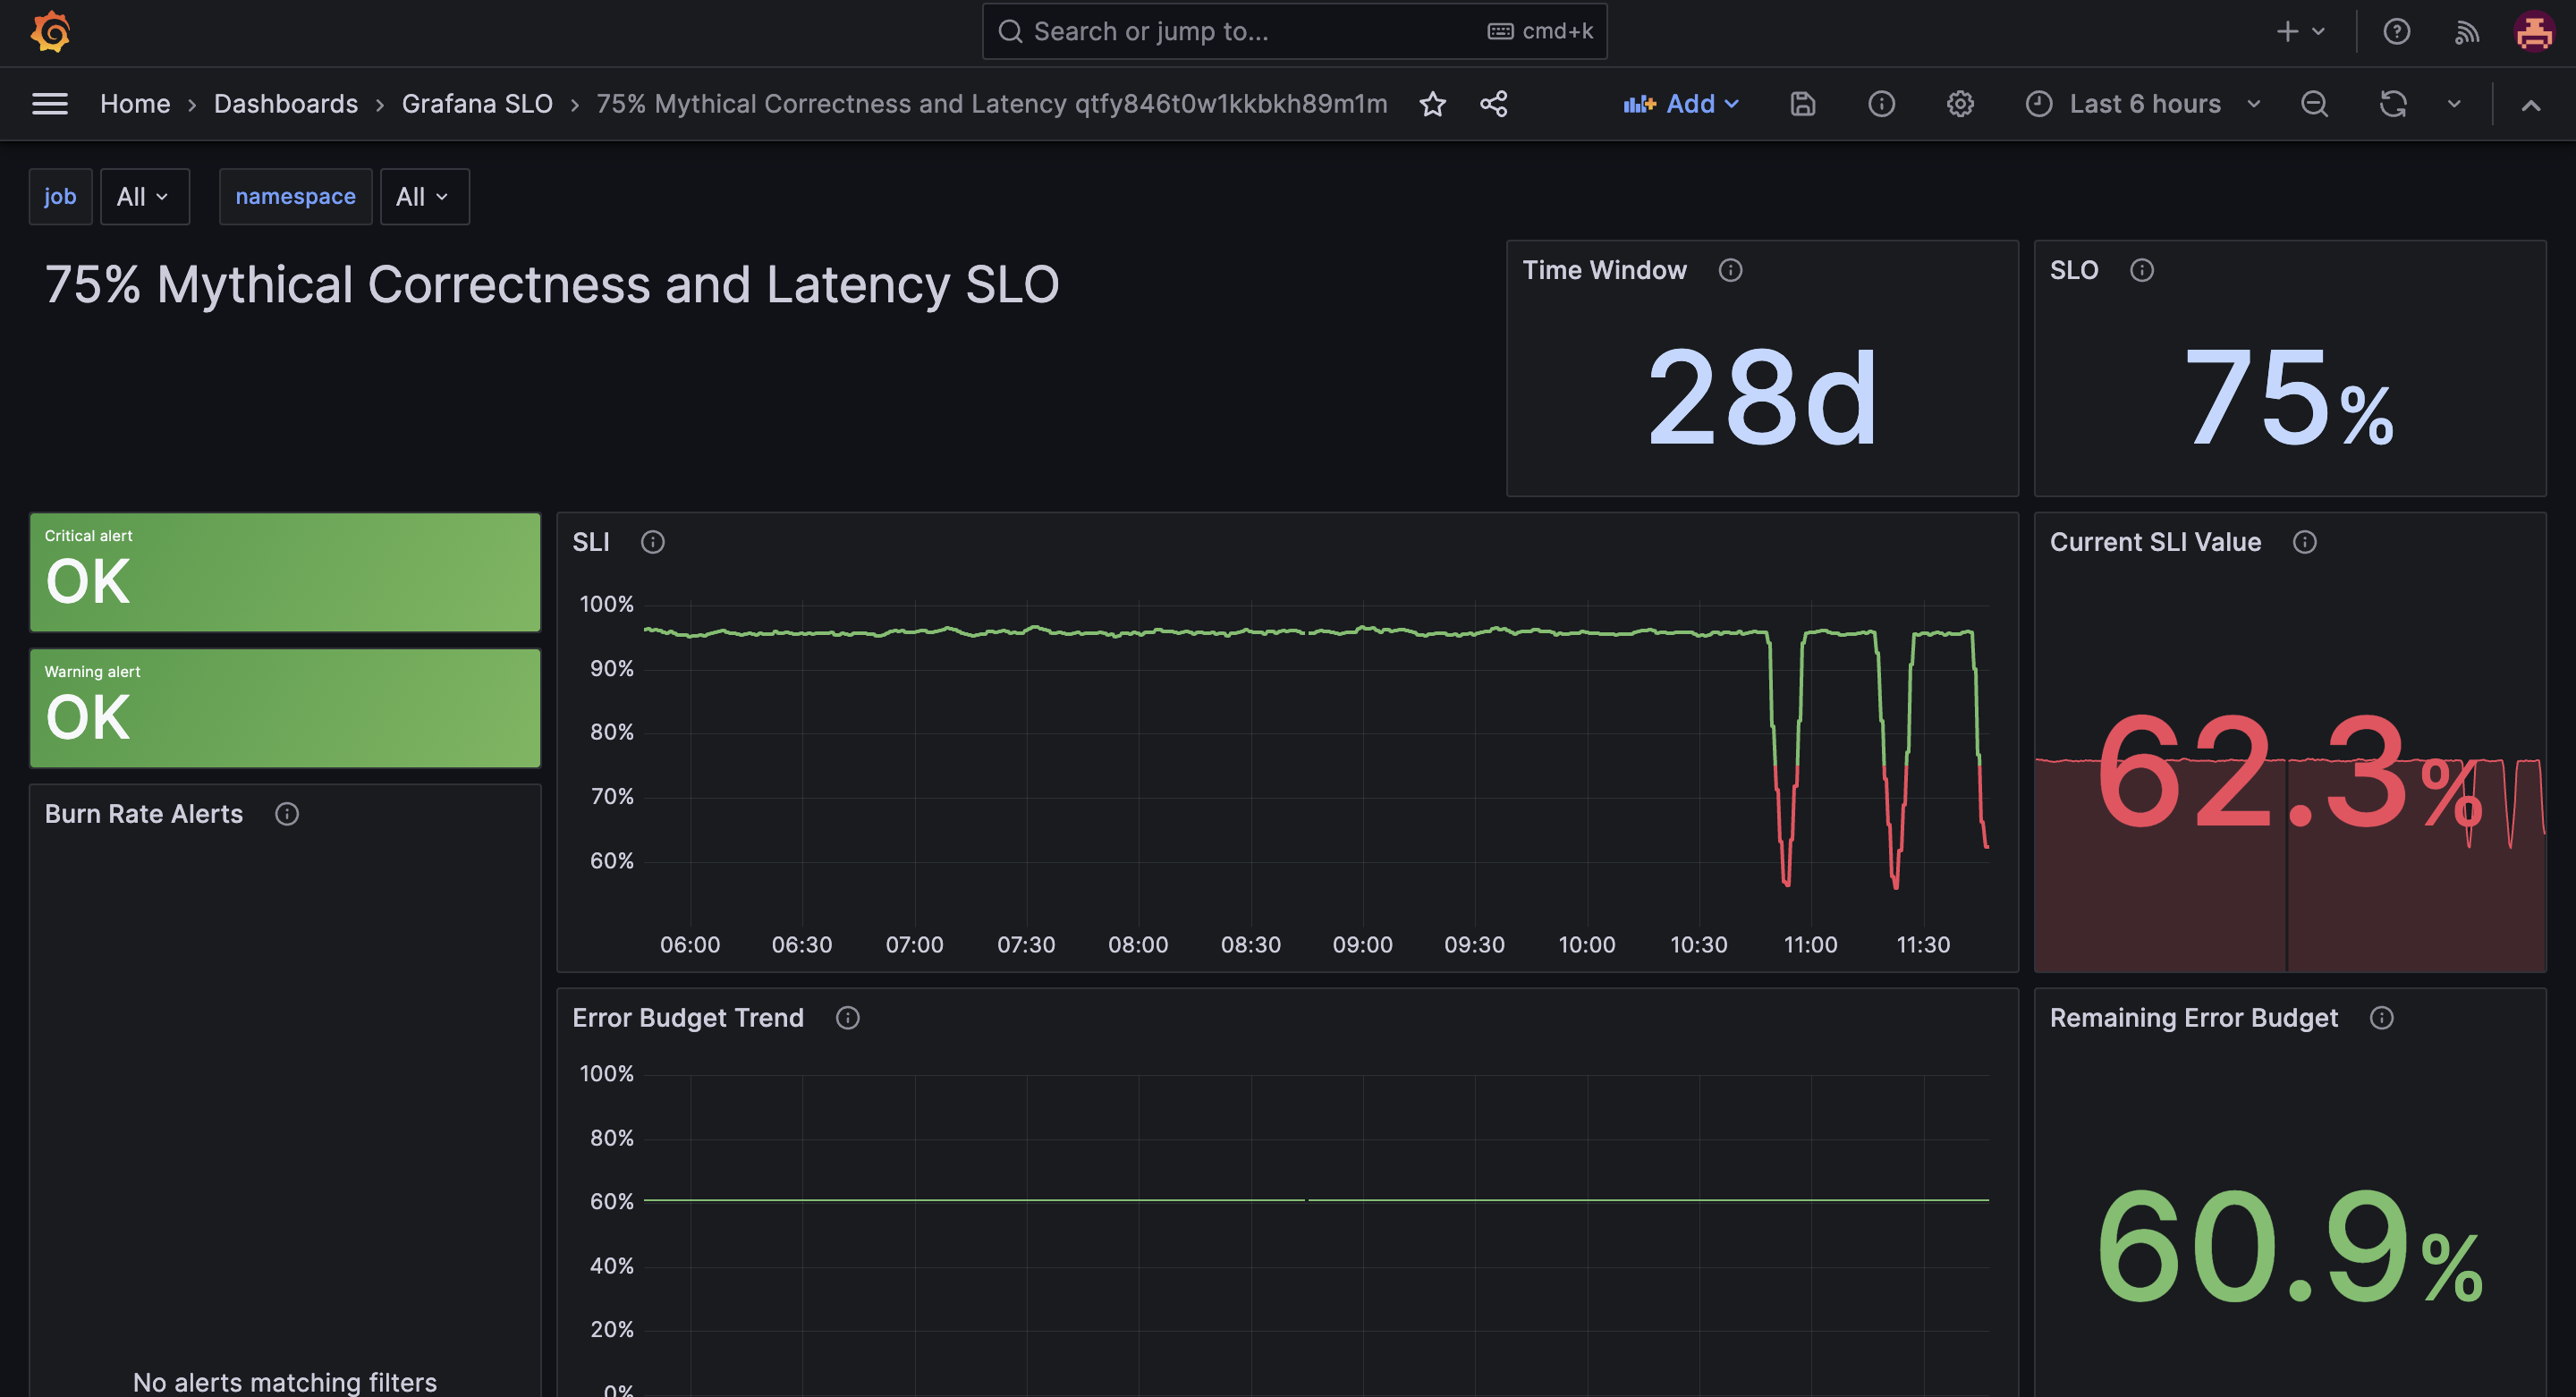
- Visualize SLO metrics in dynamic dashboards that include SLO and SLI status, remaining error budget, and burn rate.
- Maintain control of SLOs with precise fast-burn and slow-burn alerts that help decrease on-call loads.
Aggregate view of all SLOs
Getting questions about application performance or downtime? Grafana SLO gives you a complete overview of your SLOs, including status updates and remaining error budgets, to help track SLOs and keep teams informed.
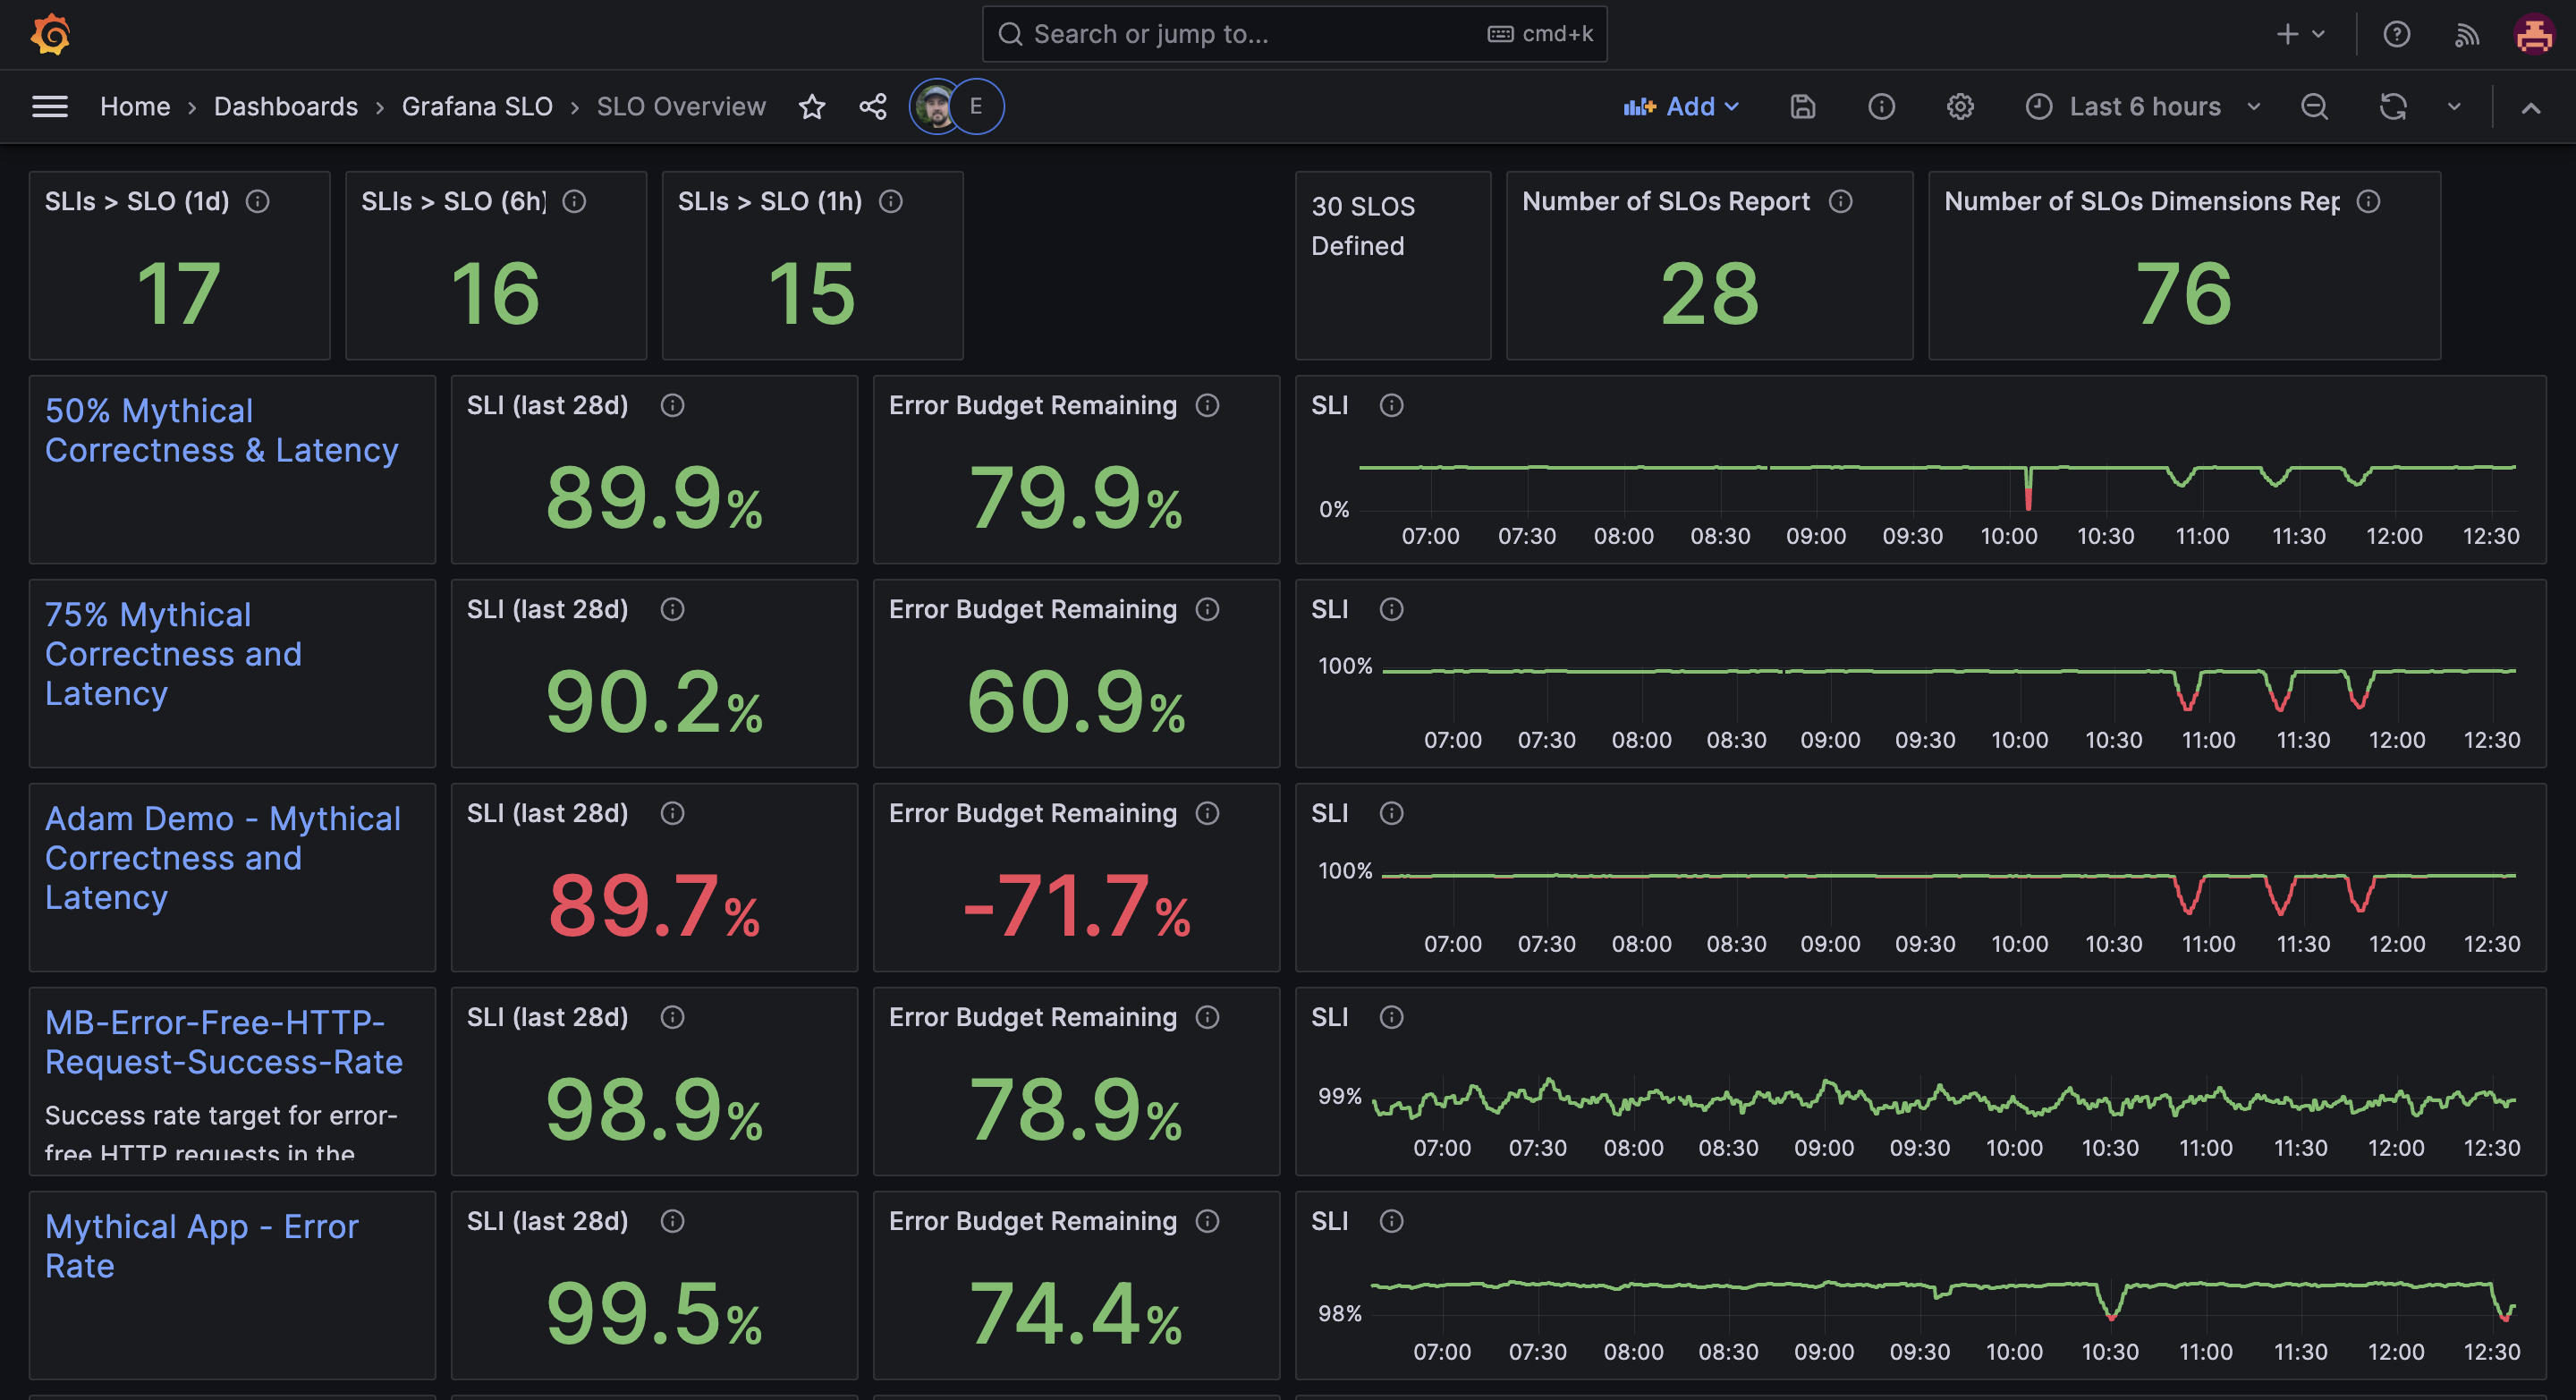
- Monitor SLI performance and error budgets with the SLO Overview dashboard
- Deliver automated SLO status reports to stakeholders
Enable SLOs as code
Managing SLOs for multiple teams in your organization? Easily scale your service level objectives by configuring SLOs as code.
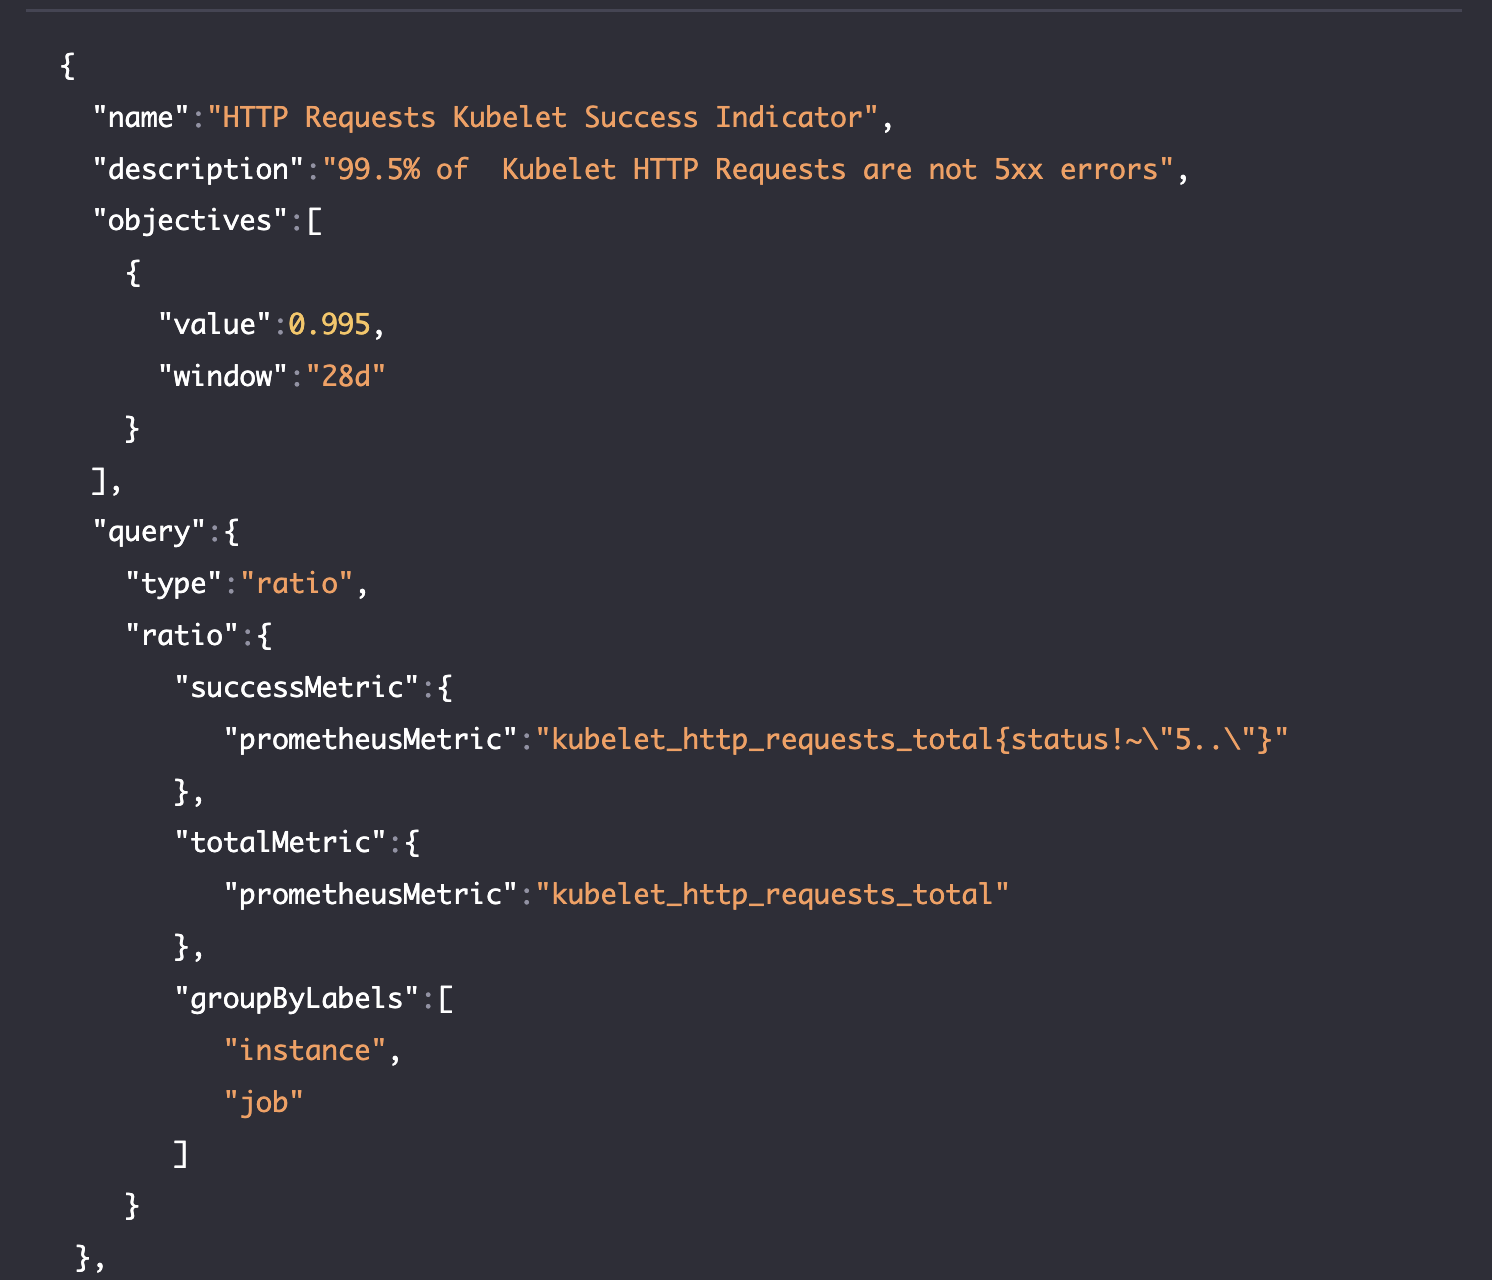
- Provision SLIs/SLOs, dashboards, and alerts as code via API or Terraform support
- Customize your service level objective with or without labels