
Important: This documentation is about an older version. It's relevant only to the release noted, many of the features and functions have been updated or replaced. Please view the current version.
Alert list
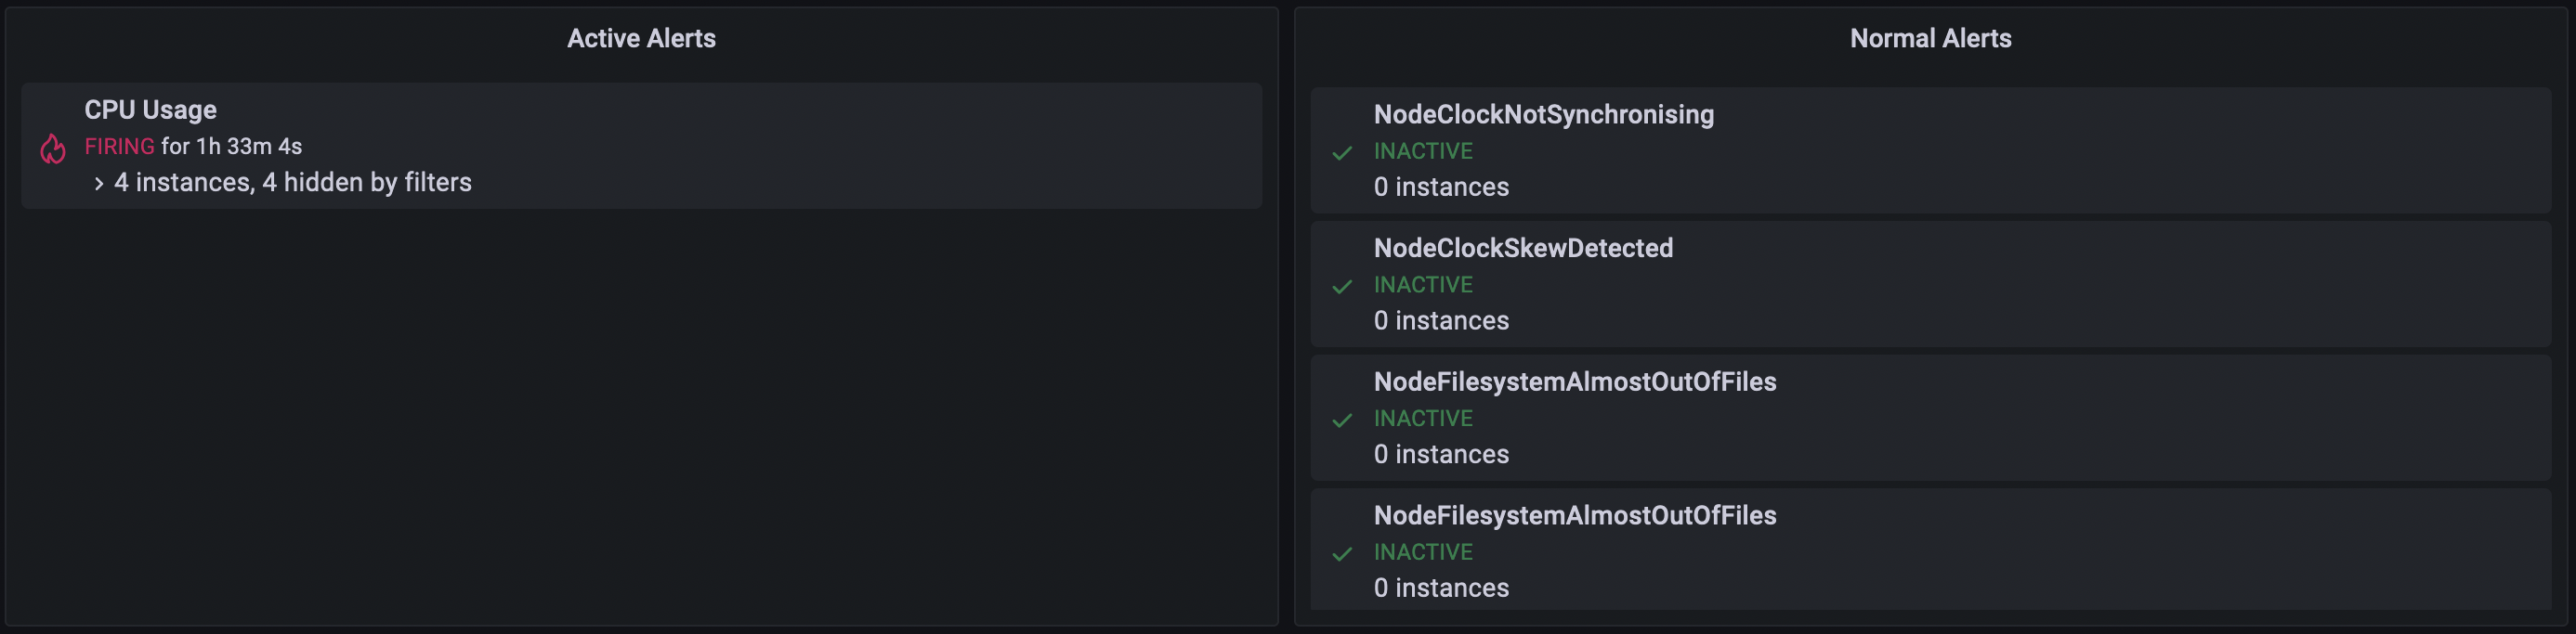
Alert lists allow you to display a list of important alerts that you want to track. You can configure the alert list to show the current state of your alert, such as firing, pending, or normal. Learn more about alerts in [Grafana Alerting overview][].
On each dashboard load, this visualization queries the alert list, always providing the most up-to-date results.
Configure an alert list
Once you’ve created a dashboard, the following video shows you how to configure an alert list visualization:
Options
Use the following options to refine your alert list visualization.
Group mode
Choose between Default grouping to show alert instances grouped by their alert rule, or Custom grouping to show alert instances grouped by a custom set of labels.
Max items
Sets the maximum number of alerts to list. By default, Grafana sets this value to 10.
Sort order
Select how to order the alerts displayed. Choose from:
- Alphabetical (asc) - Alphabetical order.
- Alphabetical (desc) - Reverse alphabetical order.
- Importance - By importance according to the following values, with 1 being the highest:
- alerting: 1
- firing: 1
- no_data: 2
- pending: 3
- ok: 4
- paused: 5
- inactive: 5
- Time (asc) - Newest active alert instances first.
- Time (desc) - Oldest active alert instances first.
Alerts linked to this dashboard
Toggle the switch on to only show alerts from the dashboard the alert list is in.
Filter
These options allow you to limit alerts shown to only those that match the query, folder, or tags you choose.
Alert name
Filter alerts by name.
Alert instance label
Filter alert instances using label querying. For example,{severity="critical", instance=~"cluster-us-.+"}.
Datasource
Filter alerts from the selected data source.
Folder
Filter alerts by the selected folder. Only alerts from dashboards in this folder are displayed.
Alert state filter
Choose which alert states to display in this visualization.
- Alerting / Firing
- Pending
- No Data
- Normal
- Error
Was this page helpful?
Related resources from Grafana Labs


