
What’s new in Grafana v10.4
Welcome to Grafana 10.4! This minor release contains some notable improvements in its own right, as well as early previews of functionality we intend to turn on by default in Grafana v11. Read on to learn about a quicker way to set up alert notifications, an all-new UI for configuring single sign-on, and improvements to our Canvas, Geomap, and Table panels.
For even more detail about all the changes in this release, refer to the changelog. For the specific steps we recommend when you upgrade to v10.4, check out our Upgrade Guide.
Dashboards and visualizations
AngularJS plugin warnings in dashboards
Generally available in all editions of Grafana
AngularJS support in Grafana was deprecated in v9 and will be turned off by default in Grafana v11. When this happens, any plugin which depended on AngularJS will not load, and dashboard panels will be unable to show data.
To help you understand where you may be impacted, Grafana now displays a warning banner in any dashboard with a dependency on an AngularJS plugin. Additionally, warning icons are present in any panel where the panel plugin or underlying data source plugin has an AngularJS dependency.
This complements the existing warnings already present on the Plugins page under the administration menu.
In addition, you can use our detect-angular-dashboards open source tool, which can be run against any Grafana instance to generate a report listing all dashboards that have a dependency on an AngularJS plugin, as well as which plugins are in use. This tool also supports the detection of private plugins that are dependent on AngularJS, however this particular feature requires Grafana v10.1.0 or higher.
Use the aforementioned tooling and warnings to plan migrations to React based visualizations and data sources included in Grafana or from the Grafana plugins catalog.
To learn more, refer to the Angular support deprecation, which includes recommended alternative plugins.
Data visualization quality of life improvements
Generally available in all editions of Grafana
We’ve made a number of small improvements to the data visualization experience in Grafana.
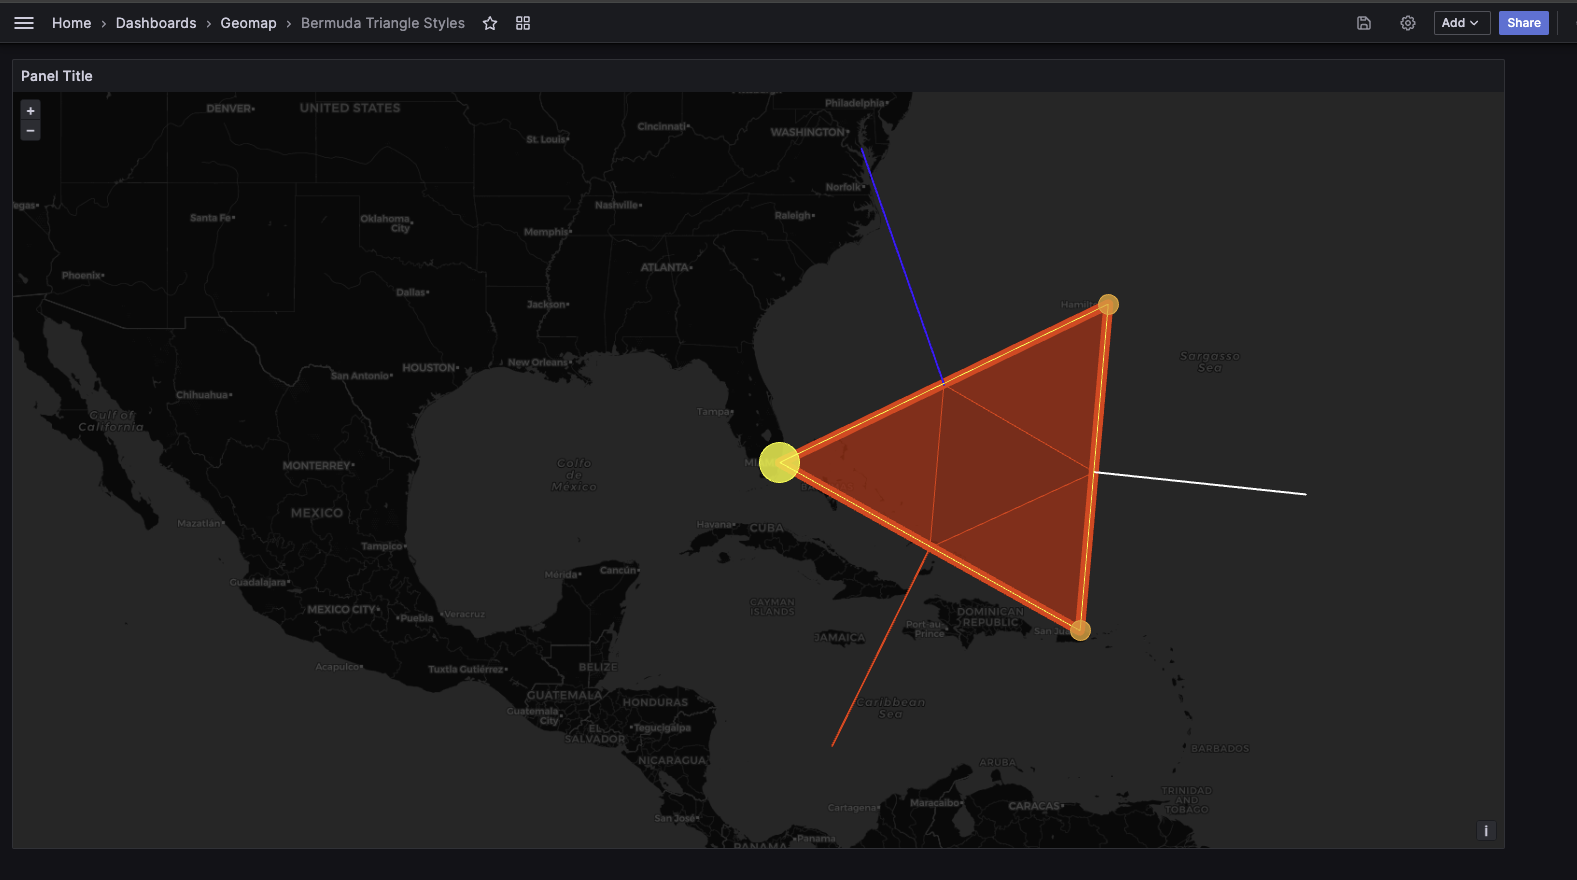
Geomap geojson layer now supports styling
You can now visualize geojson styles such as polygons, point color/size, and line strings. To learn more, refer to the documentation.
Canvas elements now support snapping and aligning
You can precisely place elements in a canvas with ease as elements now snap into place and align with one another.
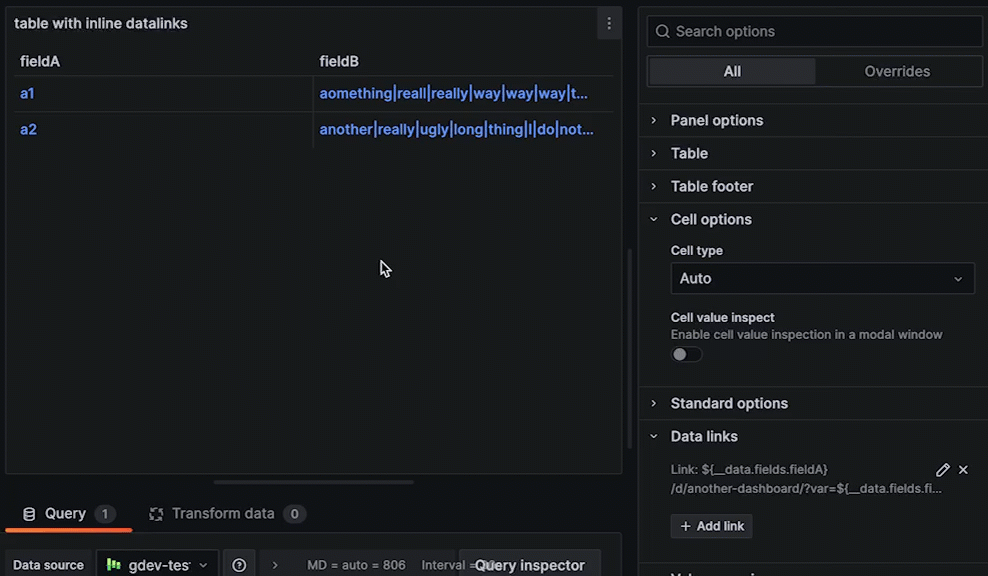
View data links inline in table visualizations
You can now view your data links inline to help you keep your tables visually streamlined.
Create subtables in table visualizations with Group to nested tables
Available in public preview in all editions of Grafana
You can now create subtables out of your data using the new Group to nested tables transformation. To use this feature, enable the groupToNestedTableTransformation feature toggle.
Set library panel permissions with RBAC
Generally available in Grafana Enterprise and Grafana Cloud
We’ve added the option to manage library panel permissions through role-based access control (RBAC). With this feature, you can choose who can create, edit, and read library panels. RBAC provides a standardized way of granting, changing, and revoking access when it comes to viewing and modifying Grafana resources, such as dashboards, reports, and administrative settings.
Tooltip improvements
Available in public preview in all editions of Grafana
We’ve made a number of small improvements to the way tooltips work in Grafana. To try out the new tooltips, enable the newVizTooltips feature toggle.
Copy on click support
You can now copy the content from within a tooltip by clicking on the text.

Scrollable content
You can now scroll the content of a tooltip, which allows you to view long lists. This is currently supported in the time series, candlestick, and trend visualizations. We’ll add more improvements to the scrolling functionality in a future version.

Added tooltip options for candlestick visualization
The default tooltip options are now also visible in candlestick visualizations.
Hover proximity option in time series
We’ve added a tooltip hover proximity limit option (in pixels), which makes it possible to reduce the number of hovered-over data points under the cursor when two datasets are not aligned in time.

Return to previous
Available in public preview in all editions of Grafana
When you’re browsing Grafana - for example, exploring the dashboard and metrics related to an alert - it’s easy to end up far from where you started and hard get back to where you came from. The ‘Return to previous’ button is an easy way to go back to the previous context, like the alert rule that kicked off your exploration. This first release works for Alerts, and we plan to expand to other apps and features in Grafana in future releases to make it easier to navigate around.
Return to Previous is rolling out across Grafana Cloud now. To try Return to Previous in self-managed Grafana, turn on the returnToPrevious feature toggle in Grafana v10.4 or newer.
Note
The term context refers to applications in Grafana like Incident and OnCall, as well as core features like Explore and Dashboards.
To notice a change in your context, look at Grafana’s breadcrumbs. If you go from Home > Dashboards to Home > Explore, you’ve changed context. If you go from Home > Dashboards > Playlist > Edit playlist to Home > Dashboards > Reporting > Settings, you are in the same context.
Alerting
Simplified Alert Notification Routing
Generally available in all editions of Grafana
This feature simplifies your options for configuring where your notifications are sent when an alert rule fires. Choose an existing contact point directly from within the alert rule creation form without the need to label match notification policies. You can also set optional muting, grouping, and timing settings directly in the alert rule.
Simplified routing inherits the alert rule RBAC, increasing control over notification routing while preventing accidental notification policy updates, ensuring critical notifications make it to their intended contact point destination.
To try out Simplified Alert Notification Routing enable the alertingSimplifiedRouting feature toggle.
Grafana Alerting upgrade with rule preview
Generally available in all editions of Grafana
Users looking to migrate to the new Grafana Alerting product can do so with confidence with the Grafana Alerting migration preview tool. The migration preview tool allows users to view, edit, and delete migrated rules prior cutting over, with the option to roll back to Legacy Alerting.
Rule evaluation spread over the entire evaluation interval
Generally available in all editions of Grafana
Grafana Alerting previously evaluated rules at the start of the evaluation interval. This created a sudden spike of resource utilization, impacting data sources. Rule evaluation is now spread over the entire interval for smoother performance utilization of data sources.
UTF-8 Support for Prometheus and Mimir Alertmanagers
Generally available in all editions of Grafana
Grafana can now be used to manage both Prometheus and Mimir Alertmanagers with UTF-8 configurations. For more information, please see the release notes for Alertmanager 0.27.0.
Authentication and authorization
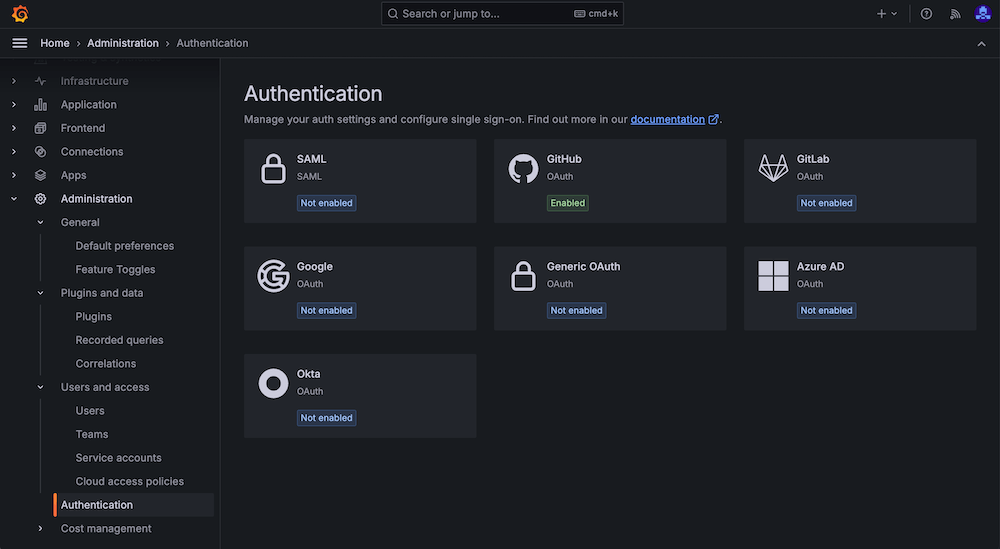
SSO Settings UI and Terraform resource for configuring OAuth providers
Available in public preview in all editions of Grafana
Configuring OAuth providers was a bit cumbersome in Grafana: Grafana Cloud users had to reach out to Grafana Support, self-hosted users had to manually edit the configuration file, set up environment variables, and then they had to restart Grafana. On Cloud, the Advanced Auth page is there to configure some of the providers, but configuring Generic OAuth hasn’t been available until now and there was no way to manage the settings through the Grafana UI, nor was there a way to manage the settings through Terraform or the Grafana API.
Our goal is to make setting up SSO for your Grafana instance simple and fast.
To get there, we are introducing easier self-serve configuration options for OAuth in Grafana. All of the currently supported OAuth providers are now available for configuration through the Grafana UI, Terraform and via the API. From the UI, you can also now manage all of the settings for the Generic OAuth provider.
We are working on adding complete support for configuring all other supported OAuth providers as well, such as GitHub, GitLab, Google, Microsoft Azure AD and Okta. You can already manage some of these settings via the new self-serve configuration options, and we’re working on adding more at the moment.
Data sources
Note
The following data sources are released separately from Grafana itself. They are included here for extra visibility.
PagerDuty enterprise data source for Grafana
Generally available in Grafana Enterprise and Grafana Cloud
PagerDuty enterprise data source plugin for Grafana allows you to query incidents data or visualize incidents using annotations.
Note
Plugin is currently in a preview phase.
You can find more information and how to configure the plugin in the documentation.
Screenshots:


SurrealDB Data Source
Experimental in all editions of Grafana
A SurrealDB data source has been added to the Plugin Catalog, enabling the integration of SurrealDB, a real-time, multi-model database, with Grafana’s visualization capabilities. This datasource allows users to directly query and visualize data from SurrealDB within Grafana, using SurrealDB’s query language.
The SurrealDB data source launches with just the basics today. You can write queries in SurrealQL using the built-in query editor, although many Grafana features like macros are not supported for now.
You can find more information and how to configure the plugin on Github.
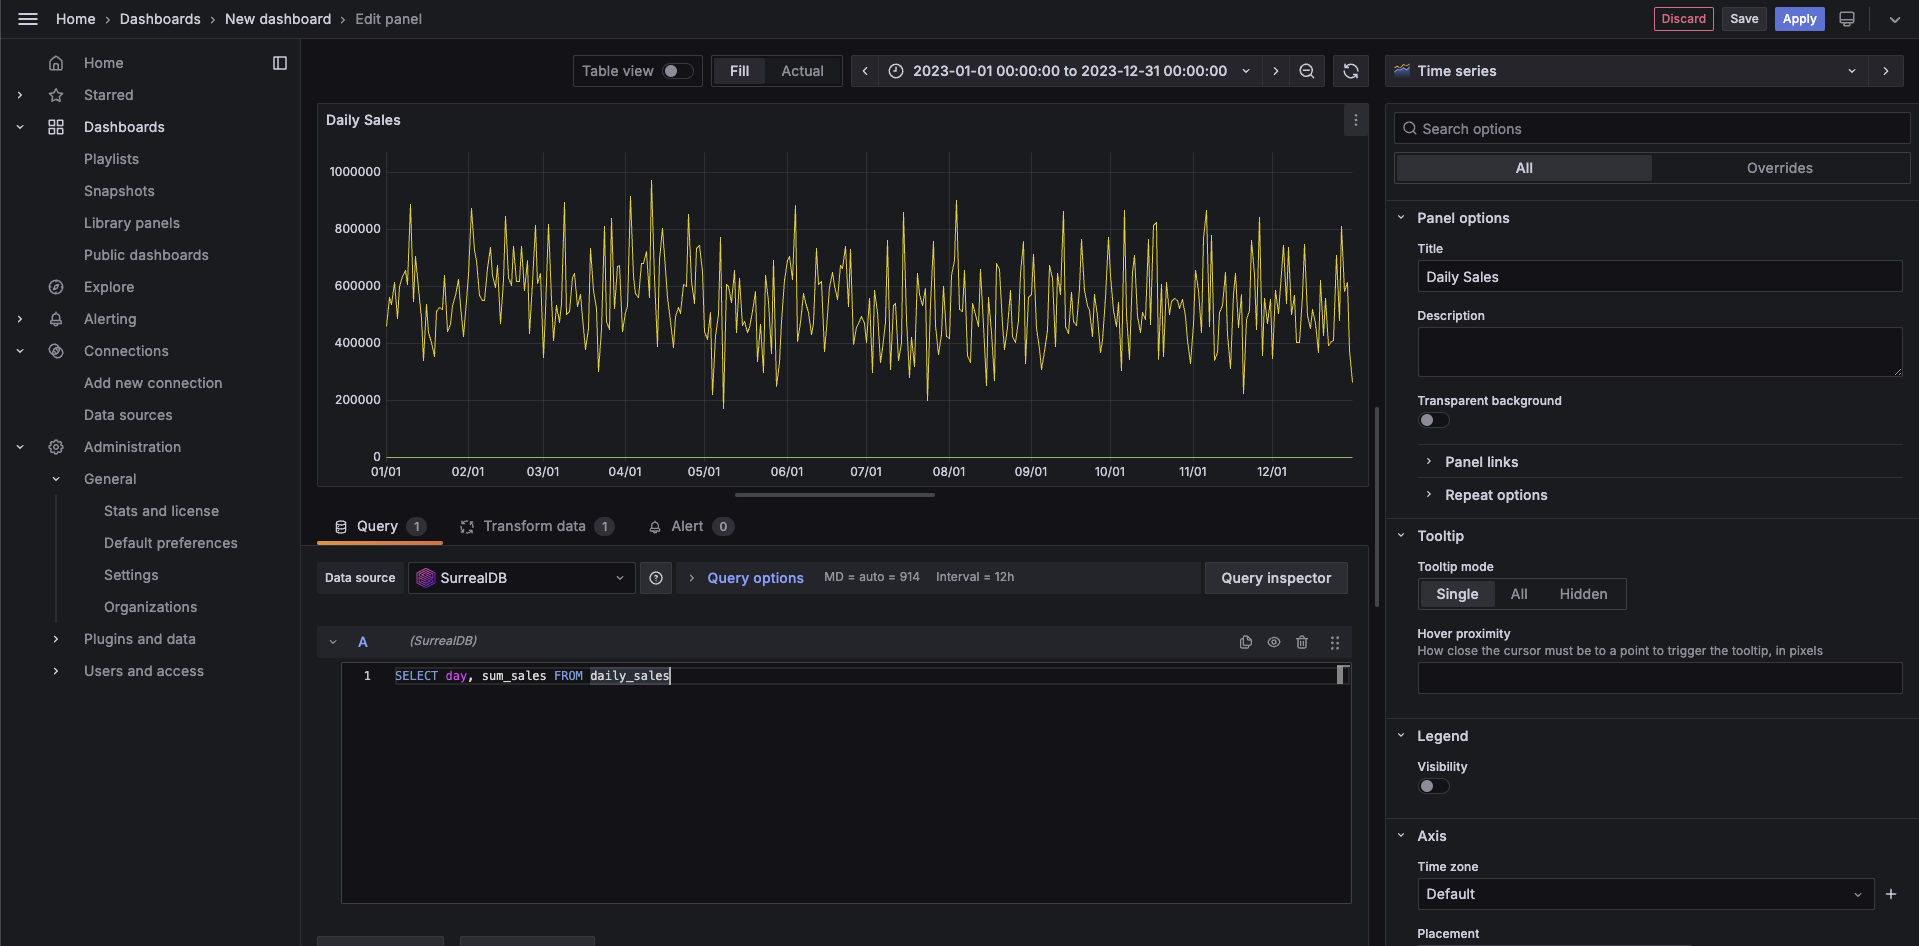
Table Visualization for Logs
Generally available in all editions of Grafana
The table visualization for logs, announced in public preview for Grafana 10.3, is generally available in Cloud (all editions) and with Grafana 10.4.
New to the table visualization with 10.4:
- the ability to sort columns
- data type autodetection of fields
- autodetection and clean formatting of json fields
Try it out today!
Was this page helpful?
Related resources from Grafana Labs


