
Windows integration for Grafana Cloud
Monitor Windows instances using Grafana Agent installed. The integration comes with pre installed dashboards, which give an overview of your Windows’ fleet at once, a single host overview, as well as additional dashboards that provide more metrics for further system performance analysis. The integration also provides dashboard showing Windows event logs.
This integration includes 7 useful alerts and 5 pre-built dashboards to help monitor and visualize Windows metrics and logs.
Before you begin
This integration relies on a Grafana Alloy instance running on a Windows machine. See the following sections for details.
Install Windows integration for Grafana Cloud
- In your Grafana Cloud stack, click Connections in the left-hand menu.
- Find Windows and click its tile to open the integration.
- Review the prerequisites in the Configuration Details tab and set up Grafana Agent to send Windows metrics and logs to your Grafana Cloud instance.
- Click Install to add this integration’s pre-built dashboards and alerts to your Grafana Cloud instance, and you can start monitoring your Windows setup.
Configuration snippets for Grafana Alloy
Simple mode
These snippets are configured to scrape a single Windows server with Grafana Alloy running locally.
First, manually copy and append the following snippets into your alloy configuration file.
Integrations snippets
prometheus.exporter.windows "integrations_windows_exporter" {
  enabled_collectors = ["cpu", "cs", "logical_disk", "net", "os", "service", "system", "textfile", "time", "diskdrive"]
}
discovery.relabel "integrations_windows_exporter" {
  targets = prometheus.exporter.windows.integrations_windows_exporter.targets

  rule {
    target_label = "job"
    replacement  = "integrations/windows_exporter"
  }

  rule {
    target_label = "instance"
    replacement  = constants.hostname
  }
}
prometheus.scrape "integrations_windows_exporter" {
  targets    = discovery.relabel.integrations_windows_exporter.output
  forward_to = [prometheus.relabel.integrations_windows_exporter.receiver]
  job_name   = "integrations/windows_exporter"
}
prometheus.relabel "integrations_windows_exporter" {
  forward_to = [prometheus.remote_write.metrics_service.receiver]

  rule {
    source_labels = ["volume"]
    regex         = "HarddiskVolume.*"
    action        = "drop"
  }
}
Logs snippets
windows
loki.process "logs_integrations_windows_exporter_application" {
  forward_to = [loki.write.grafana_cloud_loki.receiver]

  stage.json {
    expressions = {
      level  = "levelText",
      source = "source",
    }
  }

  stage.labels {
    values = {
      level  = "",
      source = "",
    }
  }
}
loki.relabel "logs_integrations_windows_exporter_application" {
  forward_to = [loki.process.logs_integrations_windows_exporter_application.receiver]

  rule {
    source_labels = ["computer"]
    target_label  = "agent_hostname"
  }
}
loki.source.windowsevent "logs_integrations_windows_exporter_application" {
  locale                 = 1033
  eventlog_name          = "Application"
  bookmark_path          = "./bookmarks-app.xml"
  poll_interval          = "0s"
  use_incoming_timestamp = true
  forward_to             = [loki.relabel.logs_integrations_windows_exporter_application.receiver]
  labels                 = {
    instance = constants.hostname,
    job      = "integrations/windows_exporter",
  }
}
loki.process "logs_integrations_windows_exporter_system" {
  forward_to = [loki.write.grafana_cloud_loki.receiver]

  stage.json {
    expressions = {
      level  = "levelText",
      source = "source",
    }
  }

  stage.labels {
    values = {
      level  = "",
      source = "",
    }
  }
}
loki.relabel "logs_integrations_windows_exporter_system" {
  forward_to = [loki.process.logs_integrations_windows_exporter_system.receiver]

  rule {
    source_labels = ["computer"]
    target_label  = "agent_hostname"
  }
}
loki.source.windowsevent "logs_integrations_windows_exporter_system" {
  locale                 = 1033
  eventlog_name          = "System"
  bookmark_path          = "./bookmarks-sys.xml"
  poll_interval          = "0s"
  use_incoming_timestamp = true
  forward_to             = [loki.relabel.logs_integrations_windows_exporter_system.receiver]
  labels                 = {
    instance = constants.hostname,
    job      = "integrations/windows_exporter",
  }
}
Advanced mode
The following snippets provide examples to guide you through the configuration process.
To instruct Grafana Alloy to scrape your Windows server, manually copy and append the snippets to your alloy configuration file, then follow subsequent instructions.
Advanced integrations snippets
prometheus.exporter.windows "integrations_windows_exporter" {
  enabled_collectors = ["cpu", "cs", "logical_disk", "net", "os", "service", "system", "textfile", "time", "diskdrive"]
}
discovery.relabel "integrations_windows_exporter" {
  targets = prometheus.exporter.windows.integrations_windows_exporter.targets

  rule {
    target_label = "job"
    replacement  = "integrations/windows_exporter"
  }

  rule {
    target_label = "instance"
    replacement  = constants.hostname
  }
}
prometheus.scrape "integrations_windows_exporter" {
  targets    = discovery.relabel.integrations_windows_exporter.output
  forward_to = [prometheus.relabel.integrations_windows_exporter.receiver]
  job_name   = "integrations/windows_exporter"
}
prometheus.relabel "integrations_windows_exporter" {
  forward_to = [prometheus.remote_write.metrics_service.receiver]

  rule {
    source_labels = ["volume"]
    regex         = "HarddiskVolume.*"
    action        = "drop"
  }
}
This integration uses the prometheus.exporter.windows component to collect system metrics.
The supplied configuration is tuned to exclude any metrics from the exporter which are not used by the integration’s dashboards, alerts, or recording rules. If a broader configuration which includes additional metrics is desired, the prometheus.exporter.windows component can be adjusted accordingly.
Advanced logs snippets
windows
loki.process "logs_integrations_windows_exporter_application" {
  forward_to = [loki.write.grafana_cloud_loki.receiver]

  stage.json {
    expressions = {
      level  = "levelText",
      source = "source",
    }
  }

  stage.labels {
    values = {
      level  = "",
      source = "",
    }
  }
}
loki.relabel "logs_integrations_windows_exporter_application" {
  forward_to = [loki.process.logs_integrations_windows_exporter_application.receiver]

  rule {
    source_labels = ["computer"]
    target_label  = "agent_hostname"
  }
}
loki.source.windowsevent "logs_integrations_windows_exporter_application" {
  locale                 = 1033
  eventlog_name          = "Application"
  bookmark_path          = "./bookmarks-app.xml"
  poll_interval          = "0s"
  use_incoming_timestamp = true
  forward_to             = [loki.relabel.logs_integrations_windows_exporter_application.receiver]
  labels                 = {
    instance = constants.hostname,
    job      = "integrations/windows_exporter",
  }
}
loki.process "logs_integrations_windows_exporter_system" {
  forward_to = [loki.write.grafana_cloud_loki.receiver]

  stage.json {
    expressions = {
      level  = "levelText",
      source = "source",
    }
  }

  stage.labels {
    values = {
      level  = "",
      source = "",
    }
  }
}
loki.relabel "logs_integrations_windows_exporter_system" {
  forward_to = [loki.process.logs_integrations_windows_exporter_system.receiver]

  rule {
    source_labels = ["computer"]
    target_label  = "agent_hostname"
  }
}
loki.source.windowsevent "logs_integrations_windows_exporter_system" {
  locale                 = 1033
  eventlog_name          = "System"
  bookmark_path          = "./bookmarks-sys.xml"
  poll_interval          = "0s"
  use_incoming_timestamp = true
  forward_to             = [loki.relabel.logs_integrations_windows_exporter_system.receiver]
  labels                 = {
    instance = constants.hostname,
    job      = "integrations/windows_exporter",
  }
}
This integration uses the loki.source.windowsevent component to collect the application and system events.
If you wish to capture other Windows events, or text log files, refer to the loki.source.windowsevent and loki.source.file components documentation.
Grafana Agent static configuration (deprecated)
The following section shows configuration for running Grafana Agent in static mode which is deprecated. You should use Grafana Alloy for all new deployments.
Before you begin
This integration relies on a Grafana Agent instance running on a Windows machine. See the following sections for details.
Install Windows integration for Grafana Cloud
- In your Grafana Cloud stack, click Connections in the left-hand menu.
- Find Windows and click its tile to open the integration.
- Review the prerequisites in the Configuration Details tab and set up Grafana Agent to send Windows metrics and logs to your Grafana Cloud instance.
- Click Install to add this integration’s pre-built dashboards and alerts to your Grafana Cloud instance, and you can start monitoring your Windows setup.
Post-install configuration for the Windows integration
Enable the integration by adding the provided snippets to your agent configuration file.
For best dashboards experience and in order to see metrics and logs correlated ensure the following:
jobandinstancelabels values must match forwindows_exporter(integrations) andlogsin the Agent configuration file.joblabel must be set tointegrations/windows_exporter(already configured in the snippets).instancelabel must be set to a value that uniquely identifies your Windows node. It is placed automatically by the config snippets.
For a full description of configuration options see how to configure the windows_exporter_config block in the agent documentation.
Configuration snippets for Grafana Agent
Below integrations, insert the following lines and change the URLs according to your environment:
  windows_exporter:
    enabled: true
    instance: '<your-instance-name>' # must match instance used in logs
    # enable default collectors and time collector:
    enabled_collectors: cpu,cs,logical_disk,net,os,service,system,time,diskdrive
    metric_relabel_configs:
    # drop disk volumes named HarddiskVolume.*
    - action: drop
      regex: HarddiskVolume.*
      source_labels: [volume]
    relabel_configs:
    - target_label: job
      replacement: 'integrations/windows_exporter' # must match job used in logs
Below logs.configs.scrape_configs, insert the following lines according to your environment.
    - job_name: integrations/windows-exporter-application
      windows_events:
        use_incoming_timestamp: true
        bookmark_path: "./bookmarks-app.xml"
        eventlog_name: "Application"
        xpath_query: '*'
        locale: 1033
        # - 1033 to force English language
        # -  0 to use default Windows locale
        labels:
          job: integrations/windows_exporter
          instance: '<your-instance-name>' # must match instance used in windows_exporter
      relabel_configs:
        - source_labels: ['computer']
          target_label: 'agent_hostname'
      pipeline_stages:
        - json:
            expressions:
              source: source
              level: levelText
        - labels:
            source:
            level:
    - job_name: integrations/windows-exporter-system
      windows_events:
        use_incoming_timestamp: true
        bookmark_path: "./bookmarks-sys.xml"
        eventlog_name: "System"
        xpath_query: '*'
        locale: 1033
        # - 1033 to force English language
        # -  0 to use default Windows locale
        labels:
          job: integrations/windows_exporter
          instance: '<your-instance-name>' # must match instance used in windows_exporter
      relabel_configs:
        - source_labels: ['computer']
          target_label: 'agent_hostname'
      pipeline_stages:
        - json:
            expressions:
              source: source
              level: levelText
        - labels:
            source:
            level:
The bookmark_path in the configuration provided is set to a file inside the default Grafana Agent installation path in Windows. If you wish to configure a different bookmark path, please update it accordingly.
Full example configuration for Grafana Agent
Refer to the following Grafana Agent configuration for a complete example that contains all the snippets used for the Windows integration. This example also includes metrics that are sent to monitor your Grafana Agent instance.
integrations:
  prometheus_remote_write:
  - basic_auth:
      password: <your_prom_pass>
      username: <your_prom_user>
    url: <your_prom_url>
  agent:
    enabled: true
    relabel_configs:
    - action: replace
      source_labels:
      - agent_hostname
      target_label: instance
    - action: replace
      target_label: job
      replacement: "integrations/agent-check"
    metric_relabel_configs:
    - action: keep
      regex: (prometheus_target_sync_length_seconds_sum|prometheus_target_scrapes_.*|prometheus_target_interval.*|prometheus_sd_discovered_targets|agent_build.*|agent_wal_samples_appended_total|process_start_time_seconds)
      source_labels:
      - __name__
  # Add here any snippet that belongs to the `integrations` section.
  # For a correct indentation, paste snippets copied from Grafana Cloud at the beginning of the line.
  windows_exporter:
    enabled: true
    instance: '<your-instance-name>' # must match instance used in logs
    # enable default collectors and time collector:
    enabled_collectors: cpu,cs,logical_disk,net,os,service,system,time,diskdrive
    metric_relabel_configs:
    # drop disk volumes named HarddiskVolume.*
    - action: drop
      regex: HarddiskVolume.*
      source_labels: [volume]
    relabel_configs:
    - target_label: job
      replacement: 'integrations/windows_exporter' # must match job used in logs
logs:
  configs:
  - clients:
    - basic_auth:
        password: <your_loki_pass>
        username: <your_loki_user>
      url: <your_loki_url>
    name: integrations
    positions:
      filename: /tmp/positions.yaml
    scrape_configs:
      # Add here any snippet that belongs to the `logs.configs.scrape_configs` section.
      # For a correct indentation, paste snippets copied from Grafana Cloud at the beginning of the line.
    - job_name: integrations/windows-exporter-application
      windows_events:
        use_incoming_timestamp: true
        bookmark_path: "./bookmarks-app.xml"
        eventlog_name: "Application"
        xpath_query: '*'
        locale: 1033
        # - 1033 to force English language
        # -  0 to use default Windows locale
        labels:
          job: integrations/windows_exporter
          instance: '<your-instance-name>' # must match instance used in windows_exporter
      relabel_configs:
        - source_labels: ['computer']
          target_label: 'agent_hostname'
      pipeline_stages:
        - json:
            expressions:
              source: source
              level: levelText
        - labels:
            source:
            level:
    - job_name: integrations/windows-exporter-system
      windows_events:
        use_incoming_timestamp: true
        bookmark_path: "./bookmarks-sys.xml"
        eventlog_name: "System"
        xpath_query: '*'
        locale: 1033
        # - 1033 to force English language
        # -  0 to use default Windows locale
        labels:
          job: integrations/windows_exporter
          instance: '<your-instance-name>' # must match instance used in windows_exporter
      relabel_configs:
        - source_labels: ['computer']
          target_label: 'agent_hostname'
      pipeline_stages:
        - json:
            expressions:
              source: source
              level: levelText
        - labels:
            source:
            level:
metrics:
  configs:
  - name: integrations
    remote_write:
    - basic_auth:
        password: <your_prom_pass>
        username: <your_prom_user>
      url: <your_prom_url>
    scrape_configs:
      # Add here any snippet that belongs to the `metrics.configs.scrape_configs` section.
      # For a correct indentation, paste snippets copied from Grafana Cloud at the beginning of the line.
  global:
    scrape_interval: 60s
  wal_directory: /tmp/grafana-agent-wal
Dashboards
The Windows integration installs the following dashboards in your Grafana Cloud instance to help monitor your system.
- Windows CPU and system
- Windows disks and filesystems
- Windows fleet overview
- Windows logs
- Windows overview
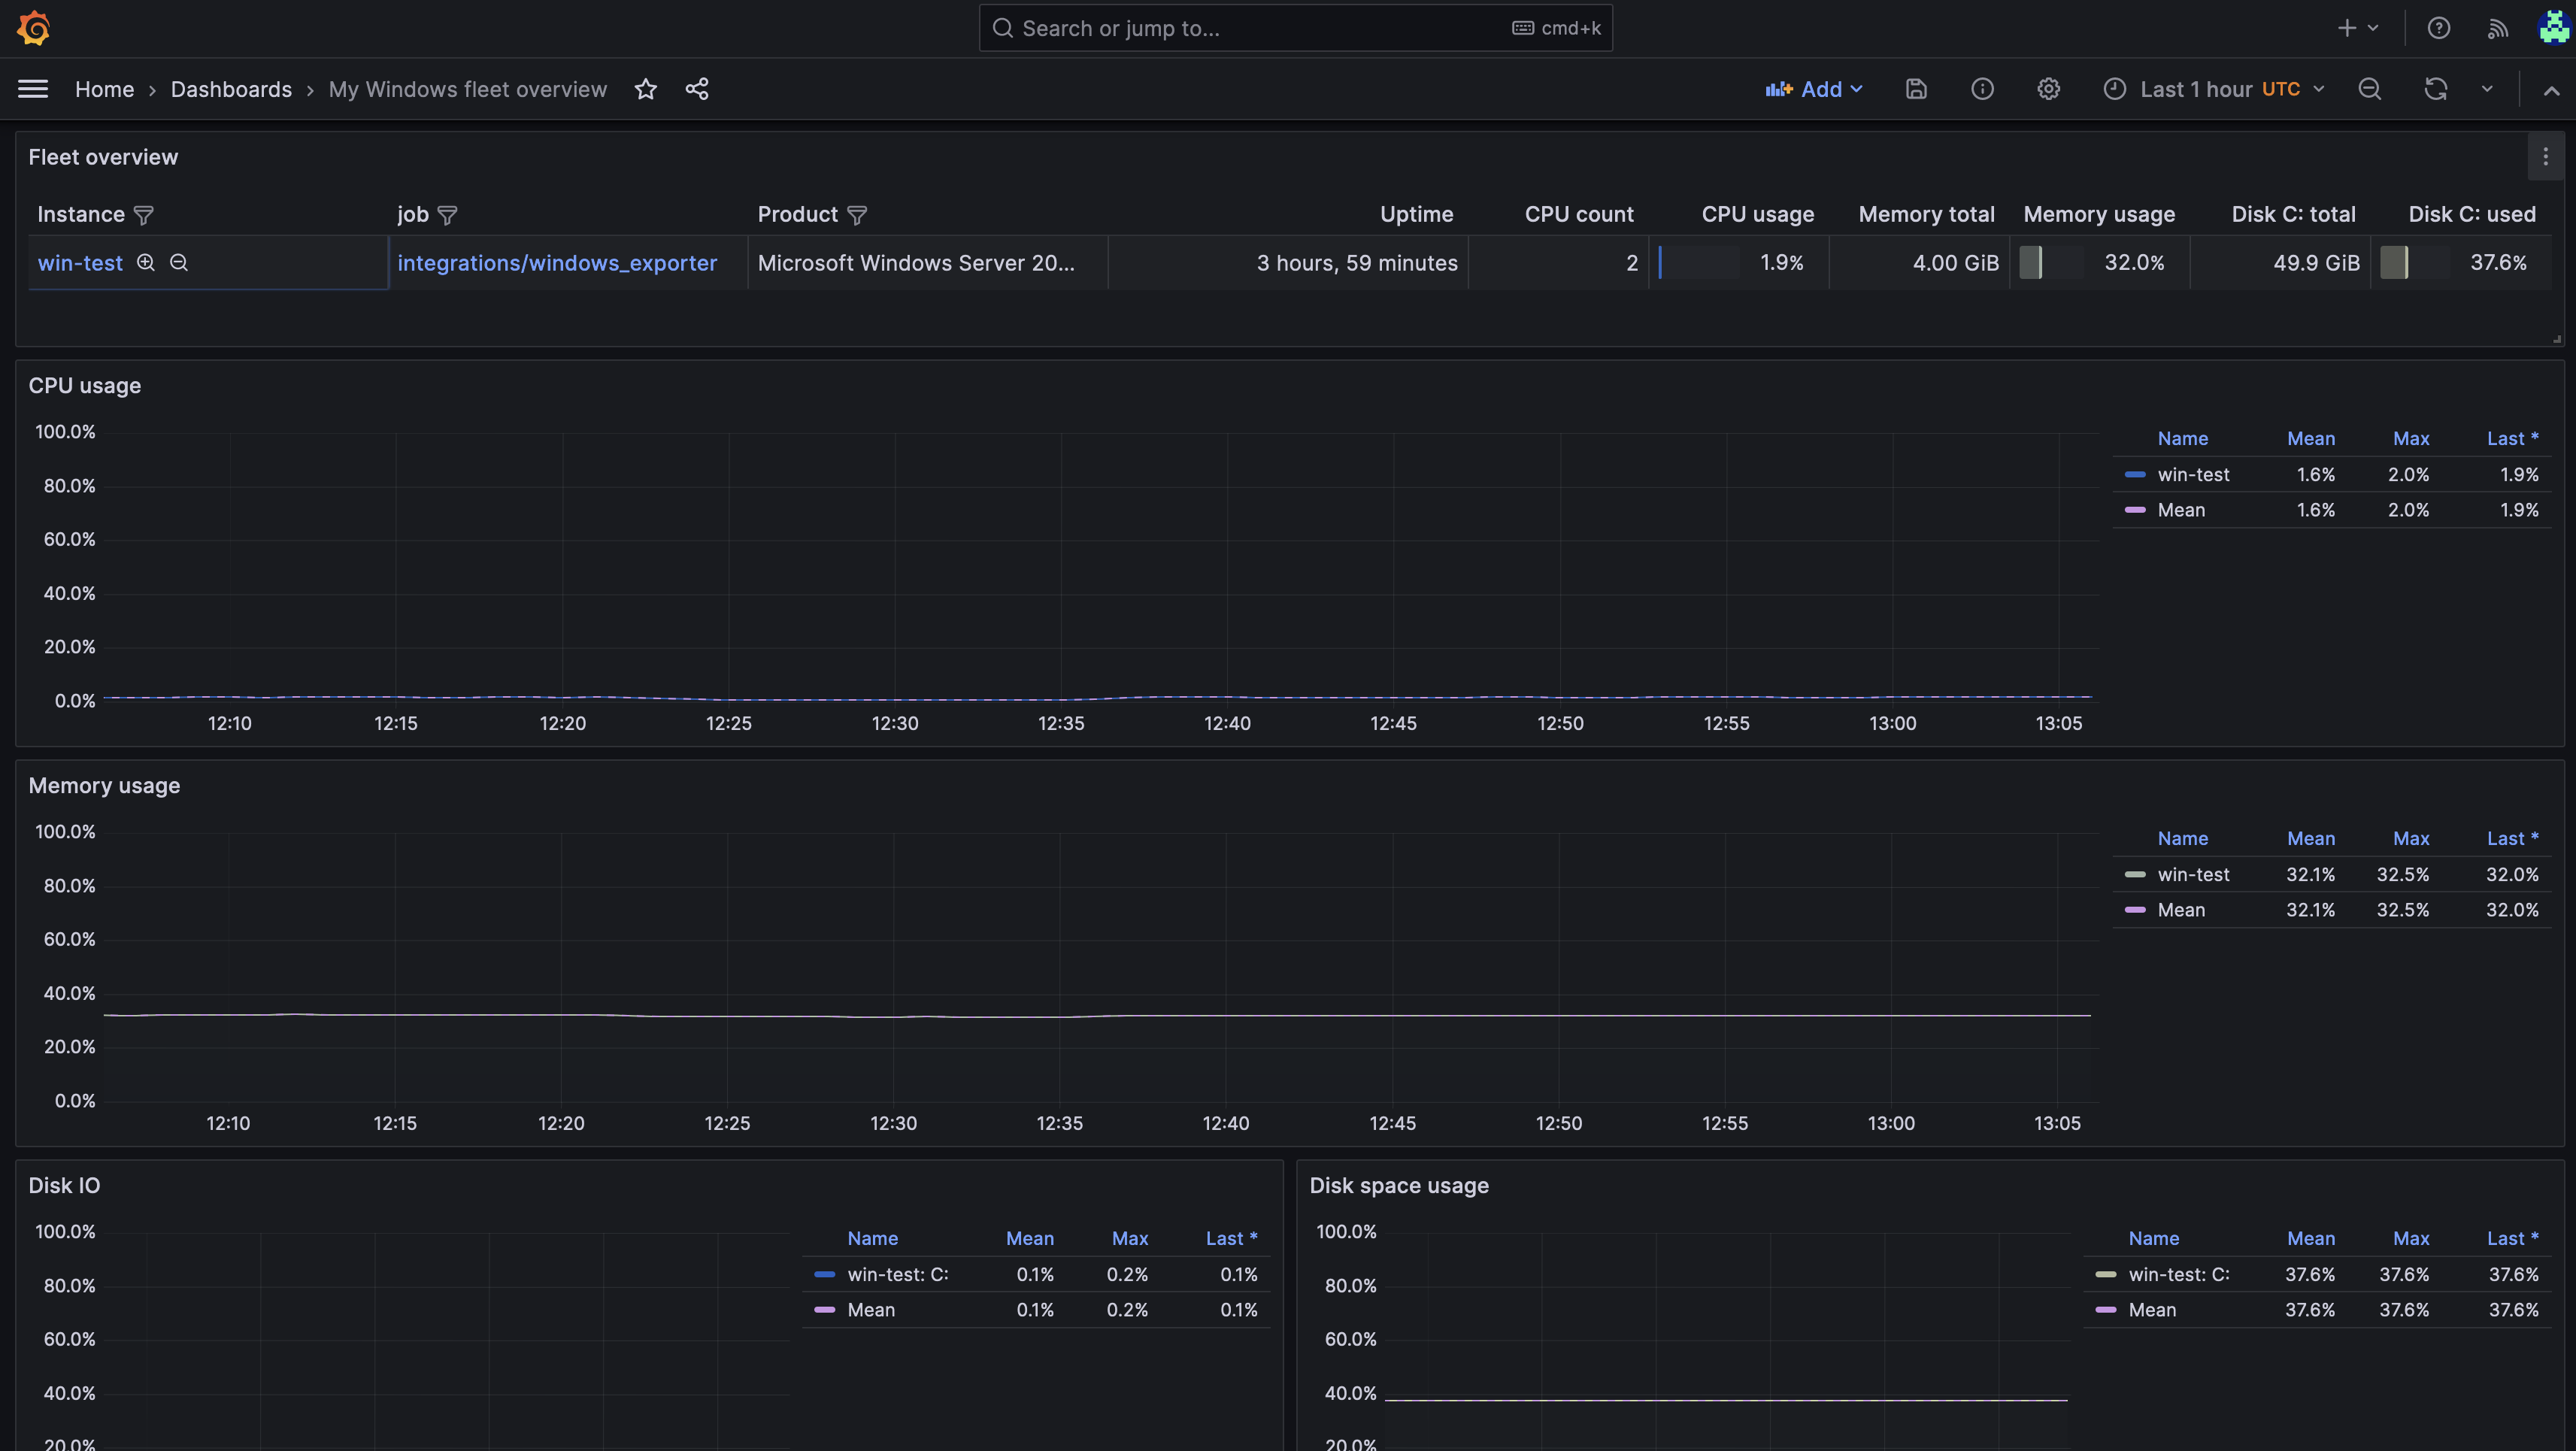
Windows fleet overview
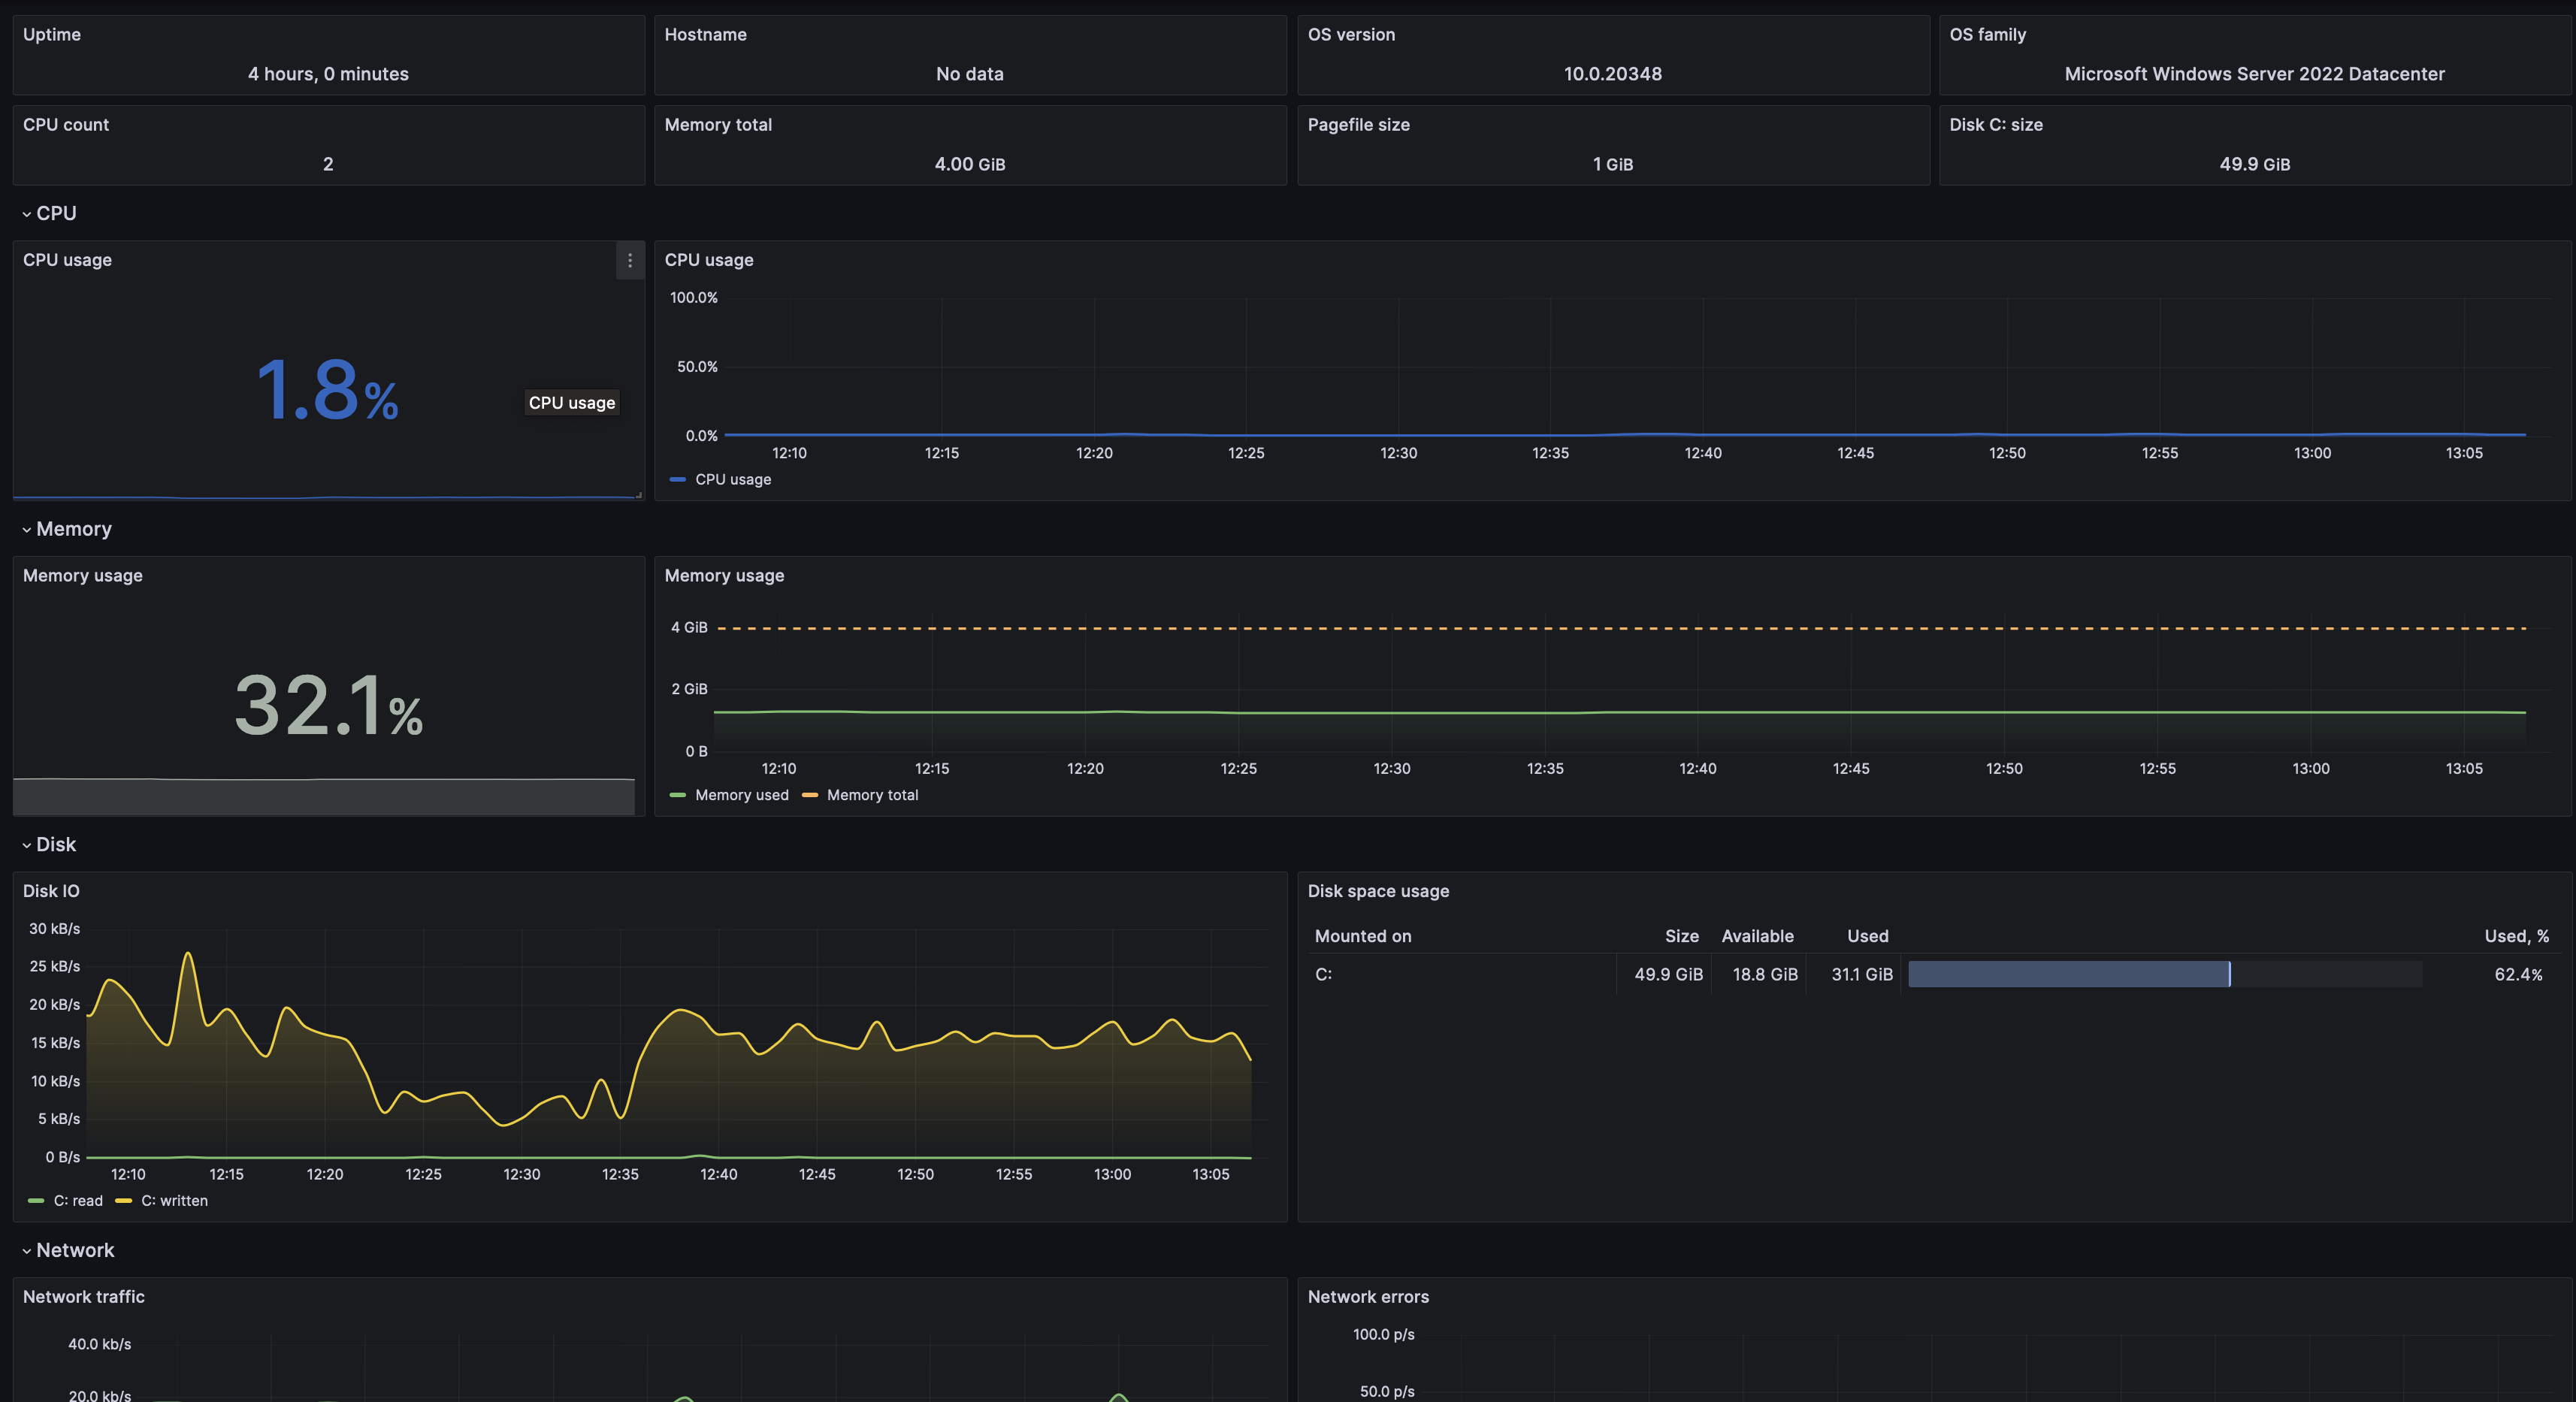
Windows overview
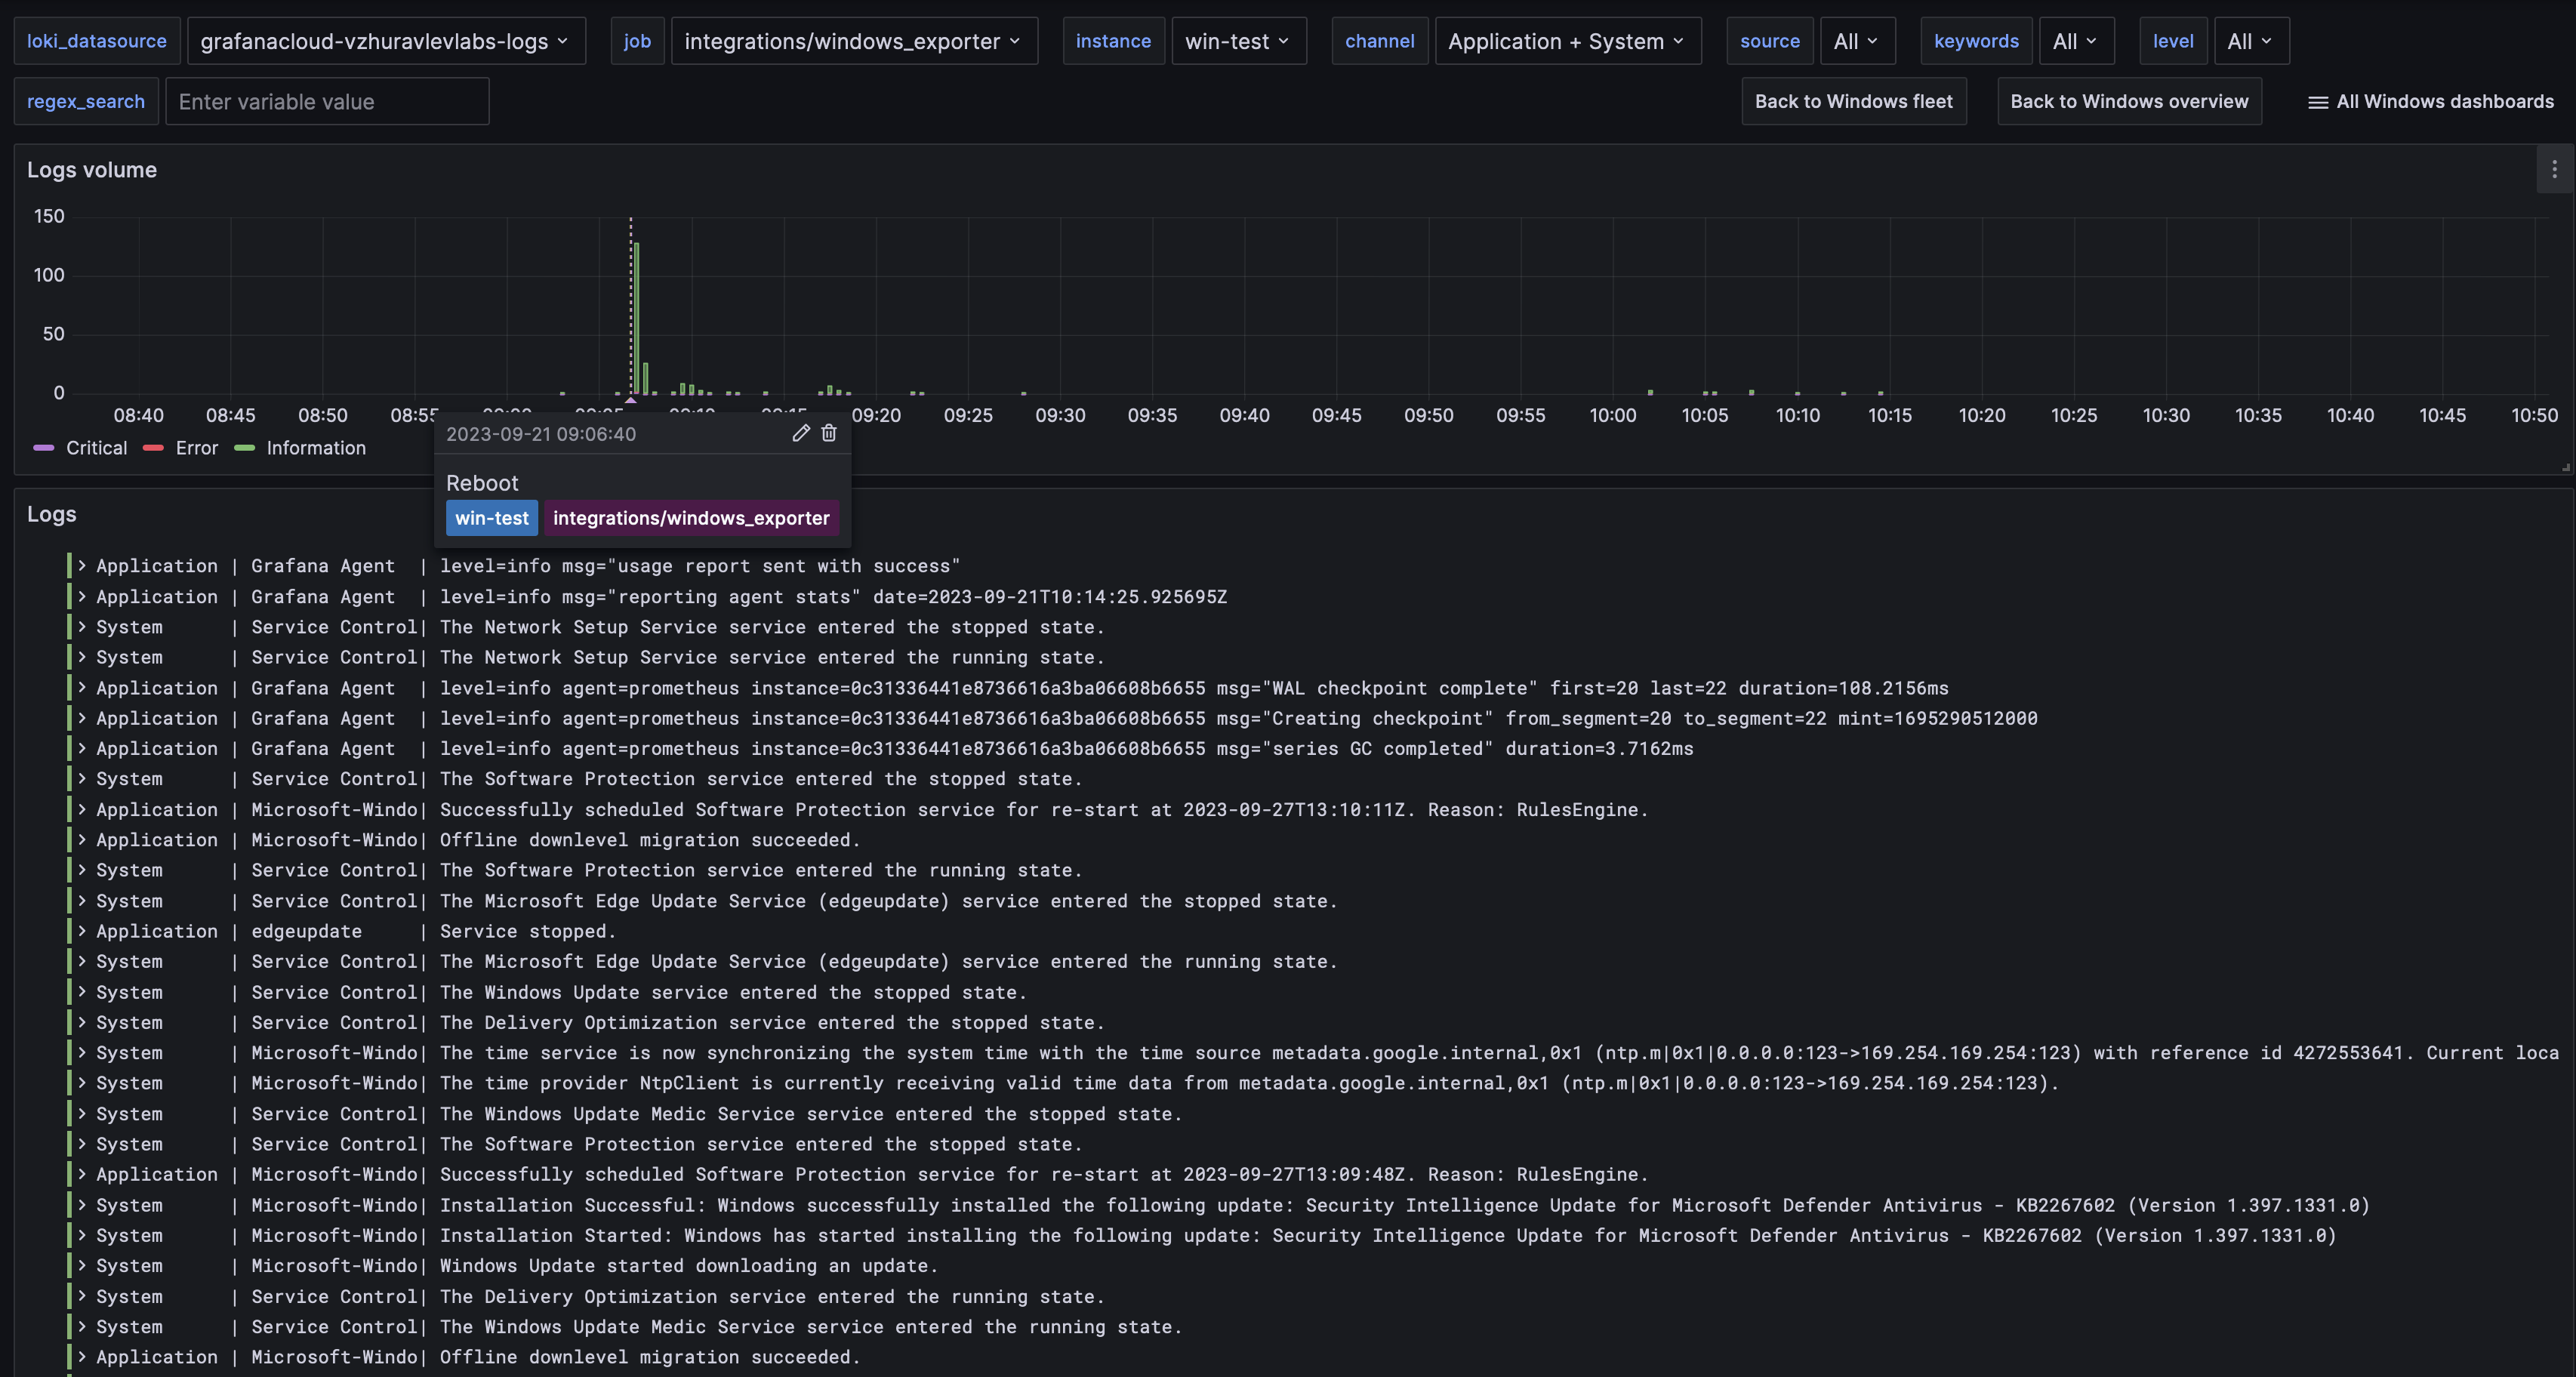
Windows logs
Alerts
The Windows integration includes the following useful alerts:
| Alert | Description |
|---|---|
| WindowsCPUHighUsage | Warning: High CPU usage on Windows host. |
| WindowsMemoryHighUtilization | Critical: High memory usage on Windows host. |
| WindowsDiskAlmostOutOfSpace | Critical: Disk is almost full on Windows host. |
| WindowsServiceNotHealthy | Critical: Windows service is not healthy. |
| WindowsDiskDriveNotHealthy | Critical: Windows physical disk is not healthy. |
| WindowsNTPClientDelay | Warning: NTP client delay. |
| WindowsNTPTimeOffset | Warning: NTP time offset is too large. |
Metrics
The most important metrics provided by the Windows integration, which are used on the pre-built dashboards and Prometheus alerts, are as follows:
- up
- windows_cpu_interrupts_total
- windows_cpu_time_total
- windows_cs_hostname
- windows_cs_logical_processors
- windows_cs_physical_memory_bytes
- windows_disk_drive_status
- windows_logical_disk_avg_read_requests_queued
- windows_logical_disk_avg_write_requests_queued
- windows_logical_disk_free_bytes
- windows_logical_disk_idle_seconds_total
- windows_logical_disk_read_bytes_total
- windows_logical_disk_read_seconds_total
- windows_logical_disk_reads_total
- windows_logical_disk_size_bytes
- windows_logical_disk_write_bytes_total
- windows_logical_disk_write_seconds_total
- windows_logical_disk_writes_total
- windows_net_bytes_received_total
- windows_net_bytes_sent_total
- windows_net_packets_outbound_discarded_total
- windows_net_packets_outbound_errors_total
- windows_net_packets_received_discarded_total
- windows_net_packets_received_errors_total
- windows_net_packets_received_unknown_total
- windows_os_info
- windows_os_paging_limit_bytes
- windows_os_physical_memory_free_bytes
- windows_os_timezone
- windows_service_status
- windows_system_context_switches_total
- windows_system_processor_queue_length
- windows_system_system_up_time
- windows_time_computed_time_offset_seconds
- windows_time_ntp_round_trip_delay_seconds
Changelog
# 1.0.0 - October 2023

* Grafana dashboards three-tier view:
  - Fleet dashboard with with drill down and data links to other dashes
  - Host overview dashboard
  - Advanced metrics dashboards (Logs dashboard, CPU and system dashboard, Disks)
* Add new alerts
  - NTP sync alerts
  - Add disk status alert
* Add annotations across all dashboards for the following events:
  - Reboot
  - Failed windows service
  - Critical eventlog annotation
* Update agent snippets:
  - Add time collector
  - Extract additional 'level' label from event logs
  - Drop disk metrics for 'HarddiskVolume.*' volumes by default
* Other:
  - Variable selector 'hostname' no longer used on dashboards, 'instance' label is used instead.

# 0.0.9 - August 2023

* Add regex filter for logs datasource

# 0.0.8 - August 2023

* Updates agent configuration:
    * Separate bookmark path for system and application event logs
* Update instructions to avoid repeat

# 0.0.7 - August 2023

* New Filter Metrics option for configuring the Grafana Agent, which saves on metrics cost by dropping any metric not used by this integration. Beware that anything custom built using metrics that are not on the snippet will stop working.
* New hostname relabel option, which applies the instance name you write on the text box to the Grafana Agent configuration snippets, making it easier and less error prone to configure this mandatory label.

# 0.0.6 - January 2023

* Add basic alerts

# 0.0.5 - September 2022

* Fix confusing thresholds for C:\ Free space

# 0.0.4 - May 2022

* Add logs support
* Update mixin to latest with logs dashboard
* Update instructions for enabling logs integration

# 0.0.3 - May 2022

* Move mixin to jsonnet-libs
* Update metadata with screenshots
* Update mixin version to latest

# 0.0.2 - October 2021

* Update mixin to latest version:
  - Update queries to use $__rate_interval

# 0.0.1 - May 2021

* Initial release
Cost
By connecting your Windows instance to Grafana Cloud, you might incur charges. To view information on the number of active series that your Grafana Cloud account uses for metrics included in each Cloud tier, see Active series and dpm usage and Cloud tier pricing.
Was this page helpful?
Related resources from Grafana Labs


