
Windows Active Directory integration for Grafana Cloud
Microsoft Windows Active Directory (AD) is a directory service developed by Microsoft for Windows domain networks. It provides a variety of network services, including centralized domain management, user and resource management, and authentication and authorization. AD stores information about network objects (like users, groups, computers, and more) and makes this information easily accessible and secure for administrators and users, depending on their permissions.
This integration supports Microsoft Windows 2012+.
This integration includes 4 useful alerts and 2 pre-built dashboards to help monitor and visualize Windows Active Directory metrics and logs.
Before you begin
This integration relies on a Grafana Alloy instance running on a Windows machine.
Performance counters need to be turned on. This can be done by navigating to Server Manager then on the left sidebar, choose AD DS. Right clicking on the server will reveal an option to enable performance counters.
Install Windows Active Directory integration for Grafana Cloud
- In your Grafana Cloud stack, click Connections in the left-hand menu.
- Find Windows Active Directory and click its tile to open the integration.
- Review the prerequisites in the Configuration Details tab and set up Grafana Agent to send Windows Active Directory metrics and logs to your Grafana Cloud instance.
- Click Install to add this integration’s pre-built dashboards and alerts to your Grafana Cloud instance, and you can start monitoring your Windows Active Directory setup.
Configuration snippets for Grafana Alloy
Simple mode
These snippets are configured to scrape a single Windows Active Directory instance running locally with default ports.
First, manually copy and append the following snippets into your alloy configuration file.
Integrations snippets
prometheus.exporter.windows "integrations_windows_exporter" {
	enabled_collectors = ["ad", "cpu", "cs", "logical_disk", "net", "os", "service", "system", "textfile", "time", "diskdrive"]

	dfsr {
		sources_enabled = [""]
	}

	exchange {
		enabled_list = [""]
	}

	mssql {
		enabled_classes = [""]
	}
}

discovery.relabel "integrations_windows_exporter" {
	targets = prometheus.exporter.windows.integrations_windows_exporter.targets

	rule {
		target_label = "job"
		replacement  = "integrations/windows_exporter"
	}

	rule {
		target_label = "instance"
		replacement  = constants.hostname
	}
}

prometheus.scrape "integrations_windows_exporter" {
	targets    = discovery.relabel.integrations_windows_exporter.output
	forward_to = [prometheus.relabel.integrations_windows_exporter.receiver]
	job_name   = "integrations/windows_exporter"
}

prometheus.relabel "integrations_windows_exporter" {
	forward_to = [prometheus.remote_write.metrics_service.receiver]

	rule {
		source_labels = ["volume"]
		regex         = "HarddiskVolume.*"
		action        = "drop"
	}
}
Logs snippets
windows
loki.process "logs_integrations_integrations_windows_exporter_application" {
	forward_to = [loki.write.grafana_cloud_loki.receiver]

	stage.json {
		expressions = {
			level  = "levelText",
			source = "source",
		}
	}

	stage.labels {
		values = {
			level  = null,
			source = null,
		}
	}
}

loki.relabel "logs_integrations_integrations_windows_exporter_application" {
	forward_to = [loki.process.logs_integrations_integrations_windows_exporter_application.receiver]

	rule {
		source_labels = ["computer"]
		target_label  = "agent_hostname"
	}
}

loki.source.windowsevent "logs_integrations_integrations_windows_exporter_application" {
	locale                 = 1033
	eventlog_name          = "Application"
	bookmark_path          = "./bookmarks-app.xml"
	poll_interval          = "0s"
	use_incoming_timestamp = true
	forward_to             = [loki.relabel.logs_integrations_integrations_windows_exporter_application.receiver]
	labels                 = {
		instance = constants.hostname,
		job      = "integrations/windows_exporter",
	}
}

loki.process "logs_integrations_integrations_windows_exporter_system" {
	forward_to = [loki.write.grafana_cloud_loki.receiver]

	stage.json {
		expressions = {
			level  = "levelText",
			source = "source",
		}
	}

	stage.labels {
		values = {
			level  = null,
			source = null,
		}
	}
}

loki.relabel "logs_integrations_integrations_windows_exporter_system" {
	forward_to = [loki.process.logs_integrations_integrations_windows_exporter_system.receiver]

	rule {
		source_labels = ["computer"]
		target_label  = "agent_hostname"
	}
}

loki.source.windowsevent "logs_integrations_integrations_windows_exporter_system" {
	locale                 = 1033
	eventlog_name          = "System"
	bookmark_path          = "./bookmarks-sys.xml"
	poll_interval          = "0s"
	use_incoming_timestamp = true
	forward_to             = [loki.relabel.logs_integrations_integrations_windows_exporter_system.receiver]
	labels                 = {
		instance = constants.hostname,
		job      = "integrations/windows_exporter",
	}
}
Advanced mode
The following snippets provide examples to guide you through the configuration process.
To instruct Grafana Alloy to scrape your Windows Active Directory instances, manually copy and append the snippets to your alloy configuration file, then follow subsequent instructions.
Advanced integrations snippets
prometheus.exporter.windows "integrations_windows_exporter" {
	enabled_collectors = ["ad", "cpu", "cs", "logical_disk", "net", "os", "service", "system", "textfile", "time", "diskdrive"]

	dfsr {
		sources_enabled = [""]
	}

	exchange {
		enabled_list = [""]
	}

	mssql {
		enabled_classes = [""]
	}
}

discovery.relabel "integrations_windows_exporter" {
	targets = prometheus.exporter.windows.integrations_windows_exporter.targets

	rule {
		target_label = "job"
		replacement  = "integrations/windows_exporter"
	}

	rule {
		target_label = "instance"
		replacement  = constants.hostname
	}
}

prometheus.scrape "integrations_windows_exporter" {
	targets    = discovery.relabel.integrations_windows_exporter.output
	forward_to = [prometheus.relabel.integrations_windows_exporter.receiver]
	job_name   = "integrations/windows_exporter"
}

prometheus.relabel "integrations_windows_exporter" {
	forward_to = [prometheus.remote_write.metrics_service.receiver]

	rule {
		source_labels = ["volume"]
		regex         = "HarddiskVolume.*"
		action        = "drop"
	}
}
This integrations uses the prometheus.exporter.windows component to generate metrics from a Windows Active Directory instance.
For the full array of configuration options, refer to the prometheus.exporter.windows component reference documentation.
This exporter must be linked with a discovery.relabel component to apply the necessary relabelings.
For each Windows Active Directory instance to be monitored you must create a pair of these components.
Configure the following properties within each discovery.relabel component:
instancelabel:constants.hostnamesets theinstancelabel to your Grafana Alloy server hostname. If that is not suitable, change it to a value uniquely identifies this Windows Active Directory instance. Make sure this label value is the same for all telemetry data collected for this instance.
You can then scrape them by including each discovery.relabel under targets within the prometheus.scrape component.
Advanced logs snippets
windows
loki.process "logs_integrations_integrations_windows_exporter_application" {
	forward_to = [loki.write.grafana_cloud_loki.receiver]

	stage.json {
		expressions = {
			level  = "levelText",
			source = "source",
		}
	}

	stage.labels {
		values = {
			level  = null,
			source = null,
		}
	}
}

loki.relabel "logs_integrations_integrations_windows_exporter_application" {
	forward_to = [loki.process.logs_integrations_integrations_windows_exporter_application.receiver]

	rule {
		source_labels = ["computer"]
		target_label  = "agent_hostname"
	}
}

loki.source.windowsevent "logs_integrations_integrations_windows_exporter_application" {
	locale                 = 1033
	eventlog_name          = "Application"
	bookmark_path          = "./bookmarks-app.xml"
	poll_interval          = "0s"
	use_incoming_timestamp = true
	forward_to             = [loki.relabel.logs_integrations_integrations_windows_exporter_application.receiver]
	labels                 = {
		instance = constants.hostname,
		job      = "integrations/windows_exporter",
	}
}

loki.process "logs_integrations_integrations_windows_exporter_system" {
	forward_to = [loki.write.grafana_cloud_loki.receiver]

	stage.json {
		expressions = {
			level  = "levelText",
			source = "source",
		}
	}

	stage.labels {
		values = {
			level  = null,
			source = null,
		}
	}
}

loki.relabel "logs_integrations_integrations_windows_exporter_system" {
	forward_to = [loki.process.logs_integrations_integrations_windows_exporter_system.receiver]

	rule {
		source_labels = ["computer"]
		target_label  = "agent_hostname"
	}
}

loki.source.windowsevent "logs_integrations_integrations_windows_exporter_system" {
	locale                 = 1033
	eventlog_name          = "System"
	bookmark_path          = "./bookmarks-sys.xml"
	poll_interval          = "0s"
	use_incoming_timestamp = true
	forward_to             = [loki.relabel.logs_integrations_integrations_windows_exporter_system.receiver]
	labels                 = {
		instance = constants.hostname,
		job      = "integrations/windows_exporter",
	}
}
To monitor your Windows Active Directory instance logs, you will use a combination of the following components:
- loki.source.windowsevent defines where to find the Windows Event Logs to be scraped.
- loki.process defines how to process logs before sending it to Loki.
- loki.relabel defines any relabeling needed before sending logs to Loki.
Grafana Agent static configuration (deprecated)
The following section shows configuration for running Grafana Agent in static mode which is deprecated. You should use Grafana Alloy for all new deployments.
Before you begin
This integration relies on a Grafana Agent instance running on a Windows machine.
Performance counters need to be turned on. This can be done by navigating to Server Manager then on the left sidebar, choose AD DS. Right clicking on the server will reveal an option to enable performance counters.
Install Windows Active Directory integration for Grafana Cloud
- In your Grafana Cloud stack, click Connections in the left-hand menu.
- Find Windows Active Directory and click its tile to open the integration.
- Review the prerequisites in the Configuration Details tab and set up Grafana Agent to send Windows Active Directory metrics and logs to your Grafana Cloud instance.
- Click Install to add this integration’s pre-built dashboards and alerts to your Grafana Cloud instance, and you can start monitoring your Windows Active Directory setup.
Post-install configuration for the Windows Active Directory integration
Enable the integration by adding the provided snippets to your agent configuration file.
For best dashboards experience and in order to see metrics and logs correlated ensure the following:
jobandinstancelabels values must match forwindows_exporter(integrations) andlogsin the Agent configuration file.joblabel must be set tointegrations/windows_exporter(already configured in the snippets).instancelabel must be set to a value that uniquely identifies your Windows node. It is placed automatically by the config snippets.
For a full description of configuration options see how to configure the windows_exporter_config block in the agent documentation.
Configuration snippets for Grafana Agent
Below integrations, insert the following lines and change the URLs according to your environment:
  windows_exporter:
    enabled: true
    instance: '<your-instance-name>' # must match instance used in logs
    # enable default collectors and time collector:
    enabled_collectors: ad,cpu,cs,logical_disk,net,os,service,system,textfile,time,diskdrive
    metric_relabel_configs:
    # drop disk volumes named HarddiskVolume.*
    - action: drop
      regex: HarddiskVolume.*
      source_labels: [volume]
    relabel_configs:
    - target_label: job
      replacement: 'integrations/windows_exporter' # must match job used in logs
Below logs.configs.scrape_configs, insert the following lines according to your environment.
Windows specific:
For Windows add the following snippet below logs.configs.scrape_configs instead:
    - job_name: integrations/windows-exporter-application
      windows_events:
        use_incoming_timestamp: true
        bookmark_path: "./bookmarks-app.xml"
        eventlog_name: "Application"
        xpath_query: '*'
        locale: 1033
        # - 1033 to force English language
        # -  0 to use default Windows locale
        labels:
          job: integrations/windows_exporter
          instance: '<your-instance-name>' # must match instance used in windows_exporter
      relabel_configs:
        - source_labels: ['computer']
          target_label: 'agent_hostname'
      pipeline_stages:
        - json:
            expressions:
              source: source
              level: levelText
        - labels:
            source:
            level:
    - job_name: integrations/windows-exporter-system
      windows_events:
        use_incoming_timestamp: true
        bookmark_path: "./bookmarks-sys.xml"
        eventlog_name: "System"
        xpath_query: '*'
        locale: 1033
        # - 1033 to force English language
        # -  0 to use default Windows locale
        labels:
          job: integrations/windows_exporter
          instance: '<your-instance-name>' # must match instance used in windows_exporter
      relabel_configs:
        - source_labels: ['computer']
          target_label: 'agent_hostname'
      pipeline_stages:
        - json:
            expressions:
              source: source
              level: levelText
        - labels:
            source:
            level:
The bookmark_path in the configuration provided is set to a file inside the default Grafana Agent installation path in Windows. If you wish to configure a different bookmark path, please update it accordingly.
Full example configuration for Grafana Agent
Refer to the following Grafana Agent configuration for a complete example that contains all the snippets used for the Windows Active Directory integration. This example also includes metrics that are sent to monitor your Grafana Agent instance.
integrations:
  prometheus_remote_write:
  - basic_auth:
      password: <your_prom_pass>
      username: <your_prom_user>
    url: <your_prom_url>
  agent:
    enabled: true
    relabel_configs:
    - action: replace
      source_labels:
      - agent_hostname
      target_label: instance
    - action: replace
      target_label: job
      replacement: "integrations/agent-check"
    metric_relabel_configs:
    - action: keep
      regex: (prometheus_target_sync_length_seconds_sum|prometheus_target_scrapes_.*|prometheus_target_interval.*|prometheus_sd_discovered_targets|agent_build.*|agent_wal_samples_appended_total|process_start_time_seconds)
      source_labels:
      - __name__
  # Add here any snippet that belongs to the `integrations` section.
  # For a correct indentation, paste snippets copied from Grafana Cloud at the beginning of the line.
  windows_exporter:
    enabled: true
    instance: '<your-instance-name>' # must match instance used in logs
    # enable default collectors and time collector:
    enabled_collectors: ad,cpu,cs,logical_disk,net,os,service,system,textfile,time,diskdrive
    metric_relabel_configs:
    # drop disk volumes named HarddiskVolume.*
    - action: drop
      regex: HarddiskVolume.*
      source_labels: [volume]
    relabel_configs:
    - target_label: job
      replacement: 'integrations/windows_exporter' # must match job used in logs
logs:
  configs:
  - clients:
    - basic_auth:
        password: <your_loki_pass>
        username: <your_loki_user>
      url: <your_loki_url>
    name: integrations
    positions:
      filename: /tmp/positions.yaml
    scrape_configs:
      # Add here any snippet that belongs to the `logs.configs.scrape_configs` section.
      # For a correct indentation, paste snippets copied from Grafana Cloud at the beginning of the line.
    - job_name: integrations/windows-exporter-application
      windows_events:
        use_incoming_timestamp: true
        bookmark_path: "./bookmarks-app.xml"
        eventlog_name: "Application"
        xpath_query: '*'
        locale: 1033
        # - 1033 to force English language
        # -  0 to use default Windows locale
        labels:
          job: integrations/windows_exporter
          instance: '<your-instance-name>' # must match instance used in windows_exporter
      relabel_configs:
        - source_labels: ['computer']
          target_label: 'agent_hostname'
      pipeline_stages:
        - json:
            expressions:
              source: source
              level: levelText
        - labels:
            source:
            level:
    - job_name: integrations/windows-exporter-system
      windows_events:
        use_incoming_timestamp: true
        bookmark_path: "./bookmarks-sys.xml"
        eventlog_name: "System"
        xpath_query: '*'
        locale: 1033
        # - 1033 to force English language
        # -  0 to use default Windows locale
        labels:
          job: integrations/windows_exporter
          instance: '<your-instance-name>' # must match instance used in windows_exporter
      relabel_configs:
        - source_labels: ['computer']
          target_label: 'agent_hostname'
      pipeline_stages:
        - json:
            expressions:
              source: source
              level: levelText
        - labels:
            source:
            level:
metrics:
  configs:
  - name: integrations
    remote_write:
    - basic_auth:
        password: <your_prom_pass>
        username: <your_prom_user>
      url: <your_prom_url>
    scrape_configs:
      # Add here any snippet that belongs to the `metrics.configs.scrape_configs` section.
      # For a correct indentation, paste snippets copied from Grafana Cloud at the beginning of the line.
  global:
    scrape_interval: 60s
  wal_directory: /tmp/grafana-agent-wal
Dashboards
The Windows Active Directory integration installs the following dashboards in your Grafana Cloud instance to help monitor your system.
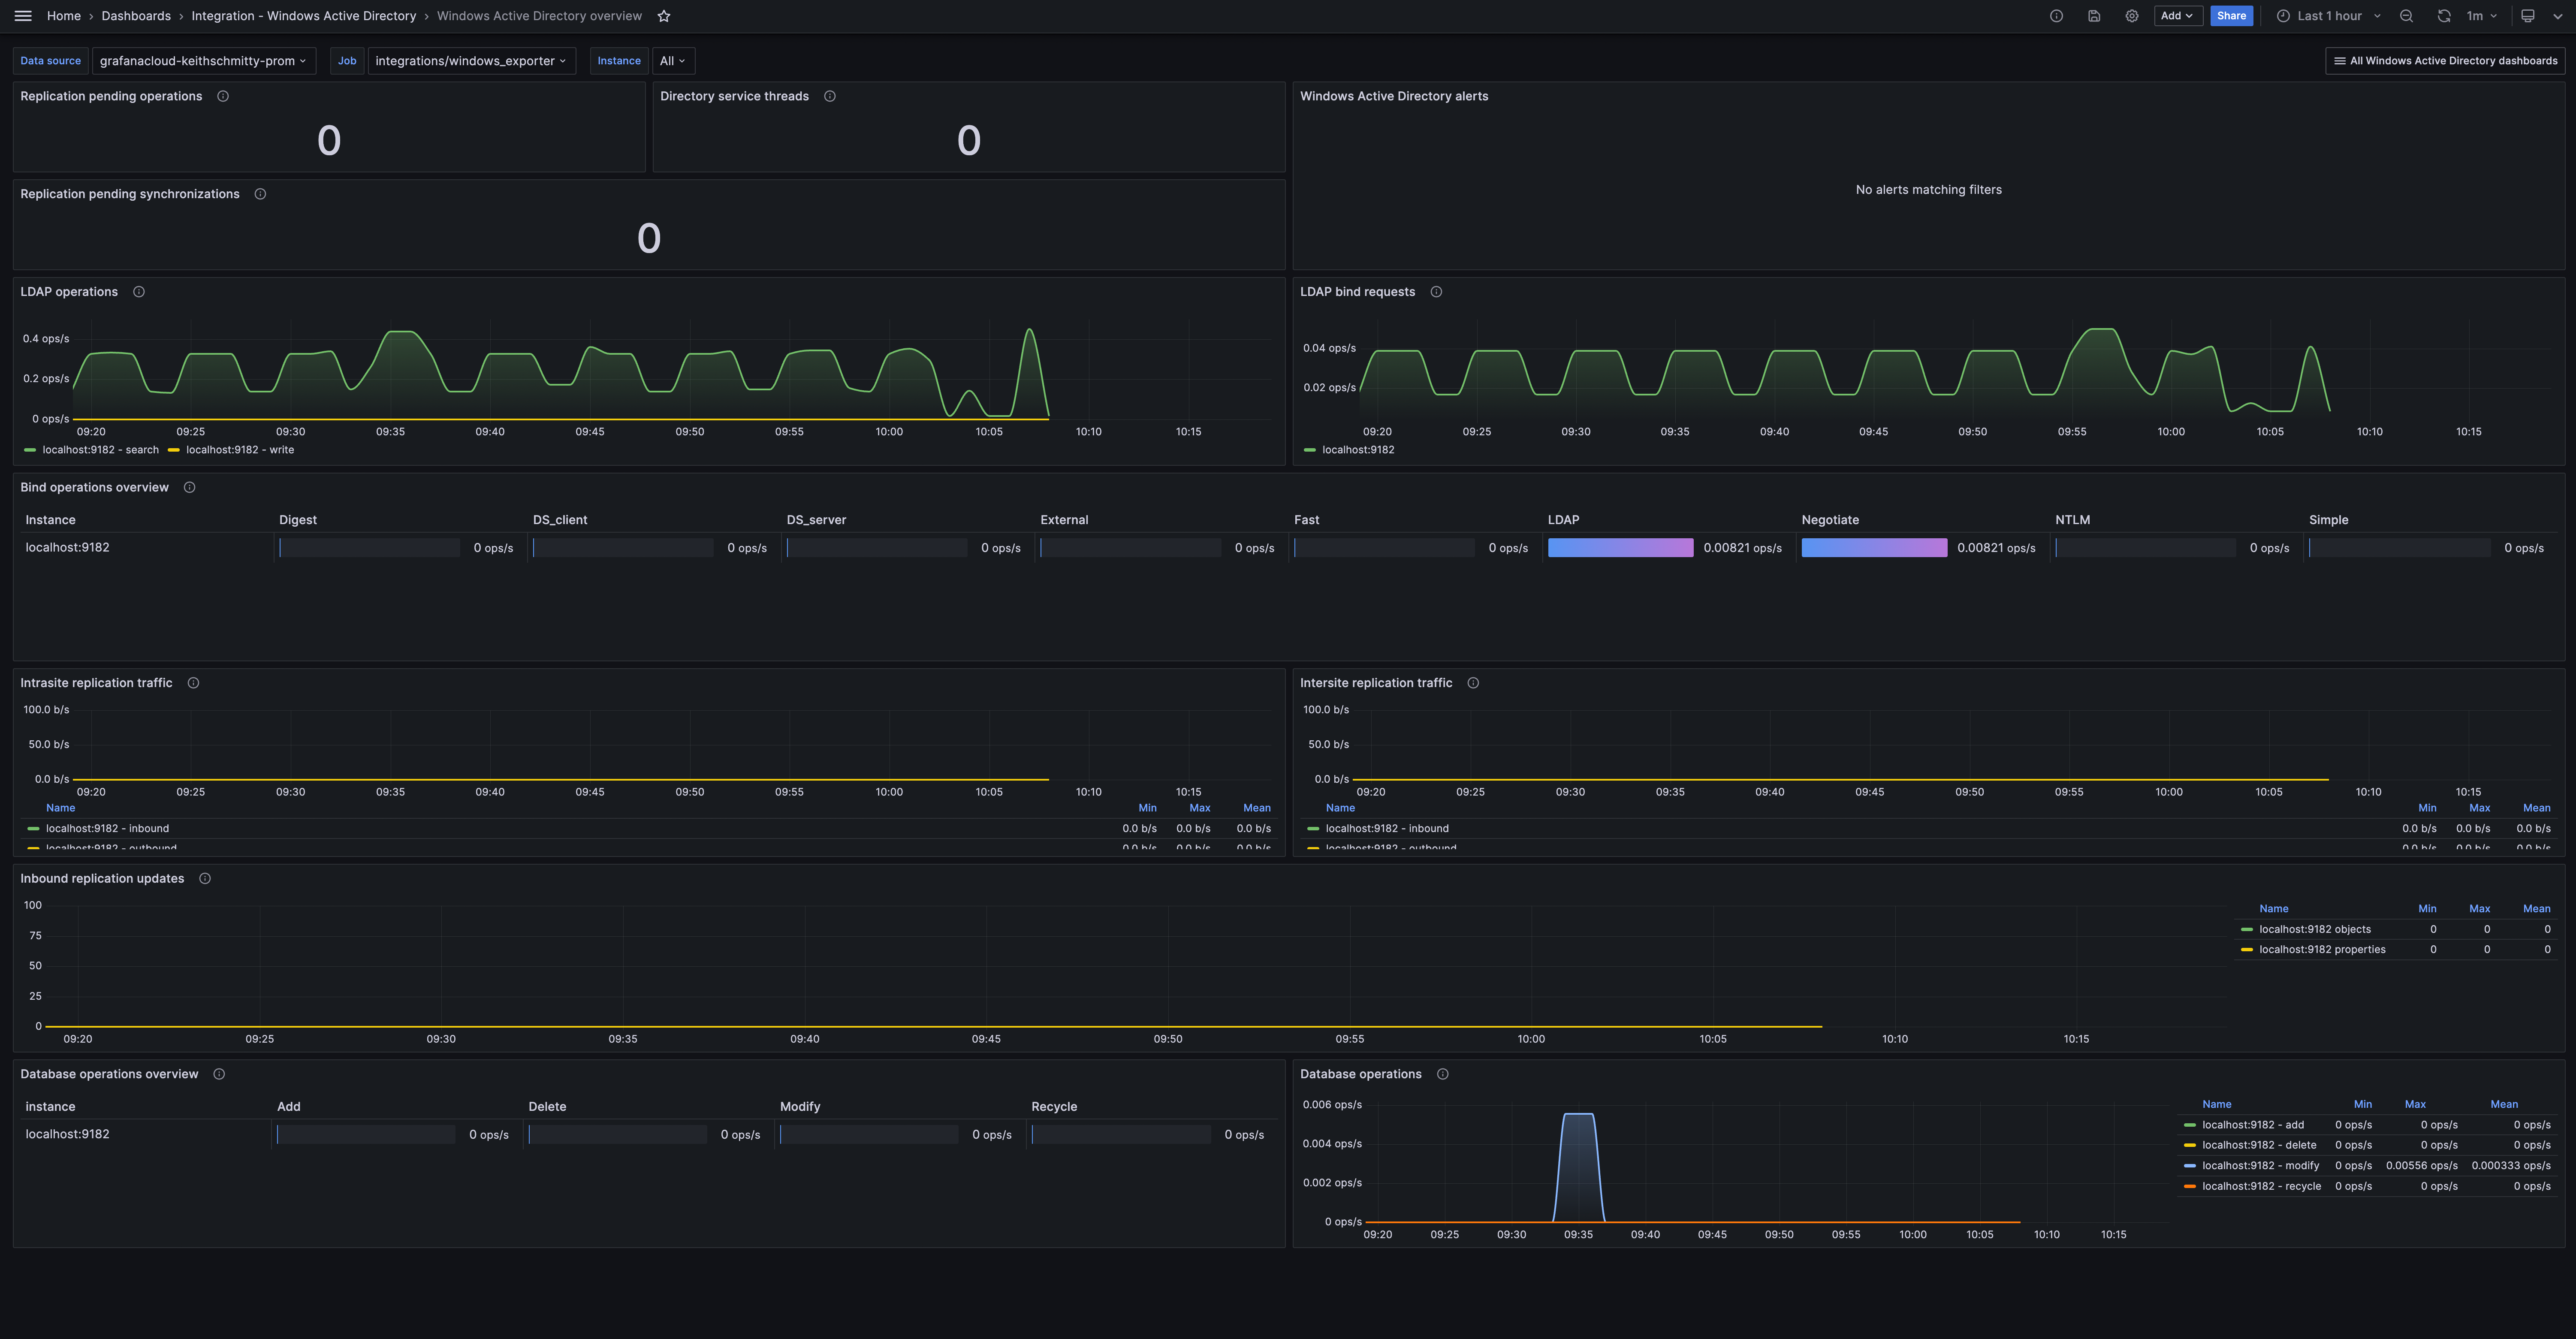
- Windows Active Directory overview
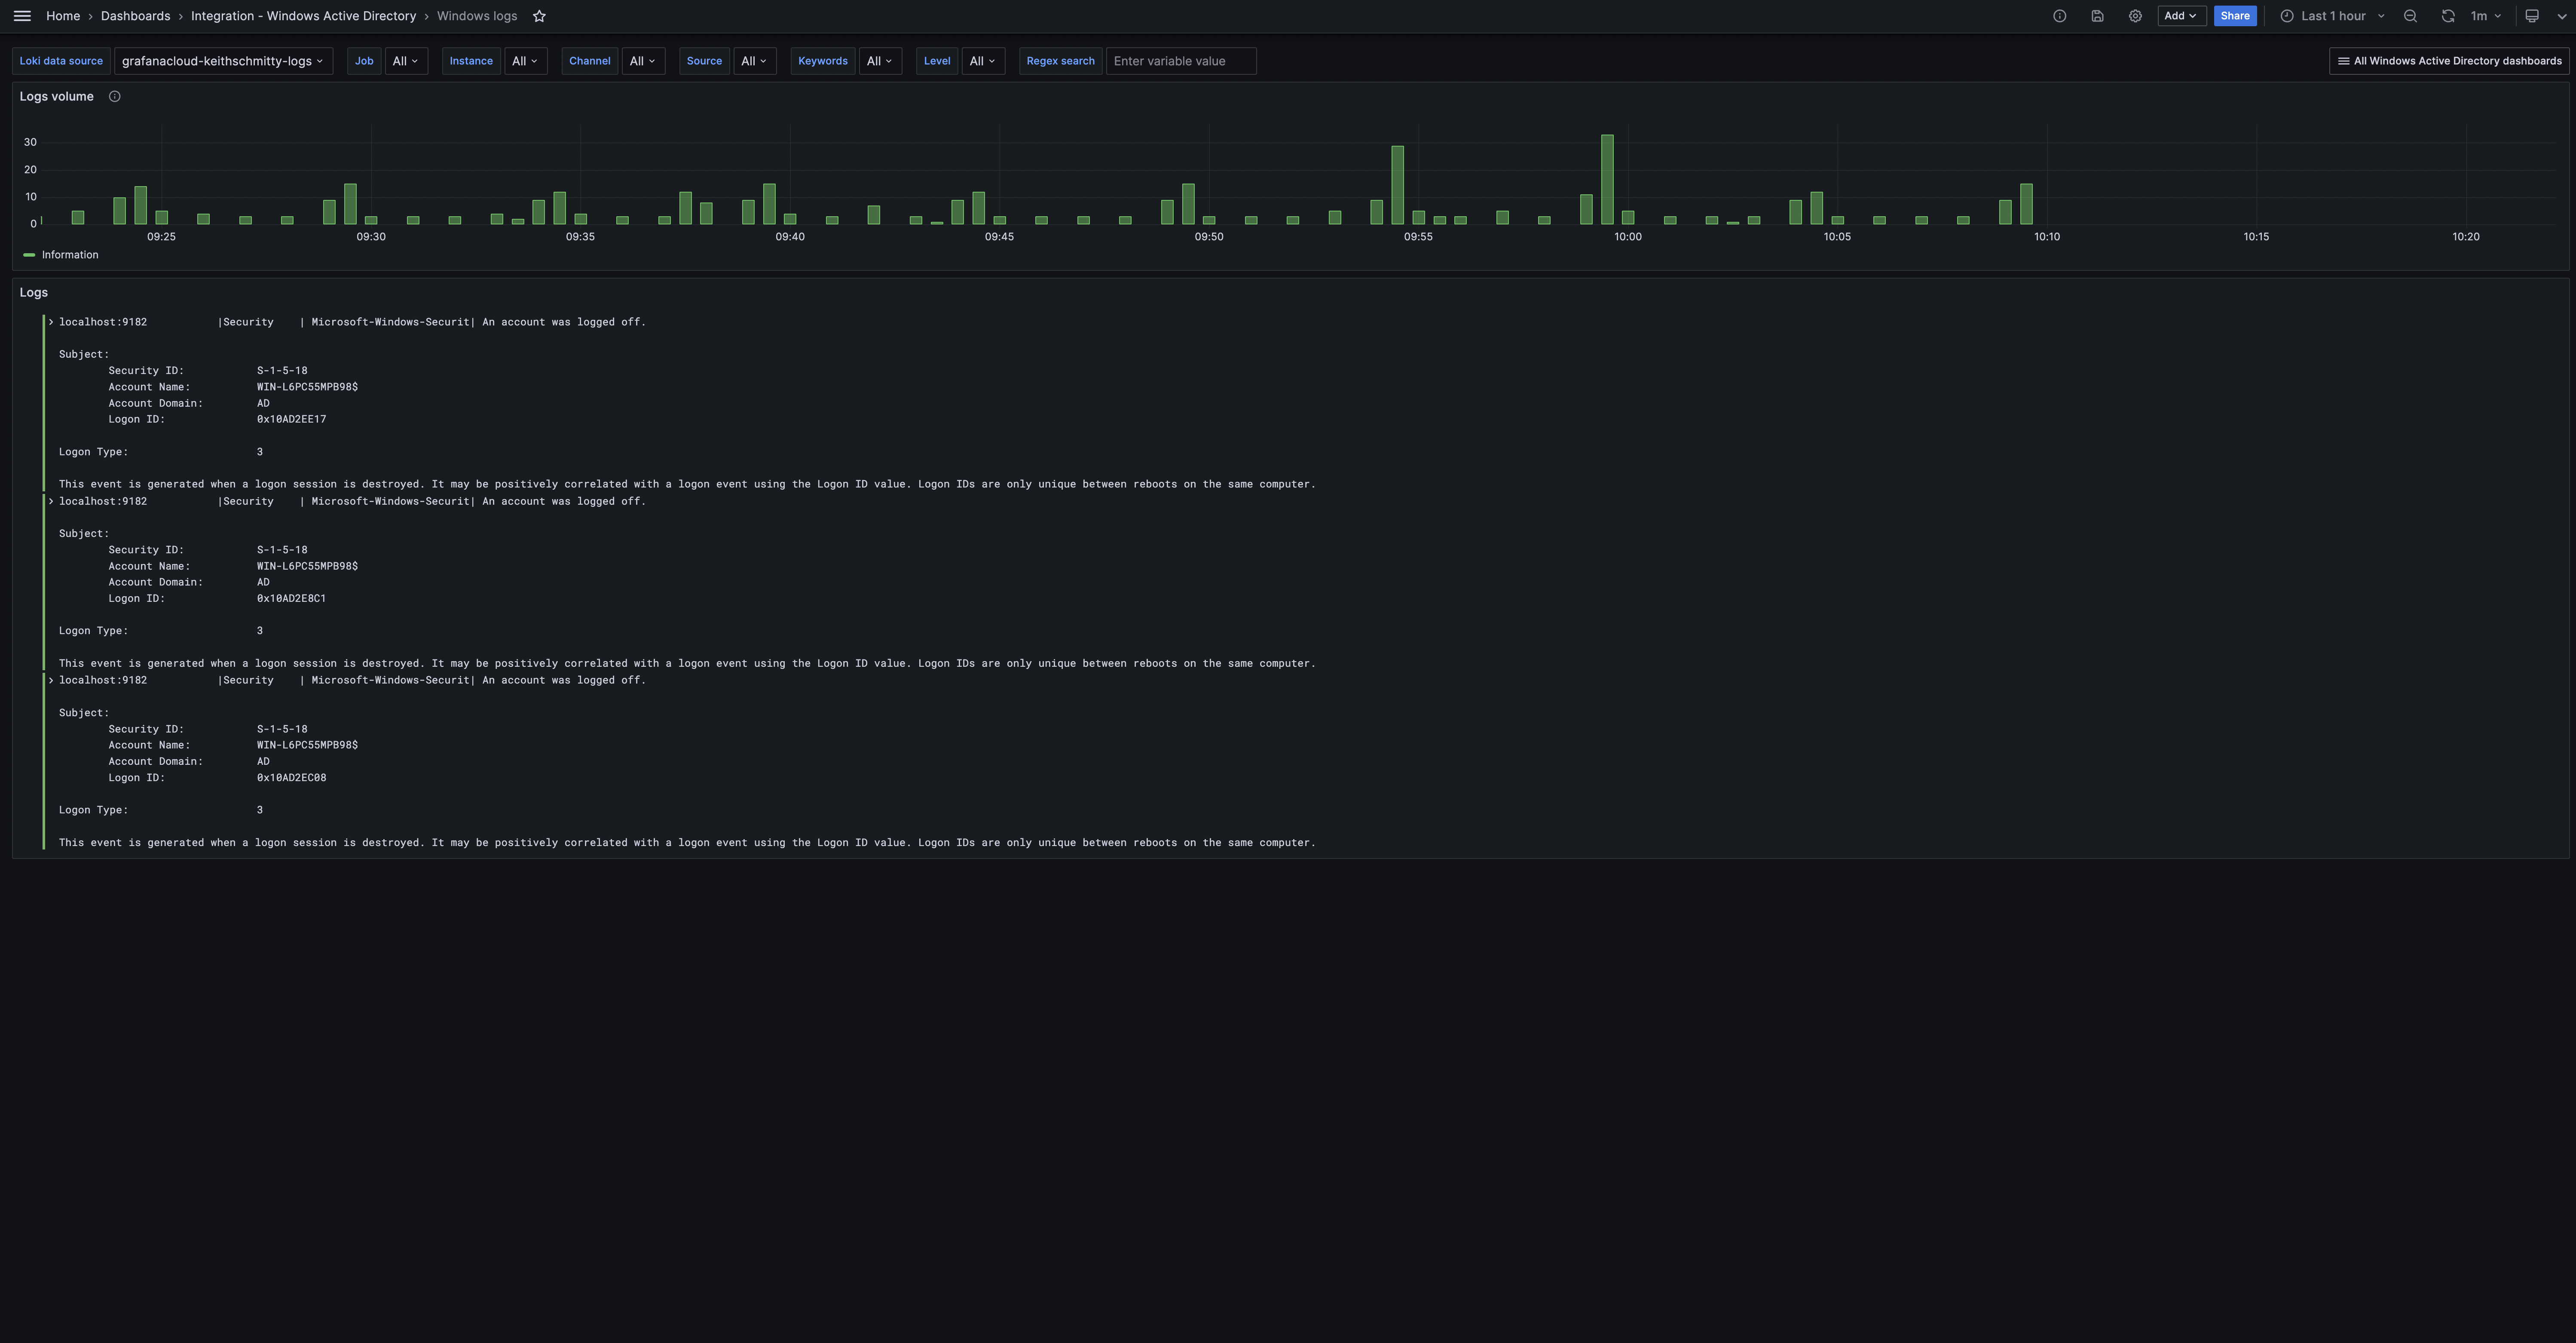
- Windows logs
Windows Active Directory overview
Windows Active Directory logs
Alerts
The Windows Active Directory integration includes the following useful alerts:
| Alert | Description |
|---|---|
| WindowsActiveDirectoryHighPendingReplicationOperations | Warning: There is a high number of pending replication operations in Active Directory. A high number of pending operations sustained over a period of time can indicate a problem with replication. |
| WindowsActiveDirectoryHighReplicationSyncRequestFailures | Critical: There are a number of replication synchronization request failures. These can cause authentication failures, outdated information being propagated across domain controllers, and potentially data loss or inconsistencies. |
| WindowsActiveDirectoryHighPasswordChanges | Warning: There is a high number of password changes. This may indicate unauthorized changes or attacks. |
| WindowsActiveDirectoryMetricsDown | Critical: Windows Active Directory metrics are down. |
Metrics
The most important metrics provided by the Windows Active Directory integration, which are used on the pre-built dashboards and Prometheus alerts, are as follows:
- up
- windows_ad_binds_total
- windows_ad_database_operations_total
- windows_ad_directory_operations_total
- windows_ad_directory_service_threads
- windows_ad_replication_data_intersite_bytes_total
- windows_ad_replication_data_intrasite_bytes_total
- windows_ad_replication_inbound_objects_updated_total
- windows_ad_replication_inbound_properties_updated_total
- windows_ad_replication_pending_operations
- windows_ad_replication_pending_synchronizations
- windows_ad_replication_sync_requests_schema_mismatch_failure_total
- windows_ad_sam_password_changes_total
- windows_cs_hostname
- windows_os_info
Changelog
# 1.0.0 - January 2024

- Initial release
Cost
By connecting your Windows Active Directory instance to Grafana Cloud, you might incur charges. To view information on the number of active series that your Grafana Cloud account uses for metrics included in each Cloud tier, see Active series and dpm usage and Cloud tier pricing.
Was this page helpful?
Related resources from Grafana Labs


