
Ubiquiti EdgeRouter integration for Grafana Cloud
Ubiquiti EdgeRouter dashboard lets you see vital metrics on throughput, errors, and traffic distribution.
This integration includes 1 pre-built dashboard to help monitor and visualize Ubiquiti EdgeRouter metrics.
Before you begin
You must enable the SNMP service on your router before Grafana Alloy can scrape metrics from it.
You can find details on how to enable SNMP on your router in the official Ubiquiti support docs.
Install Ubiquiti EdgeRouter integration for Grafana Cloud
- In your Grafana Cloud stack, click Connections in the left-hand menu.
- Find Ubiquiti EdgeRouter and click its tile to open the integration.
- Review the prerequisites in the Configuration Details tab and set up Grafana Agent to send Ubiquiti EdgeRouter metrics to your Grafana Cloud instance.
- Click Install to add this integration’s pre-built dashboard to your Grafana Cloud instance, and you can start monitoring your Ubiquiti EdgeRouter setup.
Configuration snippets for Grafana Alloy
Advanced mode
The following snippets provide examples to guide you through the configuration process.
To instruct Grafana Alloy to scrape your Ubiquiti EdgeRouter instances, manually copy and append the snippets to your alloy configuration file, then follow subsequent instructions.
Advanced integrations snippets
prometheus.exporter.snmp "integrations_snmp" {
	config_file = "</path/to/snmp.yml>"

	target "router_1" {
		address     = "<router_1_address>"
		module      = "ubnt_router"
		walk_params = "ubnt_router"
	}

	walk_param "ubnt_router" { }
}

discovery.relabel "integrations_snmp" {
	targets = prometheus.exporter.snmp.integrations_snmp.targets

	rule {
		target_label = "job"
		replacement  = "integrations/ubiquiti-edgerouter"
	}
}

prometheus.scrape "integrations_snmp" {
	targets    = discovery.relabel.integrations_snmp.output
	forward_to = [prometheus.remote_write.metrics_service.receiver]
	job_name   = "integrations/snmp"
}
This integrations uses the prometheus.exporter.snmp component to generate metrics from a Ubiquiti EdgeRouter instance.
This integration requires a specific module that defines only the SNMP OIDs used by this dashboard.
If you are familiar with the SNMP exporter, and are generating your own configuration for it, you can find the definition for the required ubnt_router module here.
Otherwise, you can use the pre-generated config which includes only this module here.
In either case, you need to add the path to your fully rendered snmp.yml with the ubnt_router module or the pre-generated config to the prometheus.exporter.snmp component. Note the config_file parameter in the provided example snippet.
For the full array of configuration options, refer to the prometheus.exporter.snmp component reference documentation.
This exporter must be linked with a discovery.relabel component to apply the necessary relabelings.
For each Ubiquiti EdgeRouter instance to be monitored you must create add a target to the prometheus.exporter.snmp component, making sure to change <router_1_address> to the hostname or IP address of the target router.
Grafana Agent static configuration (deprecated)
The following section shows configuration for running Grafana Agent in static mode which is deprecated. You should use Grafana Alloy for all new deployments.
Before you begin
You must enable the SNMP service on your router before Grafana Agent can scrape metrics from it.
You can find details on how to enable SNMP on your router in the official Ubiquiti support docs.
Install Ubiquiti EdgeRouter integration for Grafana Cloud
- In your Grafana Cloud stack, click Connections in the left-hand menu.
- Find Ubiquiti EdgeRouter and click its tile to open the integration.
- Review the prerequisites in the Configuration Details tab and set up Grafana Agent to send Ubiquiti EdgeRouter metrics to your Grafana Cloud instance.
- Click Install to add this integration’s pre-built dashboard to your Grafana Cloud instance, and you can start monitoring your Ubiquiti EdgeRouter setup.
Post-install configuration for the Ubiquiti EdgeRouter integration
This integration is configured to work with the snmp_exporter, which is embedded in Grafana Agent.
Enable the integration by adding the provided snippet to your agent configuration file.
This integration requires a specific module that defines only the SNMP OIDs used by this dashboard.
If you are familiar with the SNMP exporter, and are generating your own configuration for it, you can find the definition for the required ubnt_router module here.
Otherwise, you can use the pre-generated config which includes only this module here.
In either case, you need to add the path to your fully rendered snmp.yml with the ubnt_router module or the pre-generated config to the SNMP configuration of your agent. Note the config_file: parameter in the provided example snippet.
Be sure to replace <router_1_address> with the hostname or IP of your router.
For a full description of configuration options see how to configure the snmp block in the agent documentation.
Configuration snippets for Grafana Agent
Below integrations, insert the following lines and change the URLs according to your environment:
  snmp:
    enabled: true
    config_file: '</path/to/snmp.yml>'
    snmp_targets:
    - name: router_1
      address: '<router_1_address>'
      module: ubnt_router
      walk_params: ubnt_router
    walk_params:
      ubnt_router:
        version: 2
        auth:
          community: public
    relabel_configs:
    - replacement: integrations/ubiquiti-edgerouter
      target_label: job
Full example configuration for Grafana Agent
Refer to the following Grafana Agent configuration for a complete example that contains all the snippets used for the Ubiquiti EdgeRouter integration. This example also includes metrics that are sent to monitor your Grafana Agent instance.
integrations:
  prometheus_remote_write:
  - basic_auth:
      password: <your_prom_pass>
      username: <your_prom_user>
    url: <your_prom_url>
  agent:
    enabled: true
    relabel_configs:
    - action: replace
      source_labels:
      - agent_hostname
      target_label: instance
    - action: replace
      target_label: job
      replacement: "integrations/agent-check"
    metric_relabel_configs:
    - action: keep
      regex: (prometheus_target_sync_length_seconds_sum|prometheus_target_scrapes_.*|prometheus_target_interval.*|prometheus_sd_discovered_targets|agent_build.*|agent_wal_samples_appended_total|process_start_time_seconds)
      source_labels:
      - __name__
  # Add here any snippet that belongs to the `integrations` section.
  # For a correct indentation, paste snippets copied from Grafana Cloud at the beginning of the line.
  snmp:
    enabled: true
    config_file: '</path/to/snmp.yml>'
    snmp_targets:
    - name: router_1
      address: '<router_1_address>'
      module: ubnt_router
      walk_params: ubnt_router
    walk_params:
      ubnt_router:
        version: 2
        auth:
          community: public
    relabel_configs:
    - replacement: integrations/ubiquiti-edgerouter
      target_label: job
logs:
  configs:
  - clients:
    - basic_auth:
        password: <your_loki_pass>
        username: <your_loki_user>
      url: <your_loki_url>
    name: integrations
    positions:
      filename: /tmp/positions.yaml
    scrape_configs:
      # Add here any snippet that belongs to the `logs.configs.scrape_configs` section.
      # For a correct indentation, paste snippets copied from Grafana Cloud at the beginning of the line.
metrics:
  configs:
  - name: integrations
    remote_write:
    - basic_auth:
        password: <your_prom_pass>
        username: <your_prom_user>
      url: <your_prom_url>
    scrape_configs:
      # Add here any snippet that belongs to the `metrics.configs.scrape_configs` section.
      # For a correct indentation, paste snippets copied from Grafana Cloud at the beginning of the line.
  global:
    scrape_interval: 60s
  wal_directory: /tmp/grafana-agent-wal
Dashboards
The Ubiquiti EdgeRouter integration installs the following dashboards in your Grafana Cloud instance to help monitor your system.
- Ubiquiti EdgeRouter Overview
System Identification, Uptime & System, CPU
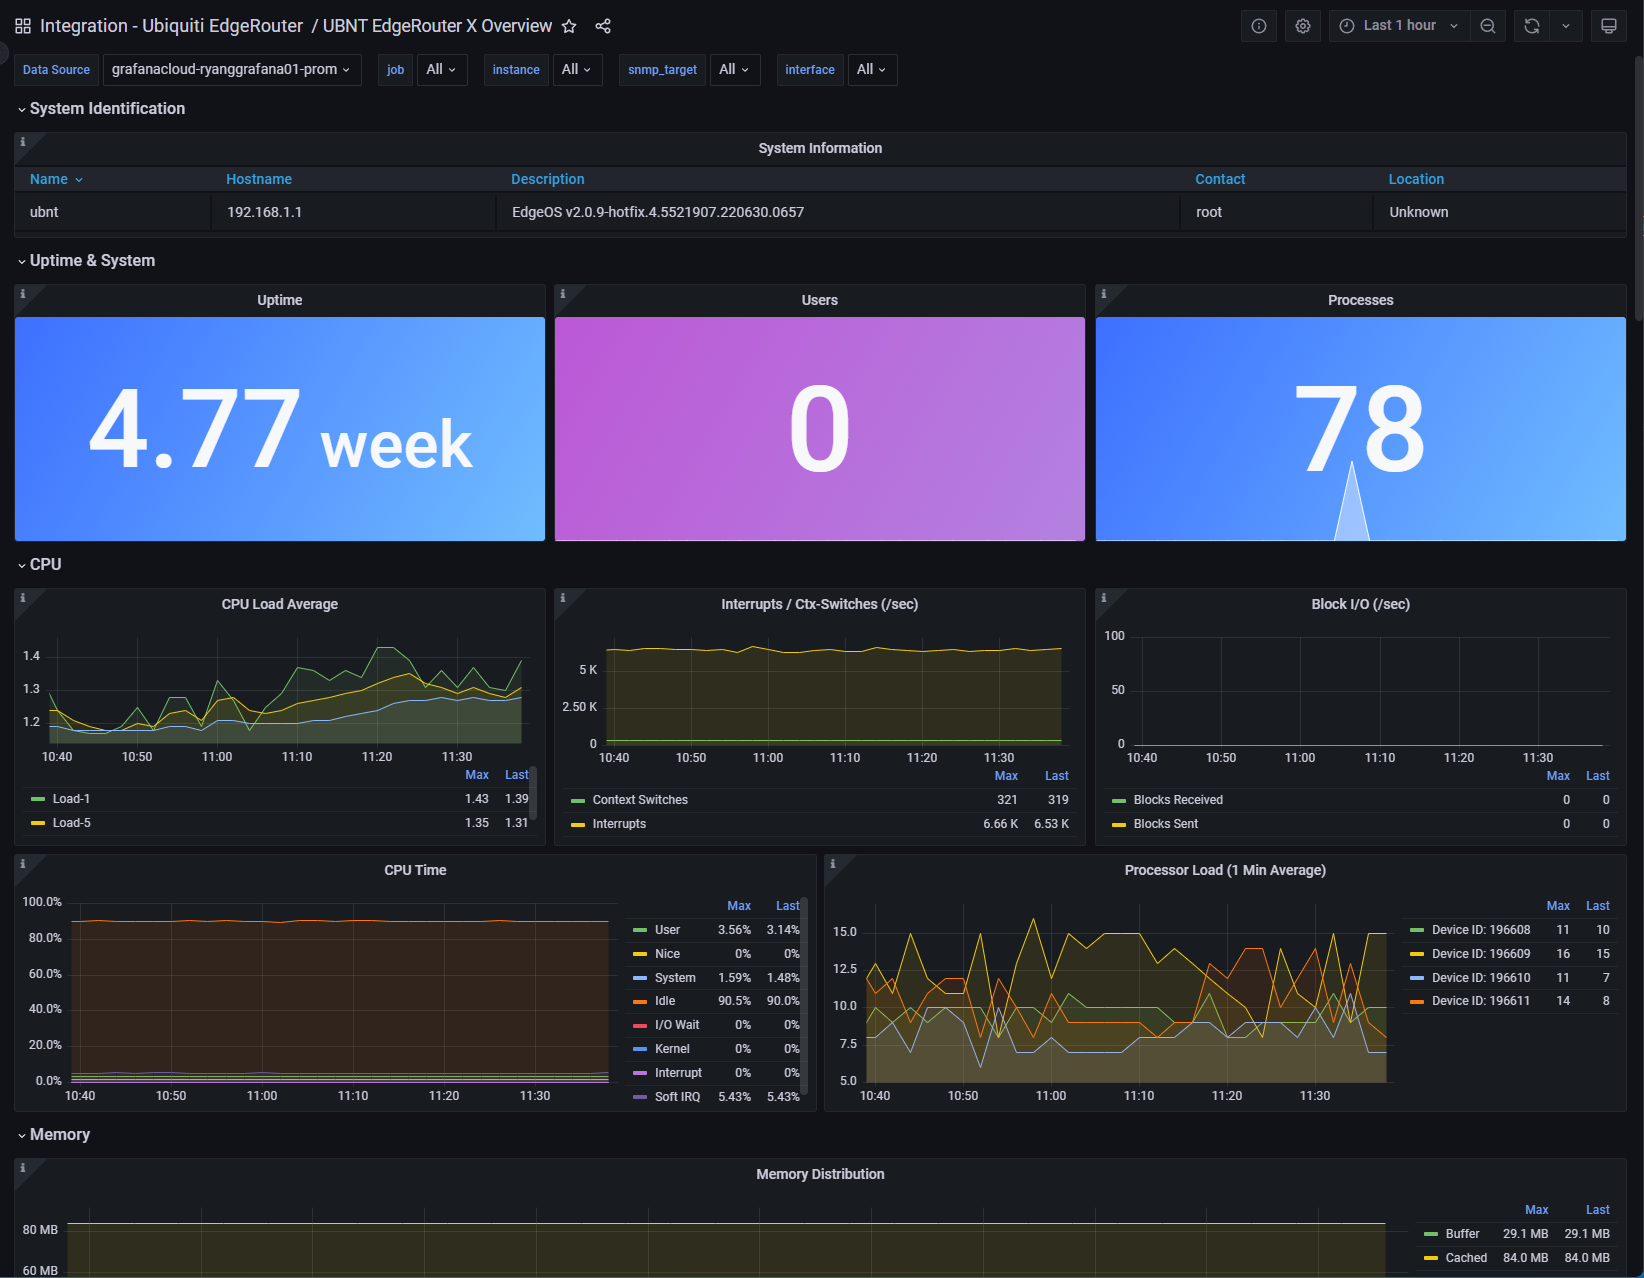
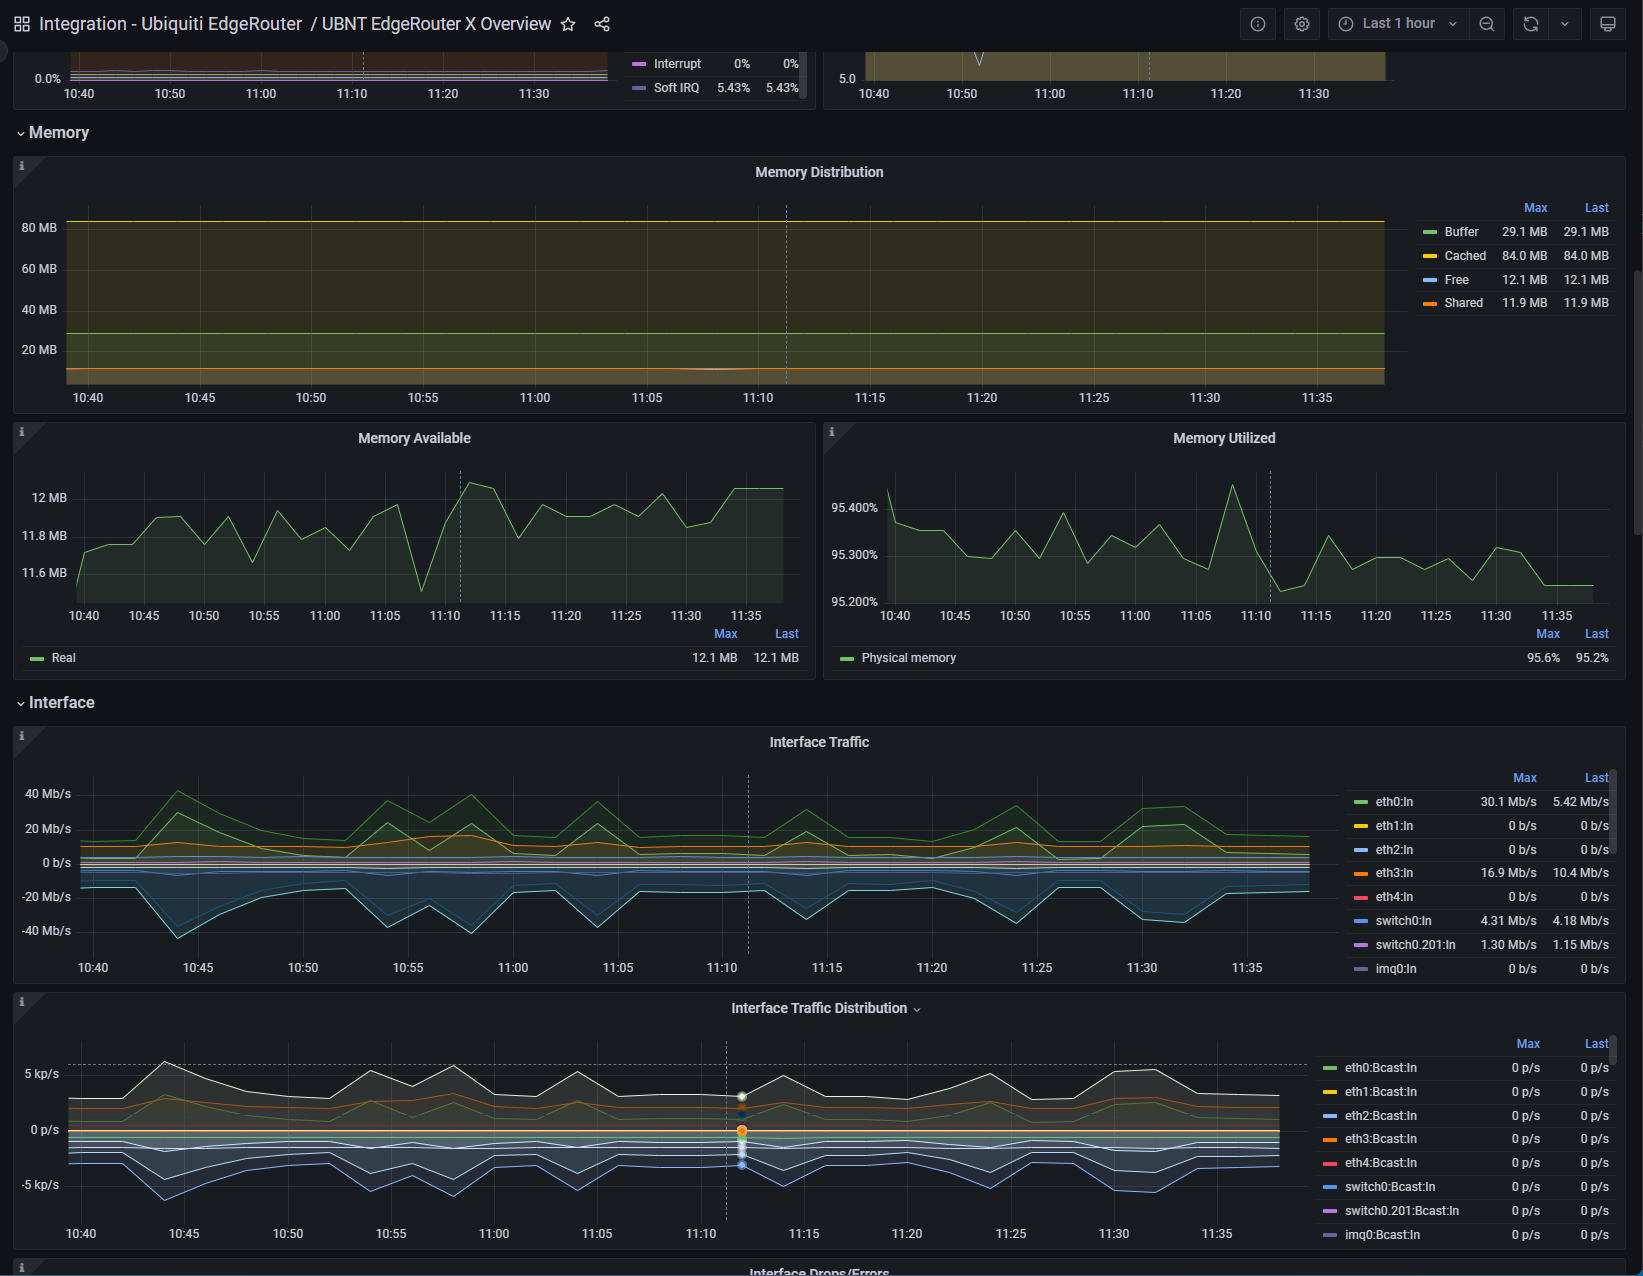
Memory, Interface
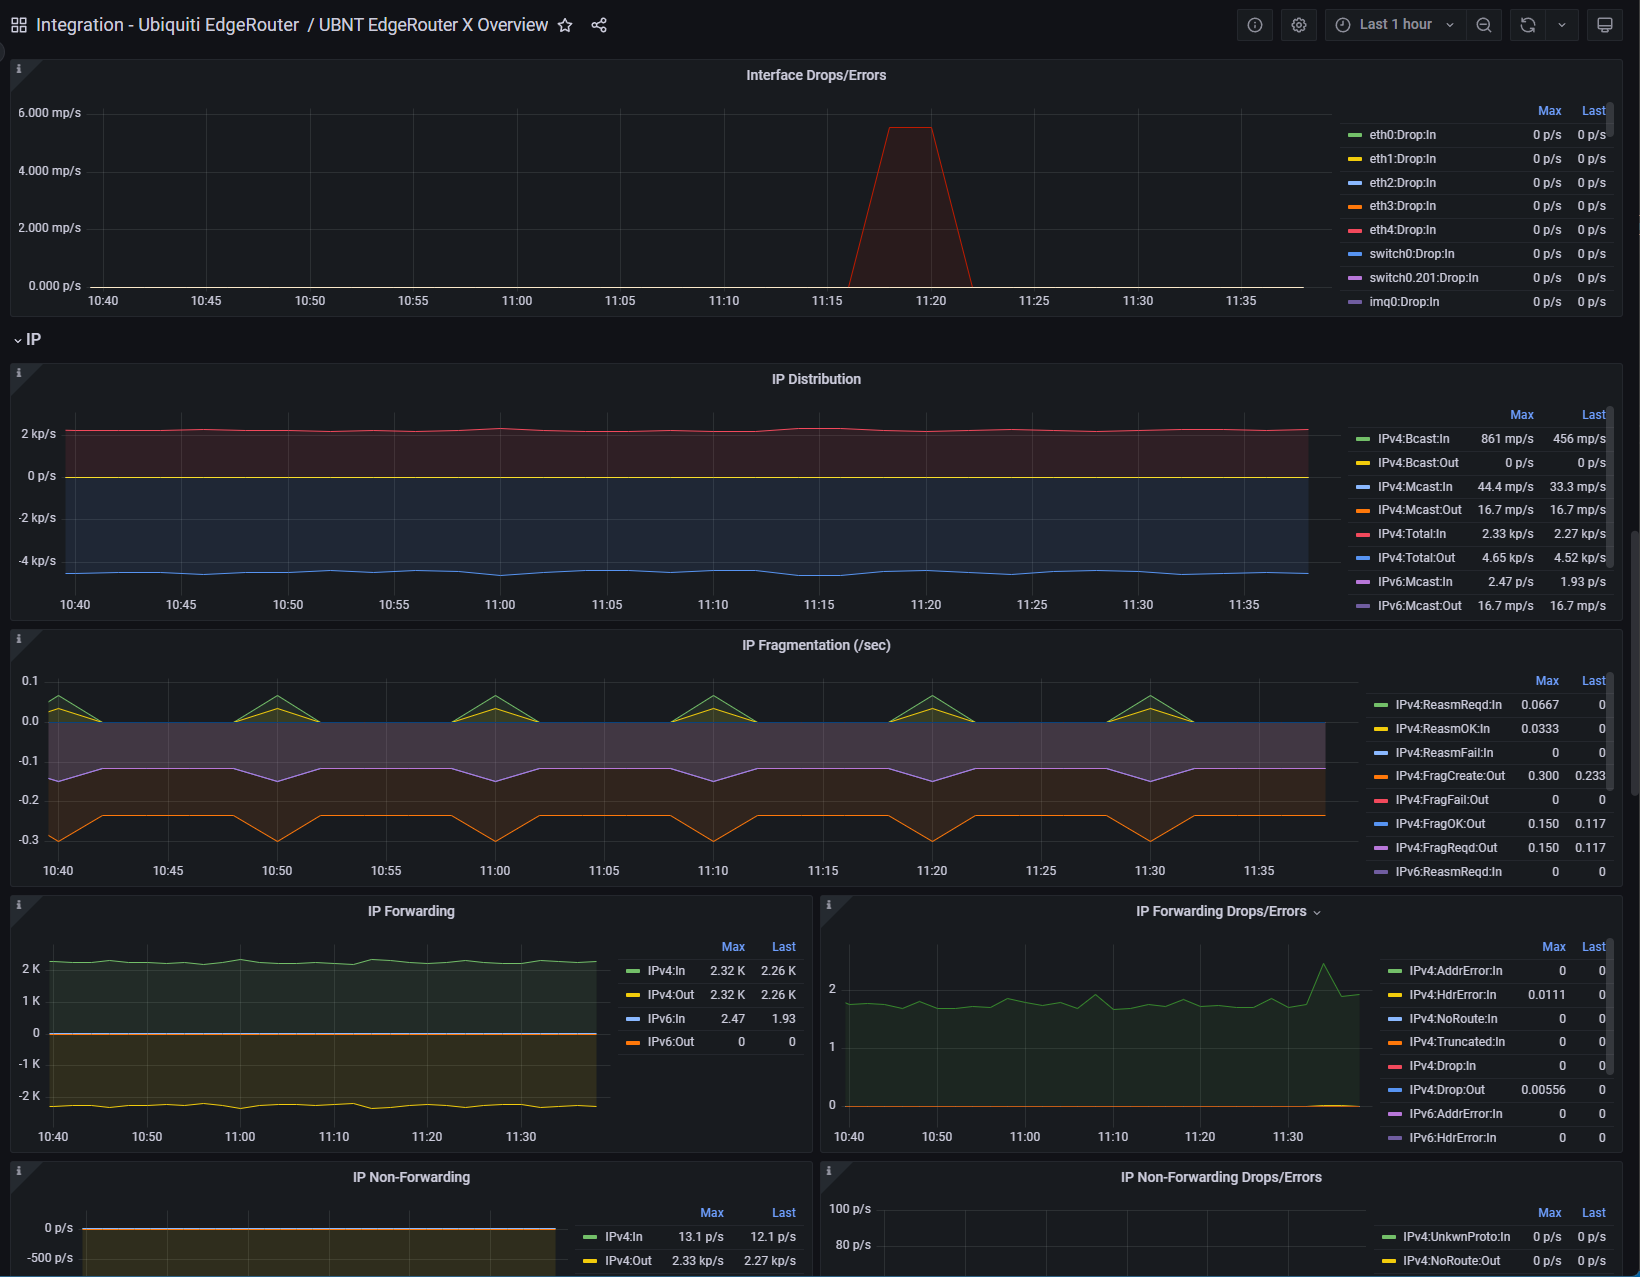
IP
Metrics
The most important metrics provided by the Ubiquiti EdgeRouter integration, which are used on the pre-built dashboard, are as follows:
- hrProcessorLoad
- hrStorageSize
- hrStorageUsed
- hrSystemNumUsers
- hrSystemProcesses
- hrSystemUptime
- icmpMsgStatsInPkts
- icmpMsgStatsOutPkts
- icmpStatsInErrors
- icmpStatsInMsgs
- icmpStatsOutErrors
- icmpStatsOutMsgs
- ifHCInBroadcastPkts
- ifHCInMulticastPkts
- ifHCInOctets
- ifHCInUcastPkts
- ifHCOutBroadcastPkts
- ifHCOutMulticastPkts
- ifHCOutOctets
- ifHCOutUcastPkts
- ifInDiscards
- ifInErrors
- ifInUnknownProtos
- ifNiceName
- ifOutDiscards
- ifOutErrors
- inetCidrRouteNumber
- ipForwardNumber
- ipRoutingDiscards
- ipSystemStatsHCInBcastPkts
- ipSystemStatsHCInDelivers
- ipSystemStatsHCInForwDatagrams
- ipSystemStatsHCInMcastPkts
- ipSystemStatsHCInReceives
- ipSystemStatsHCOutBcastPkts
- ipSystemStatsHCOutForwDatagrams
- ipSystemStatsHCOutMcastPkts
- ipSystemStatsHCOutRequests
- ipSystemStatsHCOutTransmits
- ipSystemStatsInAddrErrors
- ipSystemStatsInDiscards
- ipSystemStatsInHdrErrors
- ipSystemStatsInNoRoutes
- ipSystemStatsInTruncatedPkts
- ipSystemStatsInUnknownProtos
- ipSystemStatsOutDiscards
- ipSystemStatsOutFragCreates
- ipSystemStatsOutFragFails
- ipSystemStatsOutFragOKs
- ipSystemStatsOutFragReqds
- ipSystemStatsOutNoRoutes
- ipSystemStatsReasmFails
- ipSystemStatsReasmOKs
- ipSystemStatsReasmReqds
- laLoadInt
- memAvailReal
- memBuffer
- memCached
- memShared
- memTotalFree
- snmpInGetNexts
- snmpInGetRequests
- snmpInGetResponses
- snmpInPkts
- snmpInTotalReqVars
- snmpOutGetNexts
- snmpOutGetRequests
- snmpOutGetResponses
- snmpOutPkts
- ssCpuRawIdle
- ssCpuRawInterrupt
- ssCpuRawKernel
- ssCpuRawNice
- ssCpuRawSoftIRQ
- ssCpuRawSystem
- ssCpuRawUser
- ssCpuRawWait
- ssIORawReceived
- ssIORawSent
- ssRawContexts
- ssRawInterrupts
- sysContact
- sysDescr
- sysLocation
- sysName
- tcpActiveOpens
- tcpAttemptFails
- tcpCurrEstab
- tcpEstabResets
- tcpInErrs
- tcpInSegs
- tcpOutRsts
- tcpOutSegs
- tcpPassiveOpens
- tcpRetransSegs
- udpInDatagrams
- udpInErrors
- udpNoPorts
- udpOutDatagrams
- up
Changelog
# 0.0.3 - September 2023

* New Filter Metrics option for configuring the Grafana Agent, which saves on metrics cost by dropping any metric not used by this integration. Beware that anything custom built using metrics that are not on the snippet will stop working.

# 0.0.2 - May 2023

* Updated prometheus job name to differ from SNMP Integration. No need to update if you are using the old job name.

# 0.0.1 - October 2022

* Initial Release
Cost
By connecting your Ubiquiti EdgeRouter instance to Grafana Cloud, you might incur charges. To view information on the number of active series that your Grafana Cloud account uses for metrics included in each Cloud tier, see Active series and dpm usage and Cloud tier pricing.
Was this page helpful?
Related resources from Grafana Labs


