
Squid integration for Grafana Cloud
Squid is a popular open-source proxy server that is used to improve web performance and provide content caching for web clients. The Squid integration uses the Grafana agent to collect metrics for monitoring a Squid instance, including aspects such as cache hits & miss service time, cache hit ratios, client and server requests, server object swaps, and DNS lookup service time. The integration also supports Squid logs being scraped by the agent using Promtail. An accompanying dashboard is provided to visualize these metrics and logs.
This integration supports Squid 5+.
This integration includes 5 useful alerts and 1 pre-built dashboard to help monitor and visualize Squid metrics and logs.
Before you begin
This integration monitors a Squid proxy server instance.
In order to scrape these metrics, you must have a running and reachable Squid instance.
Install Squid integration for Grafana Cloud
- In your Grafana Cloud stack, click Connections in the left-hand menu.
- Find Squid and click its tile to open the integration.
- Review the prerequisites in the Configuration Details tab and set up Grafana Agent to send Squid metrics and logs to your Grafana Cloud instance.
- Click Install to add this integration’s pre-built dashboard and alerts to your Grafana Cloud instance, and you can start monitoring your Squid setup.
Configuration snippets for Grafana Alloy
Simple mode
These snippets are configured to scrape a single Squid instance running locally with default ports.
First, manually copy and append the following snippets into your alloy configuration file.
Logs snippets
darwin
local.file_match "logs_integrations_integrations_squid" {
	path_targets = [{
		__address__ = "localhost",
		__path__    = "/var/log/squid/cache.log",
		instance    = constants.hostname,
		job         = "integrations/squid",
	}, {
		__address__ = "localhost",
		__path__    = "/var/log/squid/access.log",
		instance    = constants.hostname,
		job         = "integrations/squid",
	}]
}

loki.source.file "logs_integrations_integrations_squid" {
	targets    = local.file_match.logs_integrations_integrations_squid.targets
	forward_to = [loki.write.grafana_cloud_loki.receiver]
}
linux
local.file_match "logs_integrations_integrations_squid" {
	path_targets = [{
		__address__ = "localhost",
		__path__    = "/var/log/squid/cache.log",
		instance    = constants.hostname,
		job         = "integrations/squid",
	}, {
		__address__ = "localhost",
		__path__    = "/var/log/squid/access.log",
		instance    = constants.hostname,
		job         = "integrations/squid",
	}]
}

loki.source.file "logs_integrations_integrations_squid" {
	targets    = local.file_match.logs_integrations_integrations_squid.targets
	forward_to = [loki.write.grafana_cloud_loki.receiver]
}
windows
local.file_match "logs_integrations_integrations_squid" {
	path_targets = [{
		__address__ = "localhost",
		__path__    = "/var/log/squid/cache.log",
		instance    = constants.hostname,
		job         = "integrations/squid",
	}, {
		__address__ = "localhost",
		__path__    = "/var/log/squid/access.log",
		instance    = constants.hostname,
		job         = "integrations/squid",
	}]
}

loki.source.file "logs_integrations_integrations_squid" {
	targets    = local.file_match.logs_integrations_integrations_squid.targets
	forward_to = [loki.write.grafana_cloud_loki.receiver]
}
Advanced mode
The following snippets provide examples to guide you through the configuration process.
To instruct Grafana Alloy to scrape your Squid instances, manually copy and append the snippets to your alloy configuration file, then follow subsequent instructions.
Advanced integrations snippets
prometheus.exporter.squid "integrations_squid" {
	address = "<squid_hostname>:<squid_port>"
}

discovery.relabel "integrations_squid" {
	targets = prometheus.exporter.squid.integrations_squid.targets

	rule {
		target_label = "instance"
		replacement  = constants.hostname
	}

	rule {
		target_label = "job"
		replacement  = "integrations/squid"
	}
}

prometheus.scrape "integrations_squid" {
	targets    = discovery.relabel.integrations_squid.output
	forward_to = [prometheus.remote_write.metrics_service.receiver]
	job_name   = "integrations/squid"
}
This integrations uses the prometheus.exporter.squid component to generate metrics from a Squid instance.
For the full array of configuration options, refer to the prometheus.exporter.squid component reference documentation.
This exporter must be linked with a discovery.relabel component to apply the necessary relabelings.
For each Squid instance to be monitored you must create a pair of these components.
Configure the following properties within each discovery.relabel component:
instancelabel:constants.hostnamesets theinstancelabel to your Grafana Alloy server hostname. If that is not suitable, change it to a value uniquely identifies this Squid instance. Make sure this label value is the same for all telemetry data collected for this instance.
You can then scrape them by including each discovery.relabel under targets within the prometheus.scrape component.
Advanced logs snippets
darwin
local.file_match "logs_integrations_integrations_squid" {
	path_targets = [{
		__address__ = "localhost",
		__path__    = "/var/log/squid/cache.log",
		instance    = constants.hostname,
		job         = "integrations/squid",
	}, {
		__address__ = "localhost",
		__path__    = "/var/log/squid/access.log",
		instance    = constants.hostname,
		job         = "integrations/squid",
	}]
}

loki.source.file "logs_integrations_integrations_squid" {
	targets    = local.file_match.logs_integrations_integrations_squid.targets
	forward_to = [loki.write.grafana_cloud_loki.receiver]
}
To monitor your Squid instance logs, you will use a combination of the following components:
local.file_match defines where to find the log file to be scraped. Change the following properties according to your environment:
__address__: The Squid instance address__path__: The path to the log file.instancelabel:constants.hostnamesets theinstancelabel to your Grafana Alloy server hostname. If that is not suitable, change it to a value uniquely identifies this Squid instance. Make sure this label value is the same for all telemetry data collected for this instance.
loki.source.file sends logs to Loki.
linux
local.file_match "logs_integrations_integrations_squid" {
	path_targets = [{
		__address__ = "localhost",
		__path__    = "/var/log/squid/cache.log",
		instance    = constants.hostname,
		job         = "integrations/squid",
	}, {
		__address__ = "localhost",
		__path__    = "/var/log/squid/access.log",
		instance    = constants.hostname,
		job         = "integrations/squid",
	}]
}

loki.source.file "logs_integrations_integrations_squid" {
	targets    = local.file_match.logs_integrations_integrations_squid.targets
	forward_to = [loki.write.grafana_cloud_loki.receiver]
}
To monitor your Squid instance logs, you will use a combination of the following components:
local.file_match defines where to find the log file to be scraped. Change the following properties according to your environment:
__address__: The Squid instance address__path__: The path to the log file.instancelabel:constants.hostnamesets theinstancelabel to your Grafana Alloy server hostname. If that is not suitable, change it to a value uniquely identifies this Squid instance. Make sure this label value is the same for all telemetry data collected for this instance.
loki.source.file sends logs to Loki.
windows
local.file_match "logs_integrations_integrations_squid" {
	path_targets = [{
		__address__ = "localhost",
		__path__    = "/var/log/squid/cache.log",
		instance    = constants.hostname,
		job         = "integrations/squid",
	}, {
		__address__ = "localhost",
		__path__    = "/var/log/squid/access.log",
		instance    = constants.hostname,
		job         = "integrations/squid",
	}]
}

loki.source.file "logs_integrations_integrations_squid" {
	targets    = local.file_match.logs_integrations_integrations_squid.targets
	forward_to = [loki.write.grafana_cloud_loki.receiver]
}
To monitor your Squid instance logs, you will use a combination of the following components:
local.file_match defines where to find the log file to be scraped. Change the following properties according to your environment:
__address__: The Squid instance address__path__: The path to the log file.instancelabel:constants.hostnamesets theinstancelabel to your Grafana Alloy server hostname. If that is not suitable, change it to a value uniquely identifies this Squid instance. Make sure this label value is the same for all telemetry data collected for this instance.
loki.source.file sends logs to Loki.
Grafana Agent static configuration (deprecated)
The following section shows configuration for running Grafana Agent in static mode which is deprecated. You should use Grafana Alloy for all new deployments.
Before you begin
This integration monitors a Squid proxy server instance.
In order to scrape these metrics, you must have a running and reachable Squid instance.
Install Squid integration for Grafana Cloud
- In your Grafana Cloud stack, click Connections in the left-hand menu.
- Find Squid and click its tile to open the integration.
- Review the prerequisites in the Configuration Details tab and set up Grafana Agent to send Squid metrics and logs to your Grafana Cloud instance.
- Click Install to add this integration’s pre-built dashboard and alerts to your Grafana Cloud instance, and you can start monitoring your Squid setup.
Post-install configuration for the Squid integration
This integration supports metrics and logs from a Squid instance. It is configured to work with the Squid Exporter which has beeen integrated into the Grafana Agent.
Enable the integration by adding the snippets below to your agent configuration file.
If you want to show logs and metrics signals correlated in your dashboards, as a single pane of glass, ensure the following:
job and instance label values must match for metrics and logs scrape config in your agent configuration file.
job label must be set to integrations/squid (already configured in the snippets).
instance label must be set to a value that uniquely identifies your Squid server. Please replace the default hostname value according to your environment - it must be set manually.
address label must be set to the corresponding <squid_hostname>:<squid_port>of your squid instance. Default Squid port is 3128.
username and password are optional parameters for the squid integration to be used for Squid Authentication.
integrations:
  squid:
   enabled: true
   address: <squid_hostname>:<squid_port>
logs:
  configs:
      scrape_configs:
        - job_name: integrations/squid
          static_configs:
            - targets:
                - localhost
              labels:
                job: integrations/squid
                instance: <your-instance>
                __path__: /var/log/squid/cache.log
            - targets:
                - localhost
              labels:
                job: integrations/squid
                instance: <your-instance>
                __path__: /var/log/squid/access.log
Configuration snippets for Grafana Agent
Below integrations, insert the following lines and change the URLs according to your environment:
  squid:
    enabled: true
    address: '<squid_hostname>:<squid_port>'
    relabel_configs:
    - replacement: '<your-instance-name>'
      target_label: instance
Below logs.configs.scrape_configs, insert the following lines according to your environment.
    - job_name: integrations/squid
      static_configs:
        - targets:
            - localhost
          labels:
            job: integrations/squid
            instance: '<your-instance-name>'
            __path__: /var/log/squid/cache.log
        - targets:
              - localhost
          labels:
            job: integrations/squid
            instance: '<your-instance-name>'
            __path__: /var/log/squid/access.log
Full example configuration for Grafana Agent
Refer to the following Grafana Agent configuration for a complete example that contains all the snippets used for the Squid integration. This example also includes metrics that are sent to monitor your Grafana Agent instance.
integrations:
  prometheus_remote_write:
  - basic_auth:
      password: <your_prom_pass>
      username: <your_prom_user>
    url: <your_prom_url>
  agent:
    enabled: true
    relabel_configs:
    - action: replace
      source_labels:
      - agent_hostname
      target_label: instance
    - action: replace
      target_label: job
      replacement: "integrations/agent-check"
    metric_relabel_configs:
    - action: keep
      regex: (prometheus_target_sync_length_seconds_sum|prometheus_target_scrapes_.*|prometheus_target_interval.*|prometheus_sd_discovered_targets|agent_build.*|agent_wal_samples_appended_total|process_start_time_seconds)
      source_labels:
      - __name__
  # Add here any snippet that belongs to the `integrations` section.
  # For a correct indentation, paste snippets copied from Grafana Cloud at the beginning of the line.
  squid:
    enabled: true
    address: '<squid_hostname>:<squid_port>'
    relabel_configs:
    - replacement: '<your-instance-name>'
      target_label: instance
logs:
  configs:
  - clients:
    - basic_auth:
        password: <your_loki_pass>
        username: <your_loki_user>
      url: <your_loki_url>
    name: integrations
    positions:
      filename: /tmp/positions.yaml
    scrape_configs:
      # Add here any snippet that belongs to the `logs.configs.scrape_configs` section.
      # For a correct indentation, paste snippets copied from Grafana Cloud at the beginning of the line.
    - job_name: integrations/squid
      static_configs:
        - targets:
            - localhost
          labels:
            job: integrations/squid
            instance: '<your-instance-name>'
            __path__: /var/log/squid/cache.log
        - targets:
              - localhost
          labels:
            job: integrations/squid
            instance: '<your-instance-name>'
            __path__: /var/log/squid/access.log
metrics:
  configs:
  - name: integrations
    remote_write:
    - basic_auth:
        password: <your_prom_pass>
        username: <your_prom_user>
      url: <your_prom_url>
    scrape_configs:
      # Add here any snippet that belongs to the `metrics.configs.scrape_configs` section.
      # For a correct indentation, paste snippets copied from Grafana Cloud at the beginning of the line.
  global:
    scrape_interval: 60s
  wal_directory: /tmp/grafana-agent-wal
Dashboards
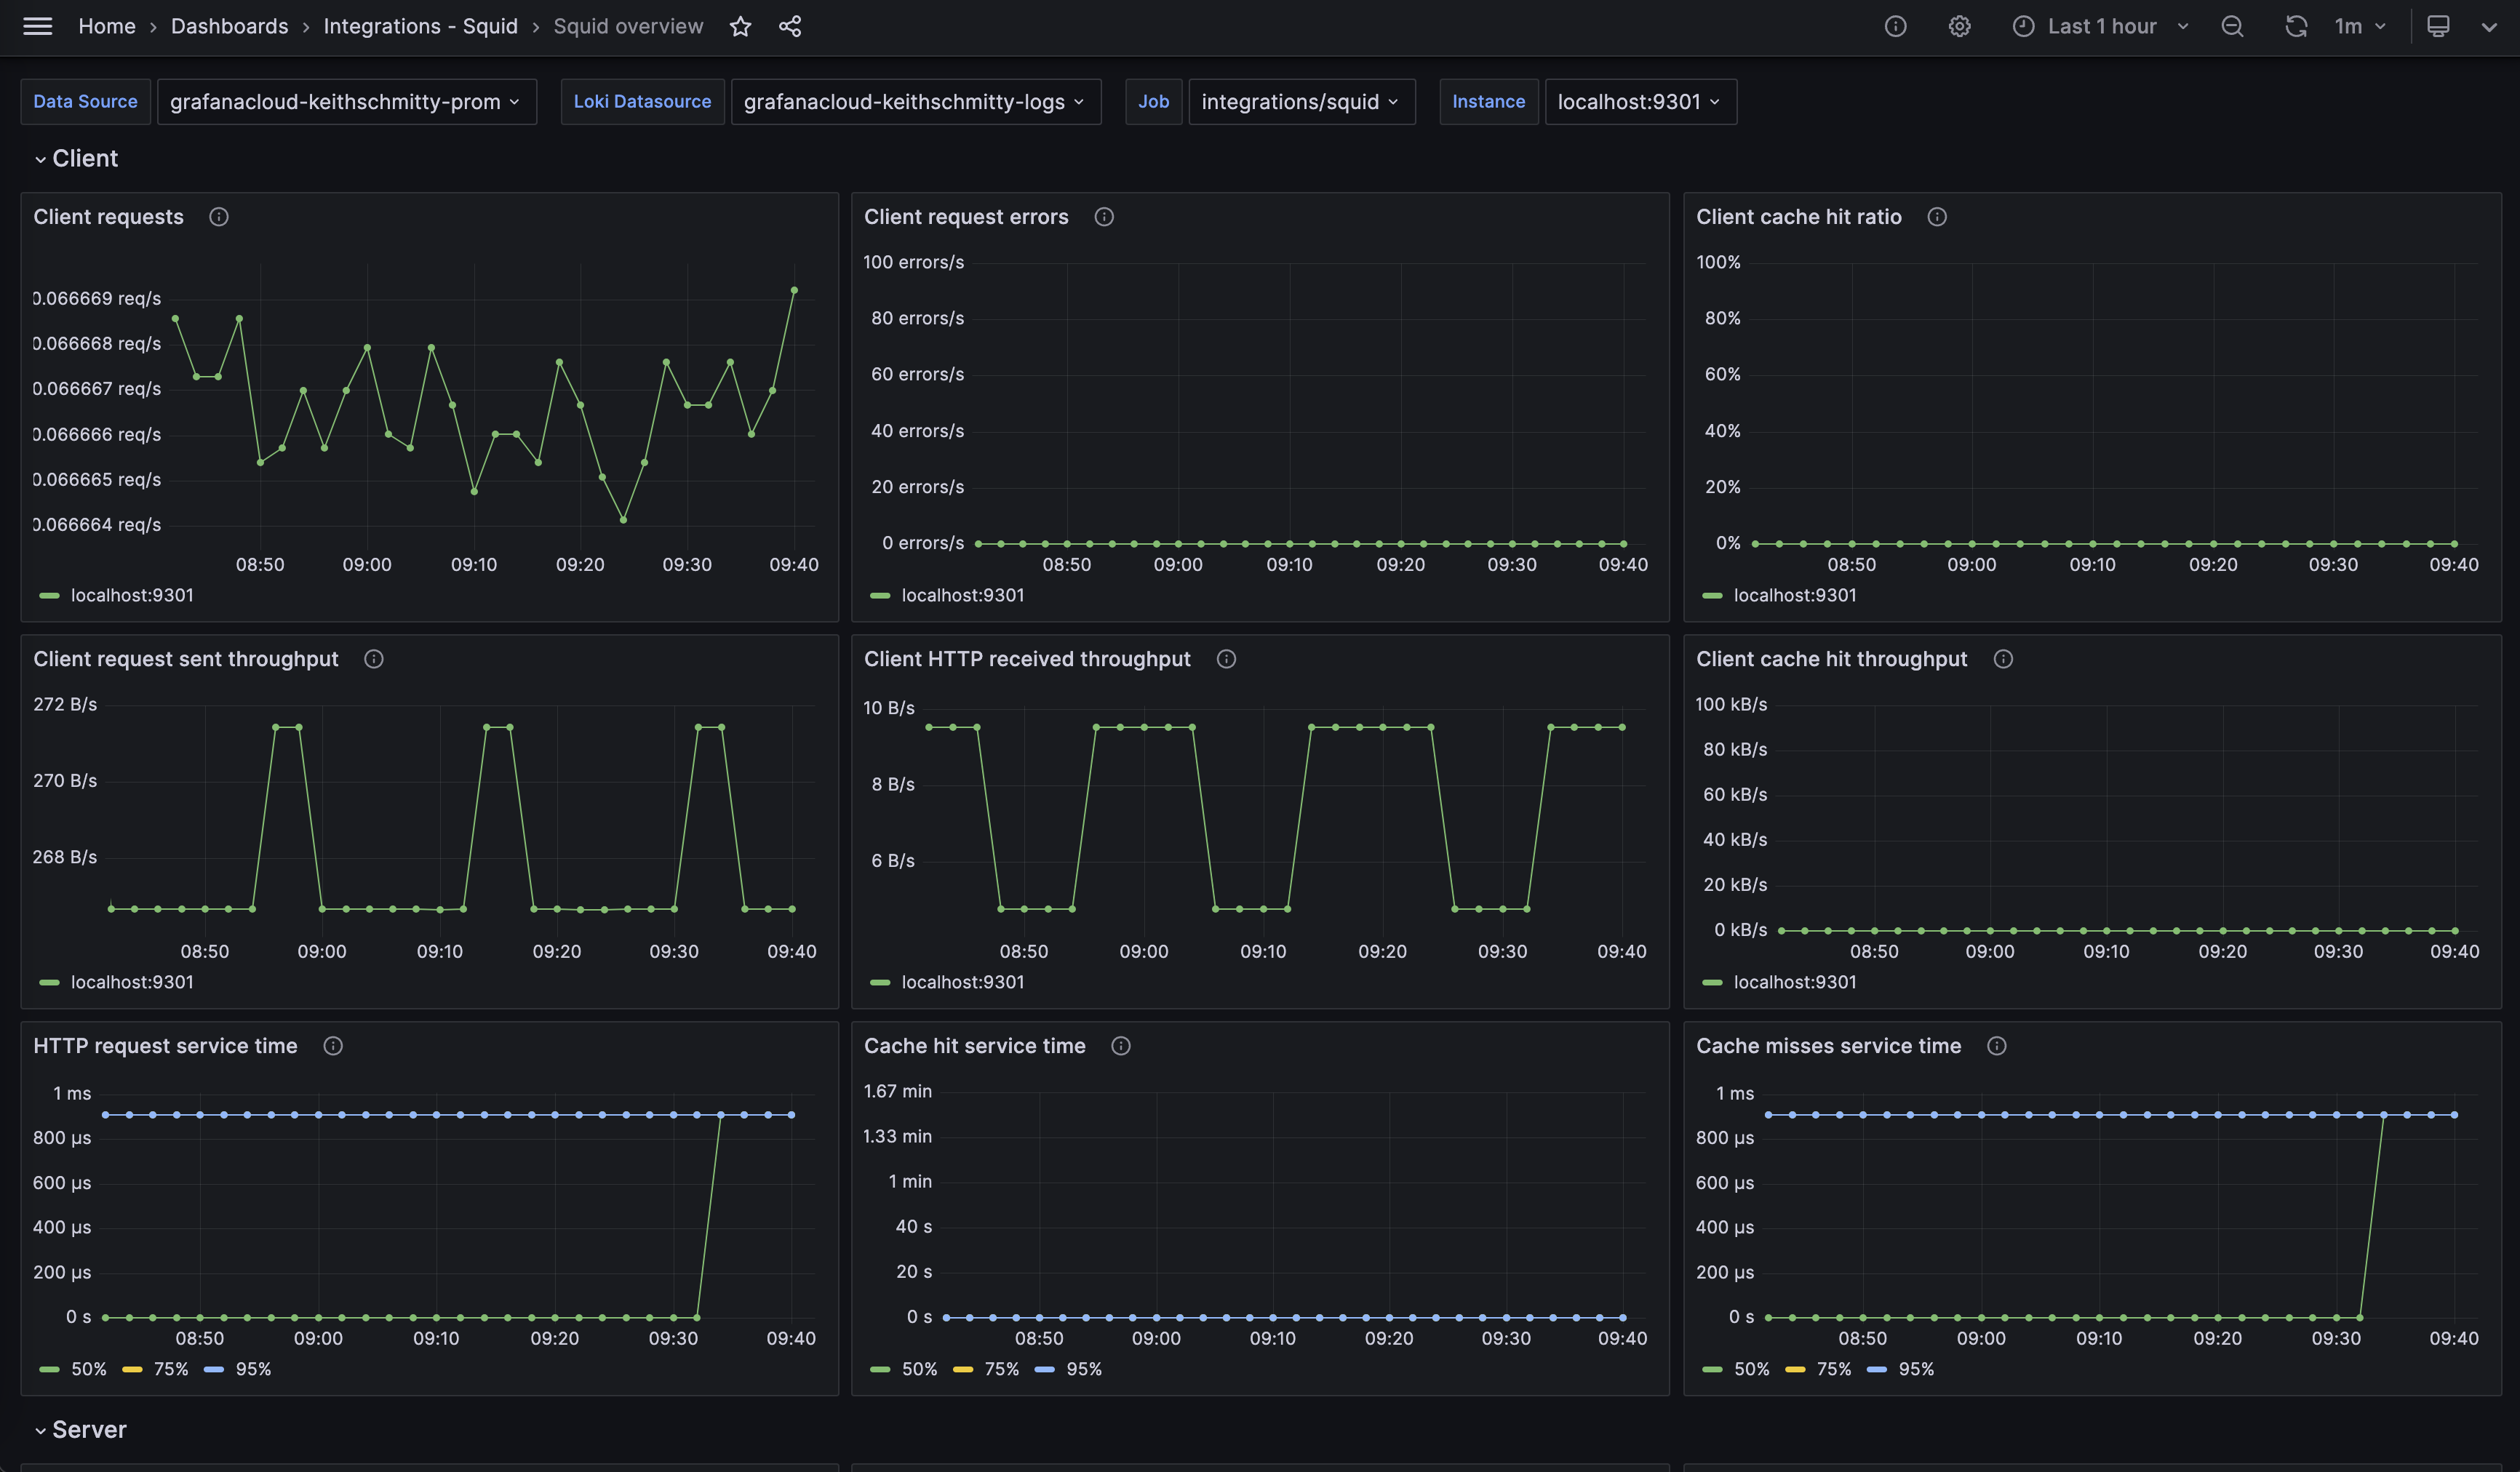
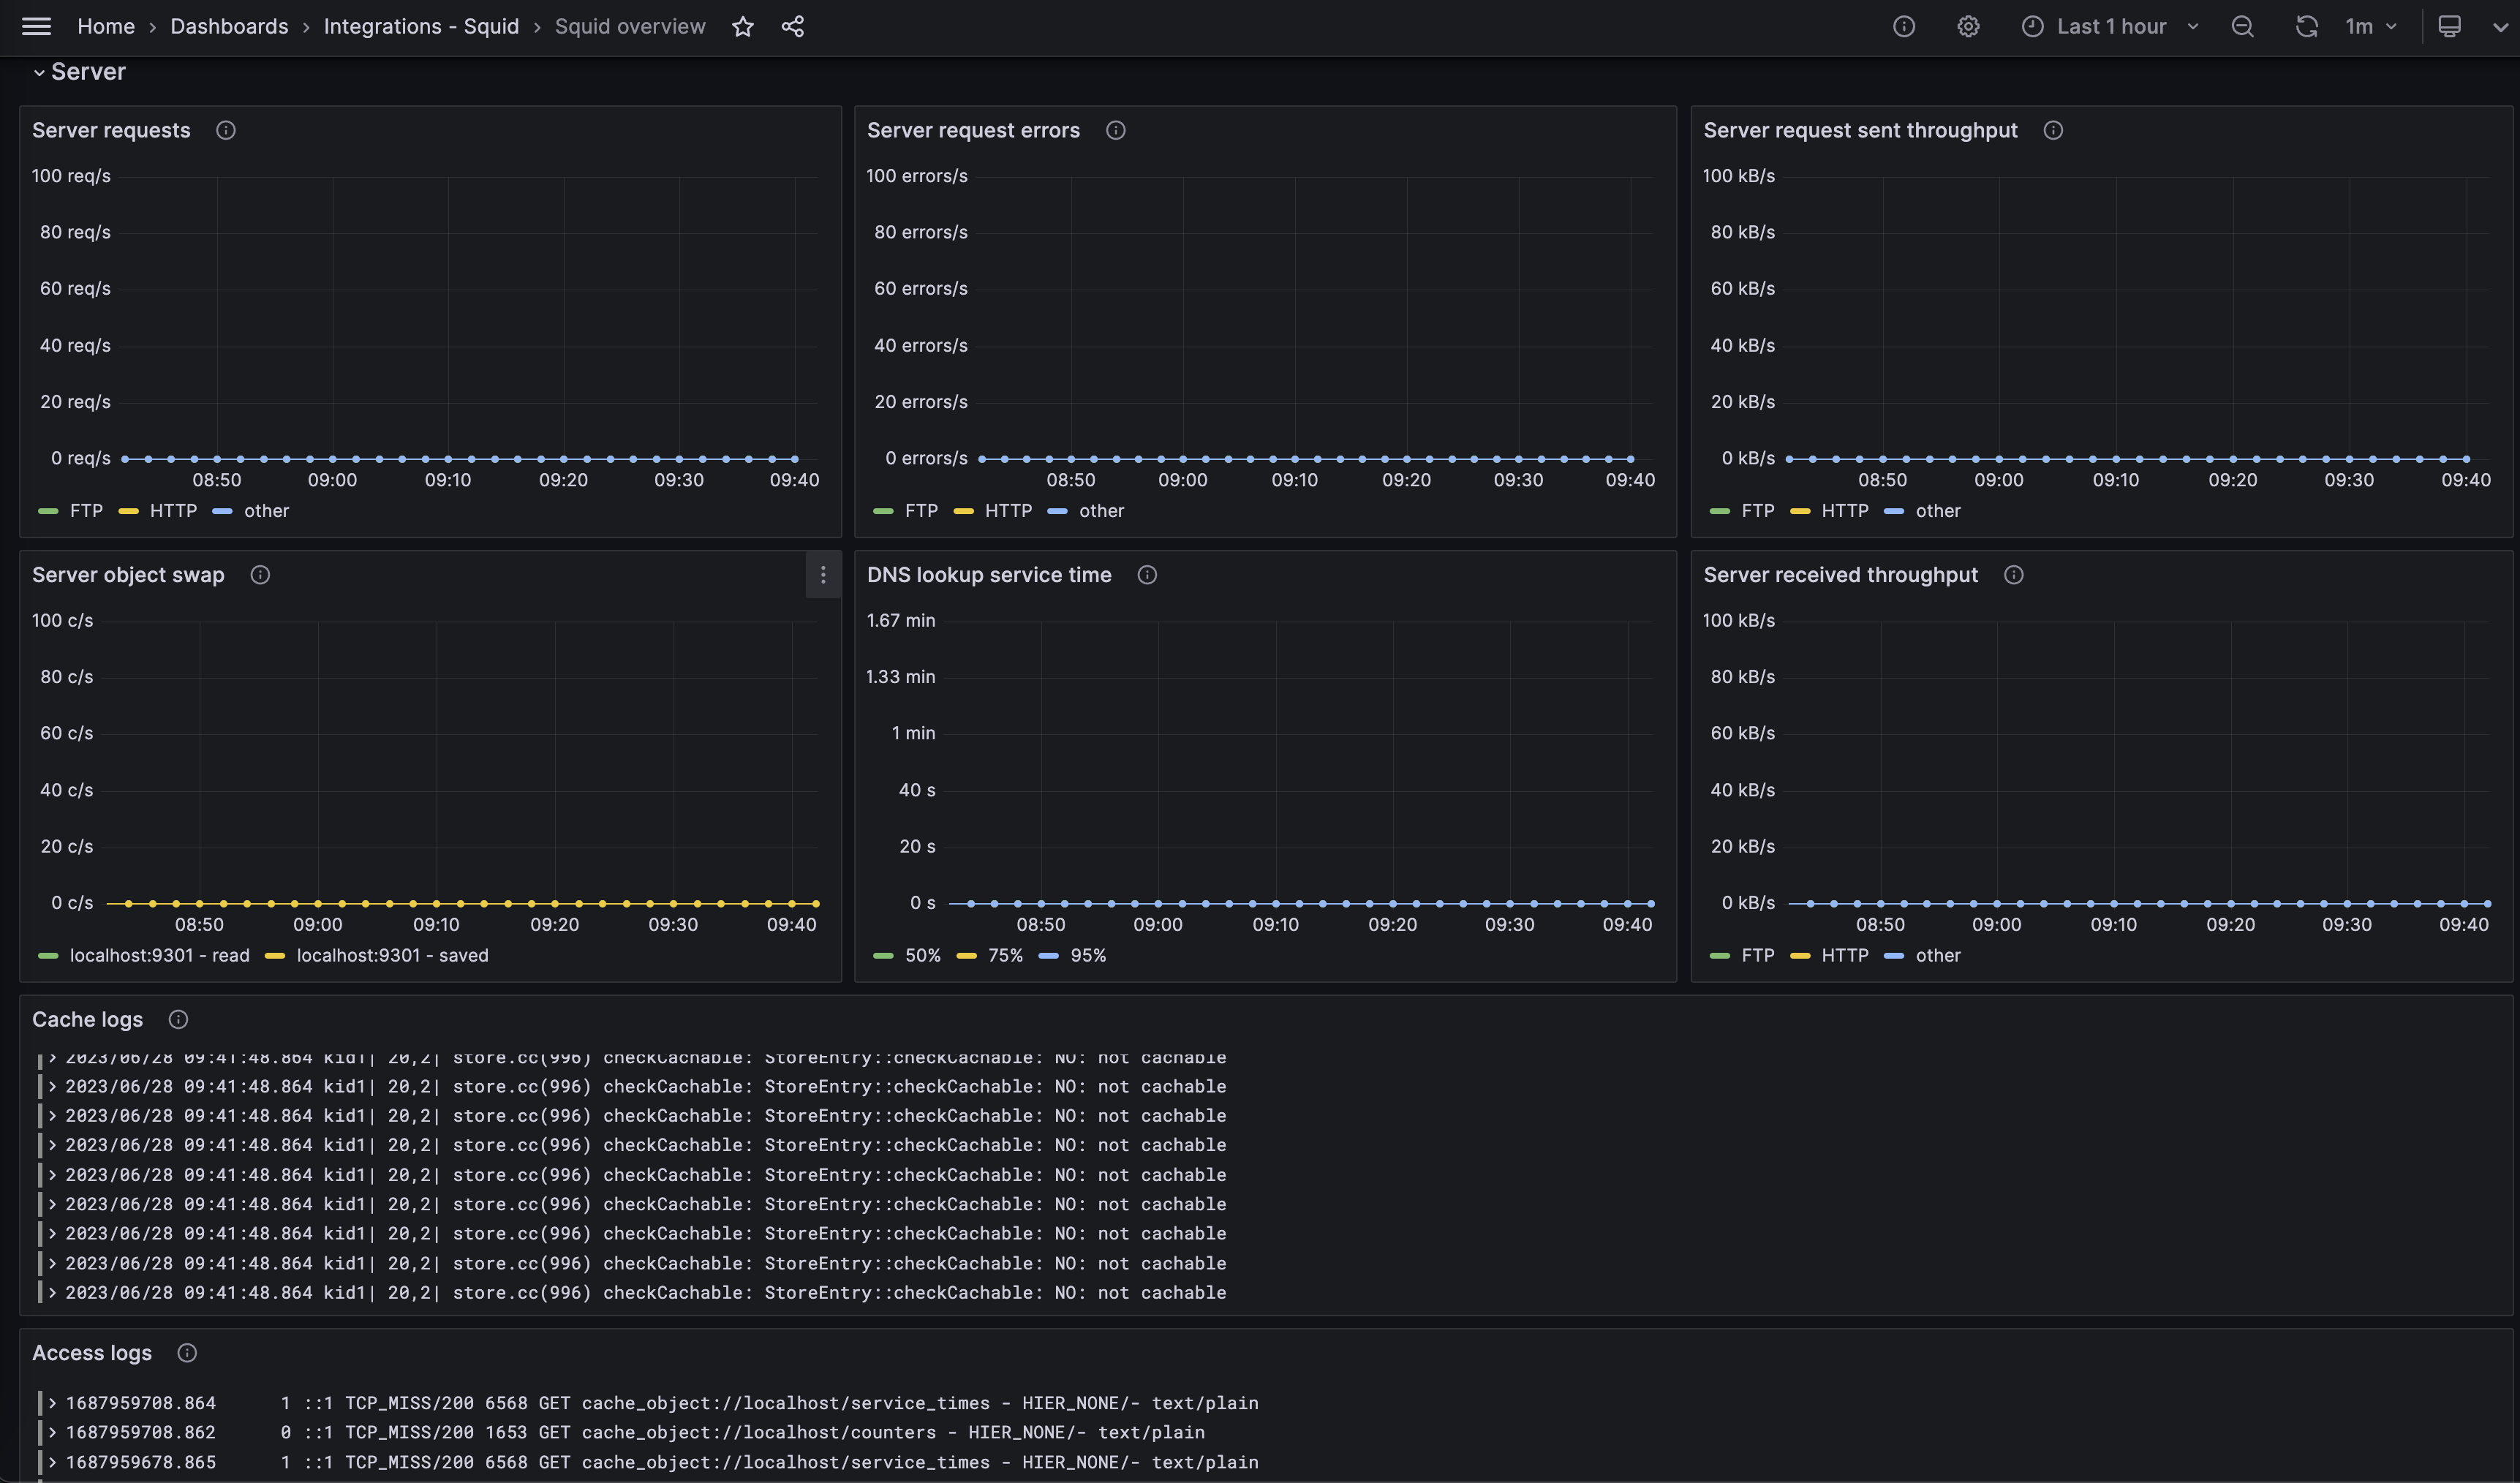
The Squid integration installs the following dashboards in your Grafana Cloud instance to help monitor your system.
- Squid overview
Squid overview dashboard (client)
Squid overview dashboard (server)
Alerts
The Squid integration includes the following useful alerts:
| Alert | Description |
|---|---|
| SquidHighPercentageOfHTTPServerRequestErrors | Critical: There are a high number of HTTP server errors. |
| SquidHighPercentageOfFTPServerRequestErrors | Critical: There are a high number of FTP server request errors. |
| SquidHighPercentageOfOtherServerRequestErrors | Critical: There are a high number of other server request errors. |
| SquidHighPercentageOfClientRequestErrors | Critical: There are a high number of HTTP client request errors. |
| SquidLowCacheHitRatio | Warning: The cache hit ratio has fallen below the configured threshold (%). |
Metrics
The most important metrics provided by the Squid integration, which are used on the pre-built dashboard and Prometheus alerts, are as follows:
- squid_Cache_Hits_50
- squid_Cache_Hits_75
- squid_Cache_Hits_95
- squid_Cache_Misses_50
- squid_Cache_Misses_75
- squid_Cache_Misses_95
- squid_DNS_Lookups_50
- squid_DNS_Lookups_75
- squid_DNS_Lookups_95
- squid_HTTP_Requests_All_50
- squid_HTTP_Requests_All_75
- squid_HTTP_Requests_All_95
- squid_client_http_errors_total
- squid_client_http_hit_kbytes_out_bytes_total
- squid_client_http_hits_total
- squid_client_http_kbytes_in_kbytes_total
- squid_client_http_kbytes_out_kbytes_total
- squid_client_http_requests_total
- squid_server_ftp_errors_total
- squid_server_ftp_kbytes_in_kbytes_total
- squid_server_ftp_kbytes_out_kbytes_total
- squid_server_ftp_requests_total
- squid_server_http_errors_total
- squid_server_http_kbytes_in_kbytes_total
- squid_server_http_kbytes_out_kbytes_total
- squid_server_http_requests_total
- squid_server_other_errors_total
- squid_server_other_kbytes_in_kbytes_total
- squid_server_other_kbytes_out_kbytes_total
- squid_server_other_requests_total
- squid_swap_ins_total
- squid_swap_outs_total
- up
Changelog
# 0.0.3 - September 2023

* New Filter Metrics option for configuring the Grafana Agent, which saves on metrics cost by dropping any metric not used by this integration. Beware that anything custom built using metrics that are not on the snippet will stop working.
* New hostname relabel option, which applies the instance name you write on the text box to the Grafana Agent configuration snippets, making it easier and less error prone to configure this mandatory label.

# 0.0.2 - August 2023

* Add regex filter for logs datasource

# 0.0.1 - July 2023

* Initial Release
Cost
By connecting your Squid instance to Grafana Cloud, you might incur charges. To view information on the number of active series that your Grafana Cloud account uses for metrics included in each Cloud tier, see Active series and dpm usage and Cloud tier pricing.
Was this page helpful?
Related resources from Grafana Labs


