
SNMP integration for Grafana Cloud
The SNMP integration lets you monitor any generic SNMP (Simple Network Management Protocol) device.
This integration includes 2 useful alerts and 1 pre-built dashboard to help monitor and visualize SNMP metrics.
Before you begin
The device you are monitoring must support reporting device data through SNMP protocol.
The instructions for enabling SNMP vary for each device. The SNMP daemon can also be installed on any linux device. Once SNMP is enabled for the device, install Grafana Alloy where it can access the SNMP device on SNMP ports UDP/TCP 161 and 162 using the instructions given below.
Install SNMP integration for Grafana Cloud
- In your Grafana Cloud stack, click Connections in the left-hand menu.
- Find SNMP and click its tile to open the integration.
- Review the prerequisites in the Configuration Details tab and set up Grafana Agent to send SNMP metrics to your Grafana Cloud instance.
- Click Install to add this integration’s pre-built dashboard and alerts to your Grafana Cloud instance, and you can start monitoring your SNMP setup.
Configuration snippets for Grafana Alloy
Advanced mode
To instruct Grafana Alloy to scrape your snmp target, go through the subsequent instructions.
The snippets provide examples to guide you through the configuration process.
First, manually copy and append the following snippets into your Grafana Alloy configuration file.
Then follow the instructions below to modify the necessary variables.
Advanced integrations snippets
prometheus.exporter.snmp "integrations_snmp" {
    target "network_switch_1" {
        address = "<host_address_1>"
        module  = "if_mib"
        auth    = "public_v2"
    }
    target "network_switch_2" {
        address = "<host_address_2>"
        module  = "if_mib"
        auth    = "public_v2"
    }
}
discovery.relabel "integrations_snmp" {
    targets = prometheus.exporter.snmp.integrations_snmp.targets

    rule {
        source_labels = ["job"]
        regex         = "(^.*snmp)\\/(.*)"
        target_label  = "job_snmp"
    }

    rule {
        source_labels = ["job"]
        regex         = "(^.*snmp)\\/(.*)"
        target_label  = "snmp_target"
        replacement   = "$2"
    }
}
prometheus.scrape "integrations_snmp" {
    targets    = discovery.relabel.integrations_snmp.output
    forward_to = [prometheus.remote_write.metrics_service.receiver]
    job_name   = "integrations/snmp"
}
Add a pair of prometheus.exporter.snmp and discovery.relabel to your Grafana Alloy configuration to monitor snmp device.
For ease of use, the provided snippets sets the instance label to the hostname using the constants.hostname Agent Flow constant variable.
If you want to monitor more than one snmp device running within the same host, set a different value for each one of them to avoid instance label conflicts.
You will also need add an snmp target in the snmp_targets properties within prometheus.exporter.snmp for each target.
There is an array of options available within this component, like setting using custom snmp modules, using built in modules, setting custom walk and auth parameters.
Refer to prometheus.exporter.snmp in Grafana Alloy reference documentation for a complete description of the configuration options.
Grafana Agent static configuration (deprecated)
The following section shows configuration for running Grafana Agent in static mode which is deprecated. You should use Grafana Alloy for all new deployments.
Before you begin
The device you are monitoring must support reporting device data through SNMP protocol.
The instructions for enabling SNMP vary for each device. The SNMP daemon can also be installed on any linux device. Once SNMP is enabled for the device, install the Grafana agent where it can access the SNMP device on SNMP ports UDP/TCP 161 and 162 using the instructions given below.
Install SNMP integration for Grafana Cloud
- In your Grafana Cloud stack, click Connections in the left-hand menu.
- Find SNMP and click its tile to open the integration.
- Review the prerequisites in the Configuration Details tab and set up Grafana Agent to send SNMP metrics to your Grafana Cloud instance.
- Click Install to add this integration’s pre-built dashboard and alerts to your Grafana Cloud instance, and you can start monitoring your SNMP setup.
Post-install configuration for the SNMP integration
This integration is configured to work with the snmp_exporter, which is embedded in Grafana Agent.
Enable the integration by adding the provided snippets to your agent configuration file.
Replace the <host_address_*> tags with the addresses of the relevant SNMP devices. Also configure the walk params according to your configuration.
For a full description of configuration options see how to configure the snmp block in the agent documentation.
Configuration snippets for Grafana Agent
Below integrations, insert the following lines and change the URLs according to your environment:
  snmp:
    enabled: true
    relabel_configs:
      - action: replace
        source_labels: [job]
        regex: (^.*snmp)\/(.*)
        target_label: job_snmp
        replacement: $1
      - action: replace
        source_labels: [job]
        regex: (^.*snmp)\/(.*)
        target_label: snmp_target
        replacement: $2
    snmp_targets:
      - name: network_switch_1
        address: '<host_address_1>'
        module: if_mib
        auth: public_v2
      - name: network_switch_2
        address: '<host_address_2>'
        module: if_mib
        auth: public_v2
Full example configuration for Grafana Agent
Refer to the following Grafana Agent configuration for a complete example that contains all the snippets used for the SNMP integration. This example also includes metrics that are sent to monitor your Grafana Agent instance.
integrations:
  prometheus_remote_write:
  - basic_auth:
      password: <your_prom_pass>
      username: <your_prom_user>
    url: <your_prom_url>
  agent:
    enabled: true
    relabel_configs:
    - action: replace
      source_labels:
      - agent_hostname
      target_label: instance
    - action: replace
      target_label: job
      replacement: "integrations/agent-check"
    metric_relabel_configs:
    - action: keep
      regex: (prometheus_target_sync_length_seconds_sum|prometheus_target_scrapes_.*|prometheus_target_interval.*|prometheus_sd_discovered_targets|agent_build.*|agent_wal_samples_appended_total|process_start_time_seconds)
      source_labels:
      - __name__
  # Add here any snippet that belongs to the `integrations` section.
  # For a correct indentation, paste snippets copied from Grafana Cloud at the beginning of the line.
  snmp:
    enabled: true
    relabel_configs:
      - action: replace
        source_labels: [job]
        regex: (^.*snmp)\/(.*)
        target_label: job_snmp
        replacement: $1
      - action: replace
        source_labels: [job]
        regex: (^.*snmp)\/(.*)
        target_label: snmp_target
        replacement: $2
    snmp_targets:
      - name: network_switch_1
        address: '<host_address_1>'
        module: if_mib
        auth: public_v2
      - name: network_switch_2
        address: '<host_address_2>'
        module: if_mib
        auth: public_v2
logs:
  configs:
  - clients:
    - basic_auth:
        password: <your_loki_pass>
        username: <your_loki_user>
      url: <your_loki_url>
    name: integrations
    positions:
      filename: /tmp/positions.yaml
    scrape_configs:
      # Add here any snippet that belongs to the `logs.configs.scrape_configs` section.
      # For a correct indentation, paste snippets copied from Grafana Cloud at the beginning of the line.
metrics:
  configs:
  - name: integrations
    remote_write:
    - basic_auth:
        password: <your_prom_pass>
        username: <your_prom_user>
      url: <your_prom_url>
    scrape_configs:
      # Add here any snippet that belongs to the `metrics.configs.scrape_configs` section.
      # For a correct indentation, paste snippets copied from Grafana Cloud at the beginning of the line.
  global:
    scrape_interval: 60s
  wal_directory: /tmp/grafana-agent-wal
Dashboards
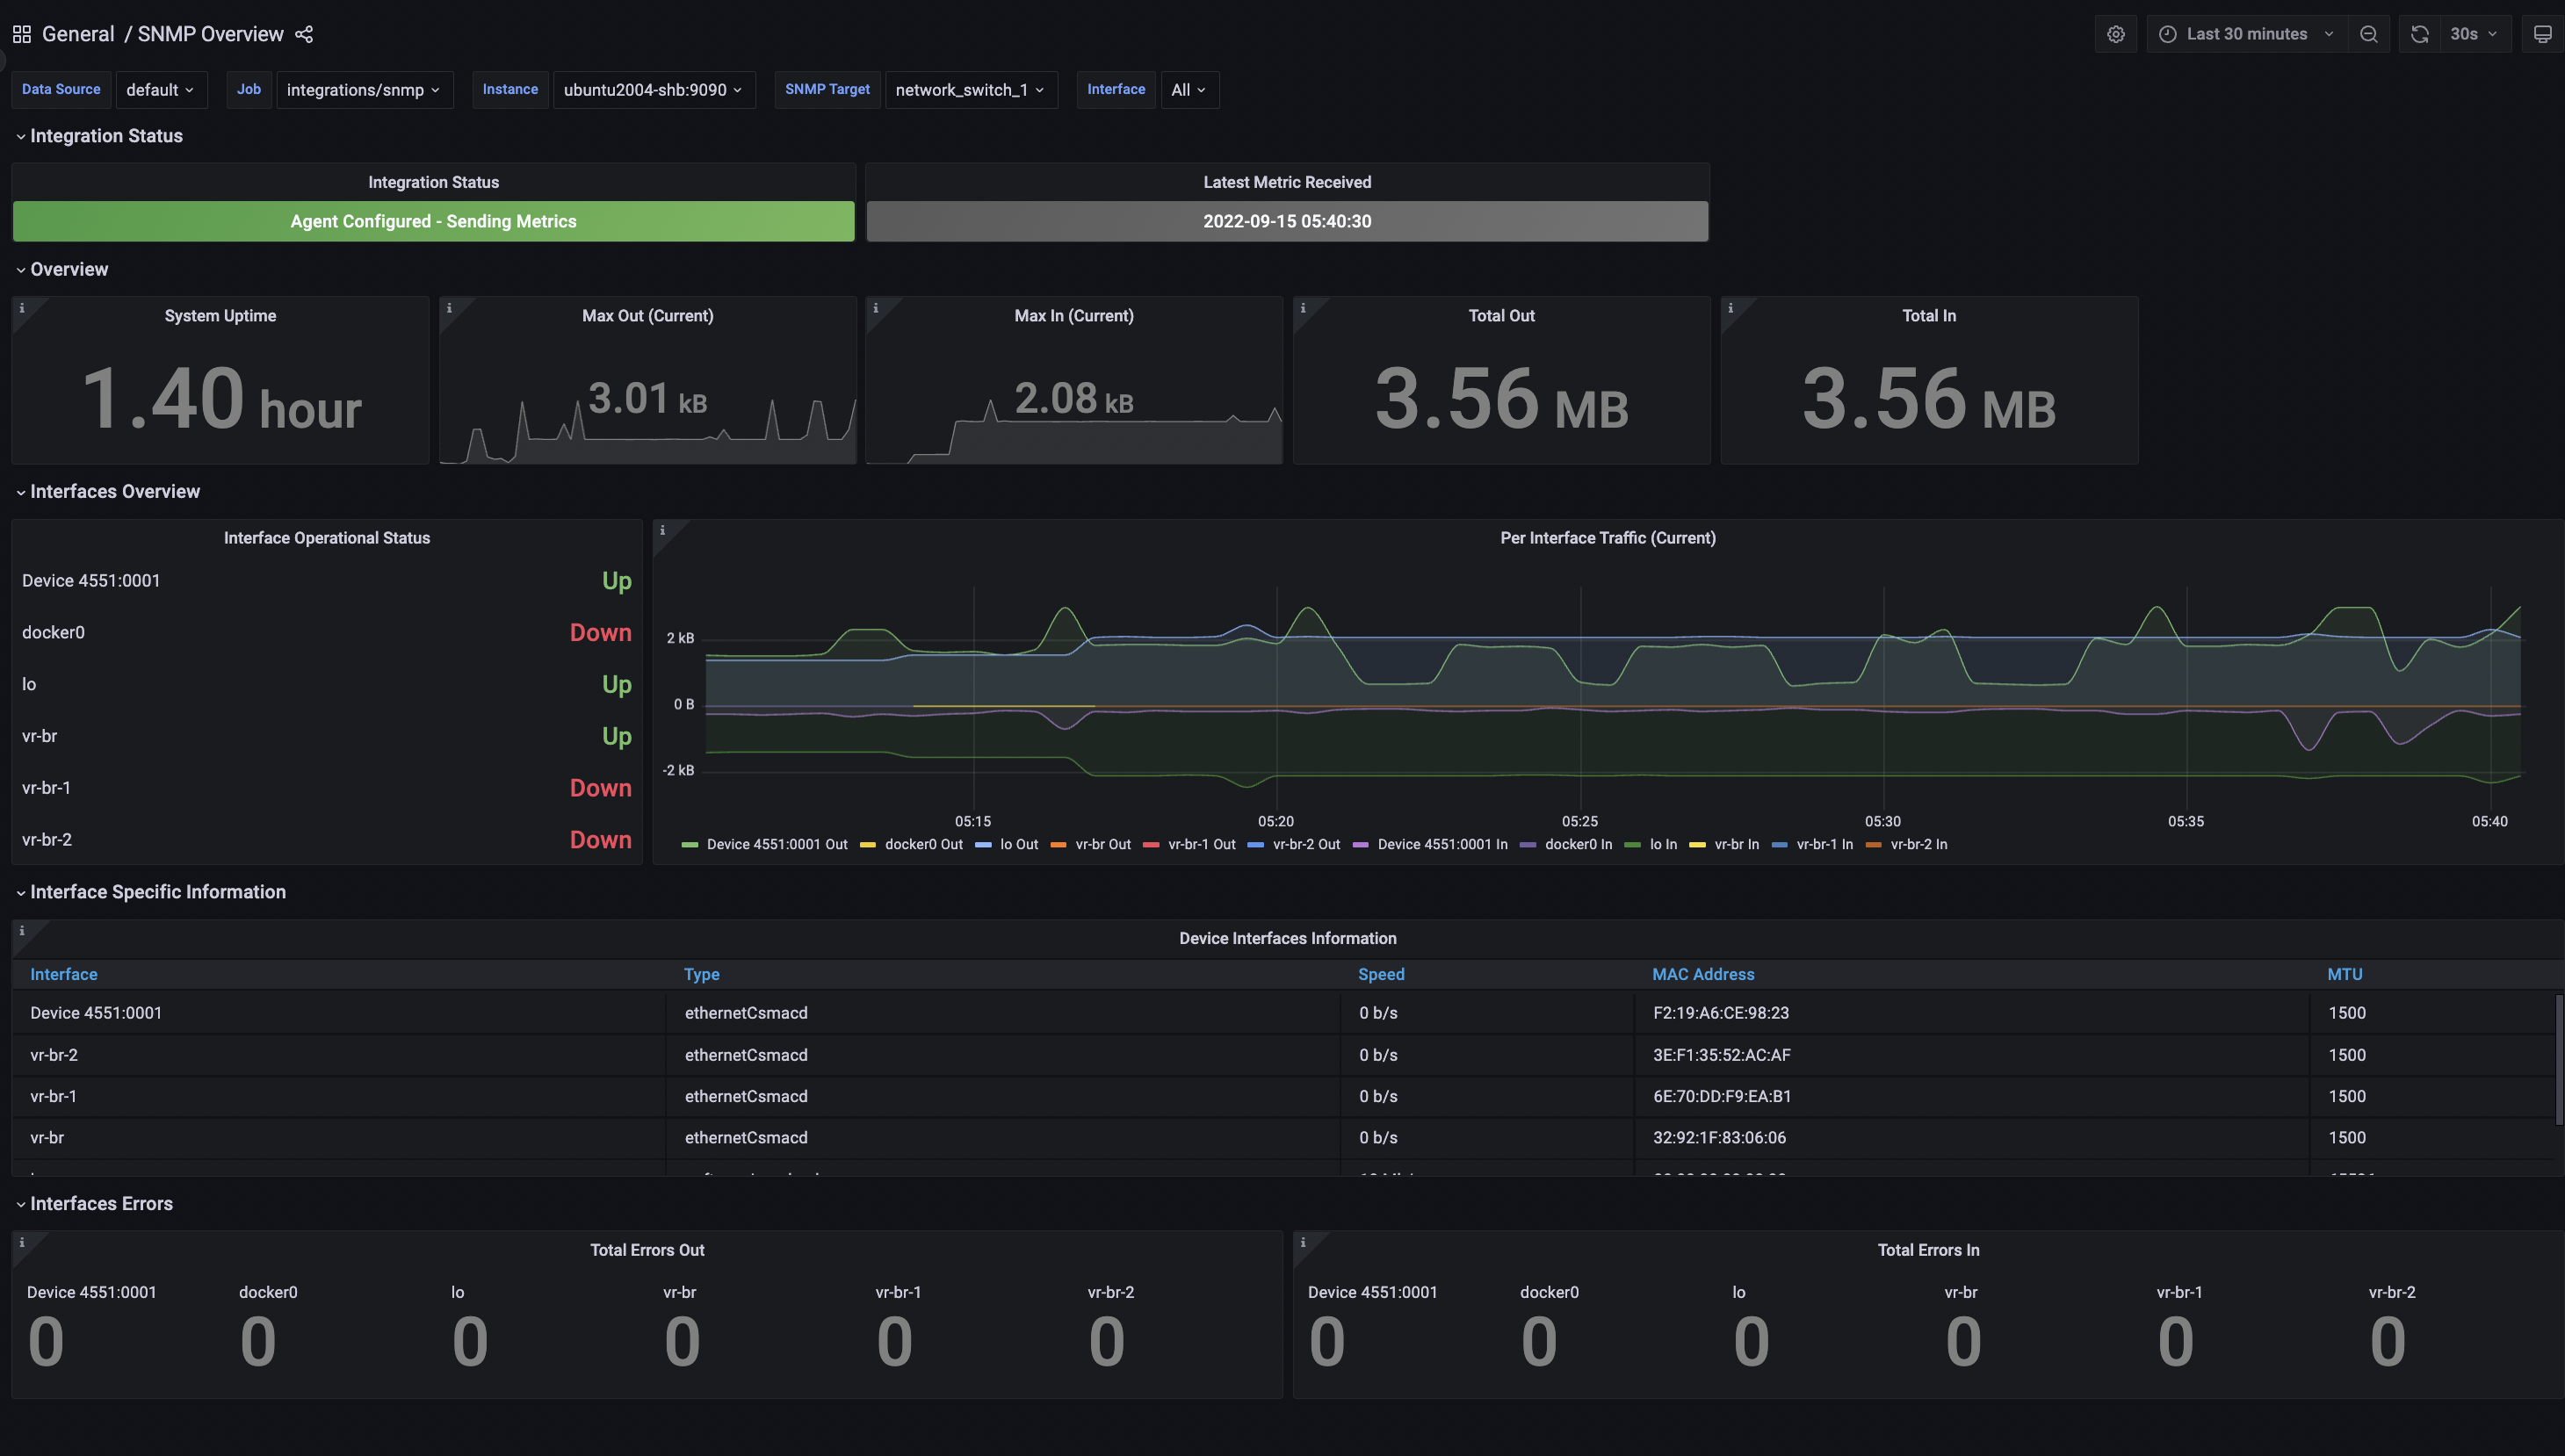
The SNMP integration installs the following dashboards in your Grafana Cloud instance to help monitor your system.
- SNMP Overview
SNMP Overview
Alerts
The SNMP integration includes the following useful alerts:
| Alert | Description |
|---|---|
| SNMPTargetDown | Critical: SNMP Target is down. |
| SNMPTargetInterfaceDown | Warning: Network interface on SNMP target is down. |
Metrics
The most important metrics provided by the SNMP integration, which are used on the pre-built dashboard and Prometheus alerts, are as follows:
- ifHCInOctets
- ifHCOutOctets
- ifInErrors
- ifMtu
- ifOperStatus
- ifOutErrors
- ifPhysAddress
- ifSpeed
- ifType_info
- snmp_scrape_duration_seconds
- sysUpTime
- up
Changelog
# 1.0.0 - January 2024

* Fix out of date angular panel

# 0.0.3 - September 2023

* New Filter Metrics option for configuring the Grafana Agent, which saves on metrics cost by dropping any metric not used by this integration. Beware that anything custom built using metrics that are not on the snippet will stop working.

# 0.0.2 - November 2022

* Add integration status panel

# 0.0.1 - September 2022

* Initial release
Cost
By connecting your SNMP instance to Grafana Cloud, you might incur charges. To view information on the number of active series that your Grafana Cloud account uses for metrics included in each Cloud tier, see Active series and dpm usage and Cloud tier pricing.
Was this page helpful?
Related resources from Grafana Labs


