
SAP HANA® integration for Grafana Cloud
SAP HANA is an enterprise in-memory database designed to process large volumes of data in real time. This integration for Grafana Cloud allows users to collect metrics and trace logs for monitoring an SAP HANA system.
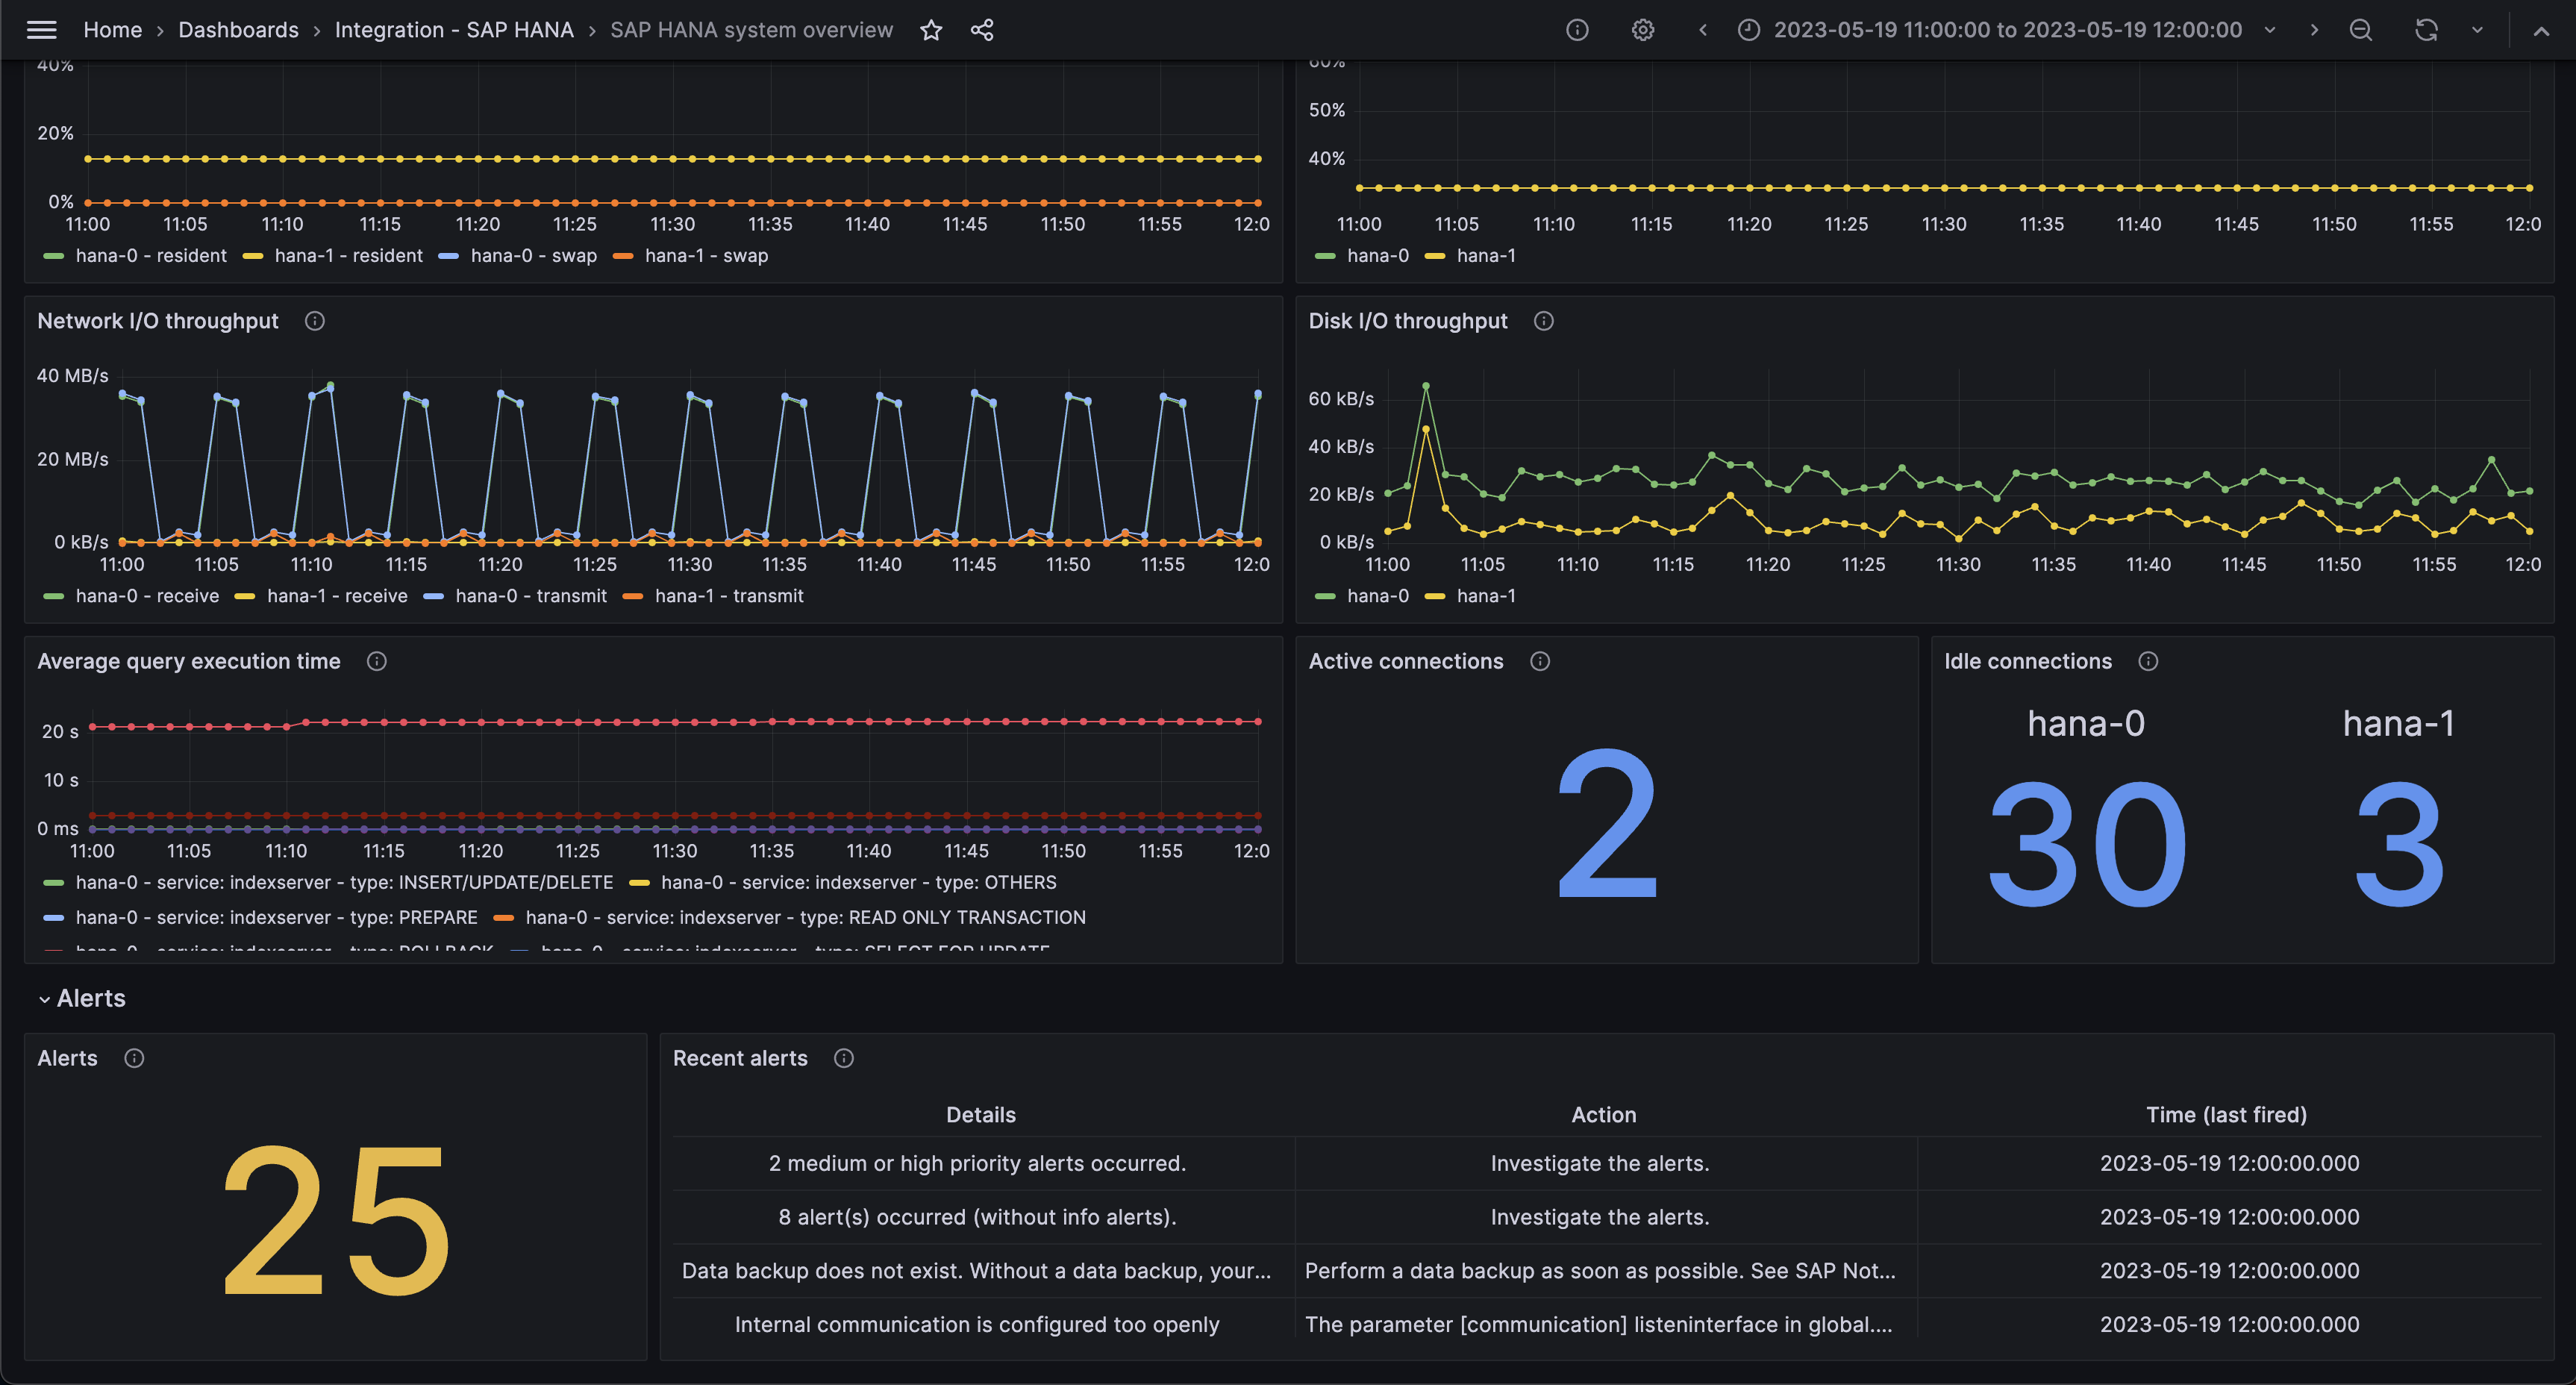
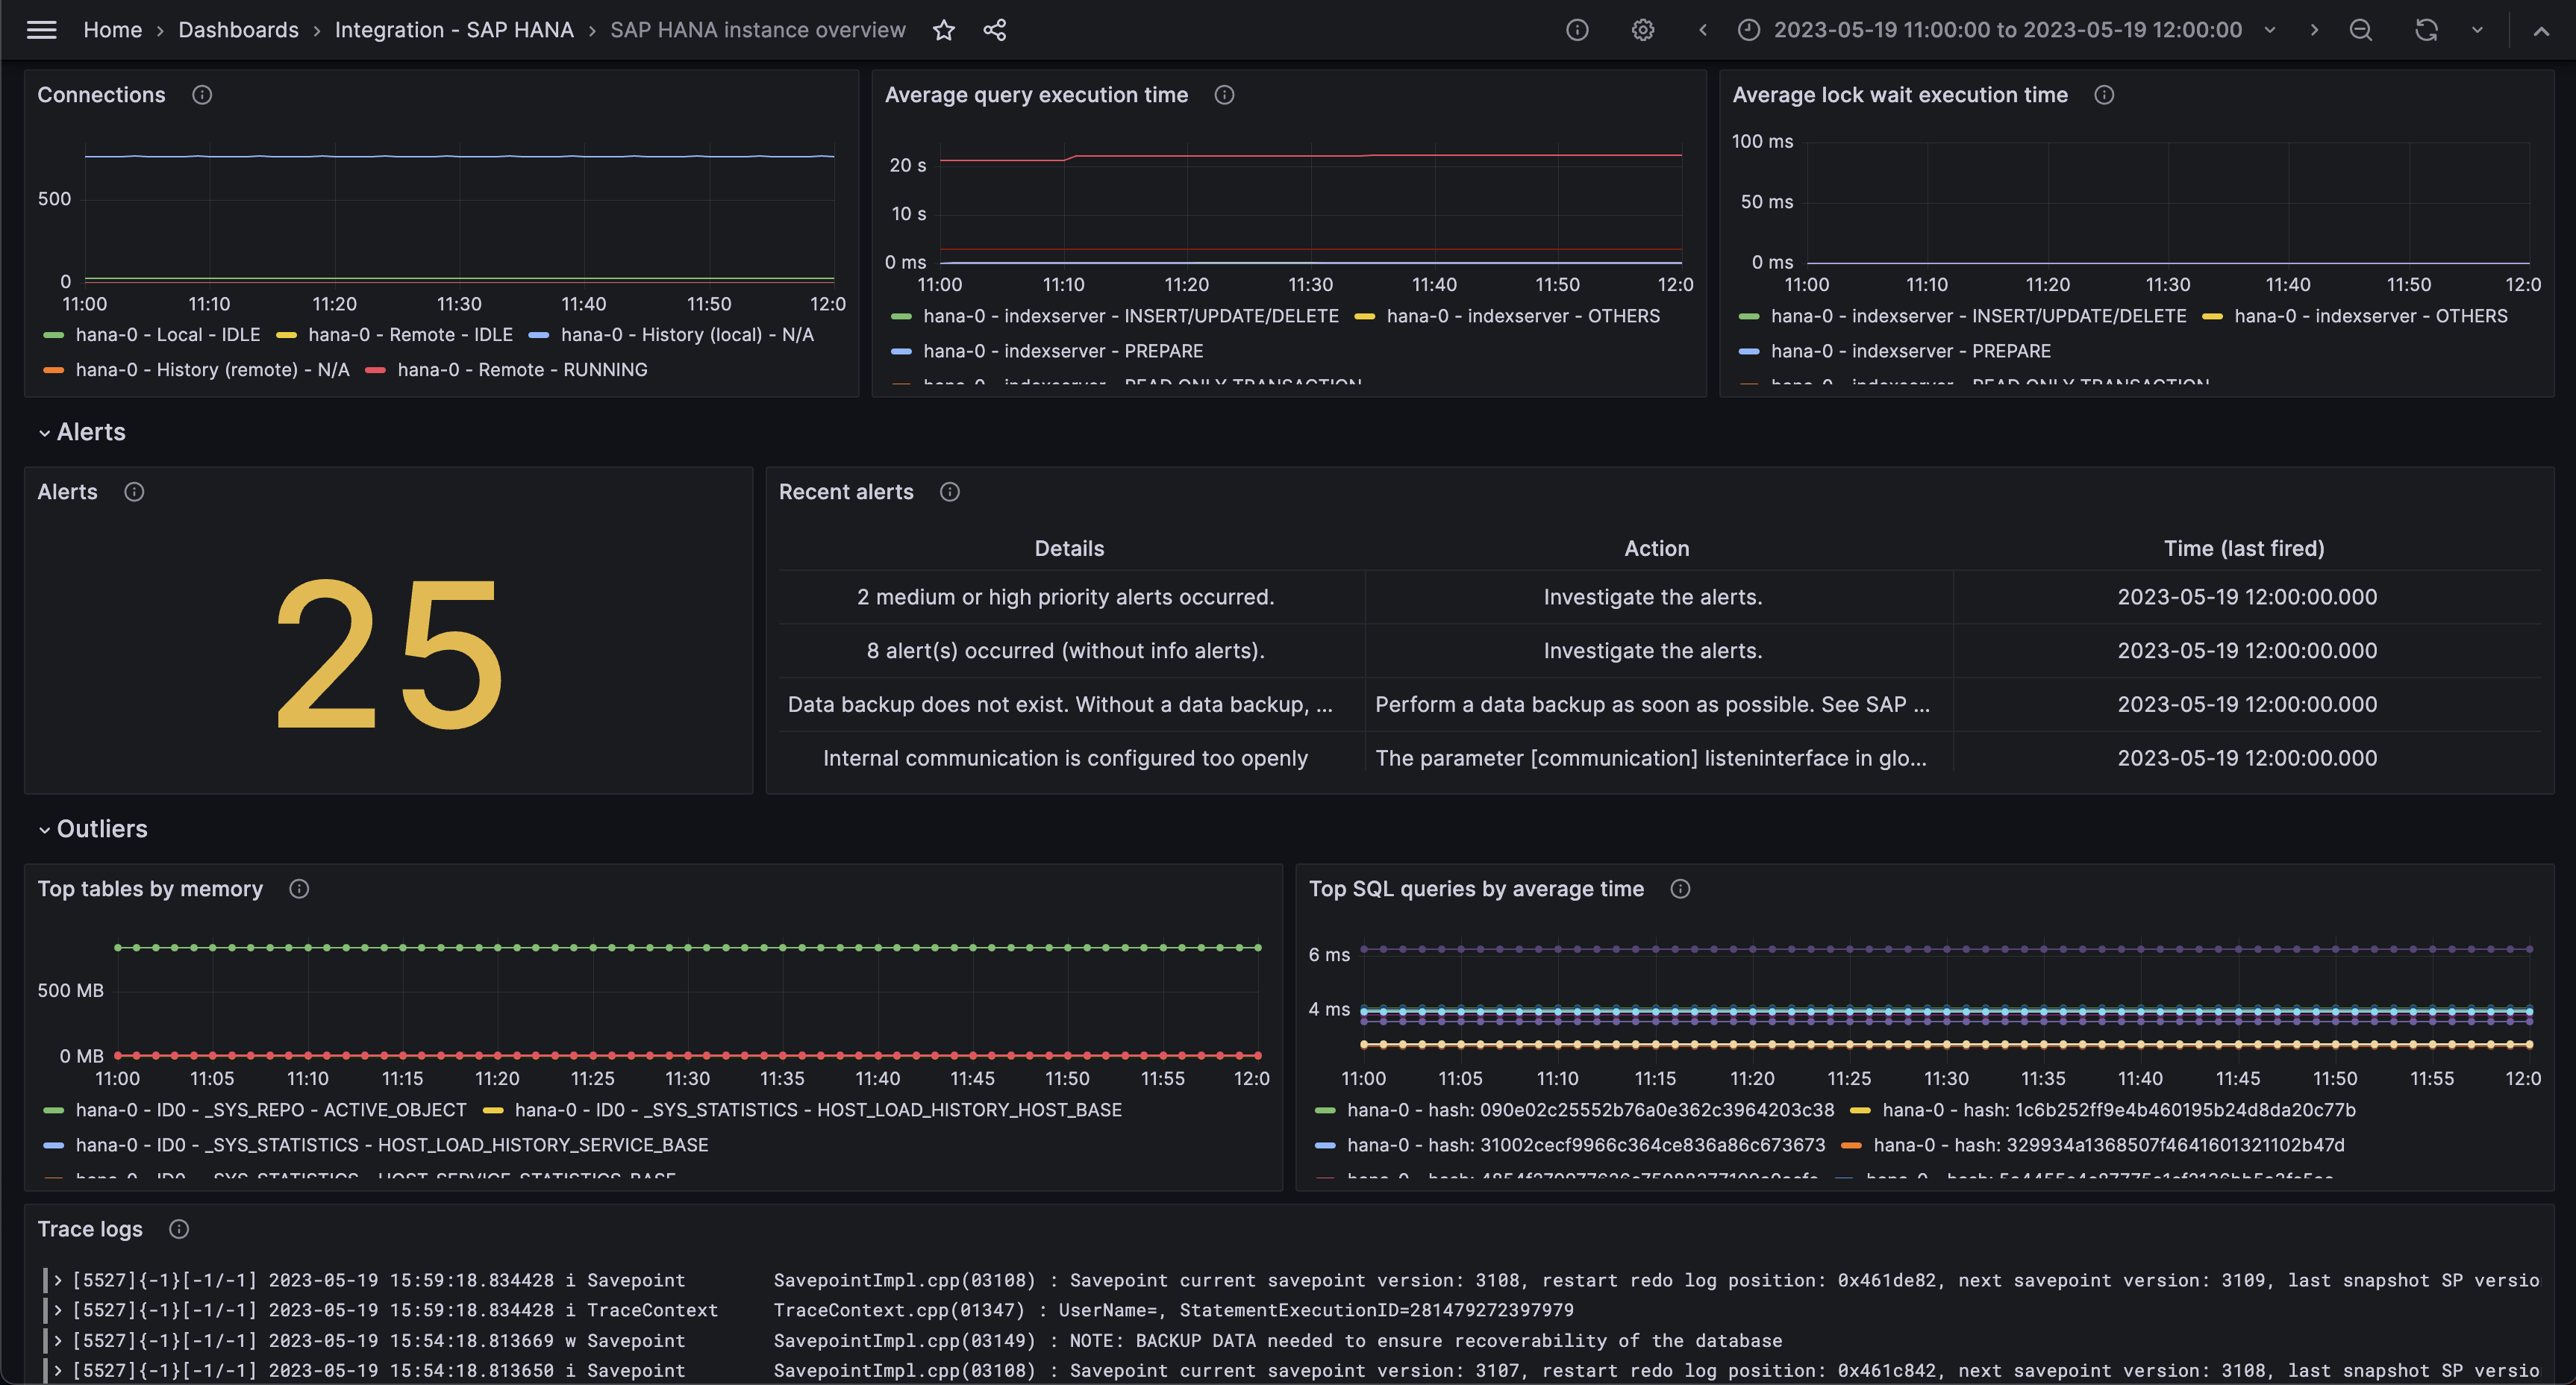
Metrics include CPU usage by core, disk and memory usage, network and disk throughput, average query execution time, connections, alerts, replica status and ship delay. Visualizations for the system and for individual hosts are included.
This integration supports SAP HANA 2.0 SPS06+
This integration supports the SUSE/hanadb_exporter 0.8.0+
SAP HANA is the trademark or registered trademark of SAP SE or its affiliates in Germany and in other countries.
This integration includes 8 useful alerts and 2 pre-built dashboards to help monitor and visualize SAP HANA® metrics and logs.
Before you begin
In order for the integration to work properly, you must set up the SUSE hanadb exporter on your primary host.
Using the example config, metrics will be available on port 9668 by default.
Once deployed, Grafana Alloy will be able to scrape the endpoint.
Install SAP HANA® integration for Grafana Cloud
- In your Grafana Cloud stack, click Connections in the left-hand menu.
- Find SAP HANA® and click its tile to open the integration.
- Review the prerequisites in the Configuration Details tab and set up Grafana Agent to send SAP HANA® metrics and logs to your Grafana Cloud instance.
- Click Install to add this integration’s pre-built dashboards and alerts to your Grafana Cloud instance, and you can start monitoring your SAP HANA® setup.
Configuration snippets for Grafana Alloy
Simple mode
These snippets are configured to scrape a single SAP HANA® instance running locally with default ports.
First, manually copy and append the following snippets into your alloy configuration file.
Metrics snippets
discovery.relabel "metrics_integrations_integrations_sap_hana" {
	targets = [{
		__address__ = "localhost:9668",
	}]

	rule {
		target_label = "instance"
		replacement  = constants.hostname
	}
}

prometheus.scrape "metrics_integrations_integrations_sap_hana" {
	targets      = discovery.relabel.metrics_integrations_integrations_sap_hana.output
	forward_to   = [prometheus.remote_write.metrics_service.receiver]
	job_name     = "integrations/sap-hana"
	metrics_path = "/"
}
Logs snippets
linux
local.file_match "logs_integrations_integrations_sap_hana" {
	path_targets = [{
		__address__ = "localhost",
		__path__    = "/opt/hana/shared/*/HDB*/*/trace/*.trc",
		instance    = constants.hostname,
	}]
}

loki.source.file "logs_integrations_integrations_sap_hana" {
	targets    = local.file_match.logs_integrations_integrations_sap_hana.targets
	forward_to = [loki.write.grafana_cloud_loki.receiver]
}
Advanced mode
The following snippets provide examples to guide you through the configuration process.
To instruct Grafana Alloy to scrape your SAP HANA® instances, manually copy and append the snippets to your alloy configuration file, then follow subsequent instructions.
Advanced metrics snippets
discovery.relabel "metrics_integrations_integrations_sap_hana" {
	targets = [{
		__address__ = "localhost:9668",
	}]

	rule {
		target_label = "instance"
		replacement  = constants.hostname
	}
}

prometheus.scrape "metrics_integrations_integrations_sap_hana" {
	targets      = discovery.relabel.metrics_integrations_integrations_sap_hana.output
	forward_to   = [prometheus.remote_write.metrics_service.receiver]
	job_name     = "integrations/sap-hana"
	metrics_path = "/"
}
To monitor your SAP HANA® instance, you must use a discovery.relabel component to discover your SAP HANA® Prometheus endpoint and apply appropriate labels, followed by a prometheus.scrape component to scrape it.
Configure the following properties within each discovery.relabel component:
__address__: The address to your SAP HANA® Prometheus metrics endpoint.instancelabel:constants.hostnamesets theinstancelabel to your Grafana Alloy server hostname. If that is not suitable, change it to a value uniquely identifies this SAP HANA® instance. Make sure this label value is the same for all telemetry data collected for this instance.
If you have multiple SAP HANA® servers to scrape, configure one discovery.relabel for each and scrape them by including each under targets within the prometheus.scrape component.
Advanced logs snippets
linux
local.file_match "logs_integrations_integrations_sap_hana" {
	path_targets = [{
		__address__ = "localhost",
		__path__    = "/opt/hana/shared/*/HDB*/*/trace/*.trc",
		instance    = constants.hostname,
	}]
}

loki.source.file "logs_integrations_integrations_sap_hana" {
	targets    = local.file_match.logs_integrations_integrations_sap_hana.targets
	forward_to = [loki.write.grafana_cloud_loki.receiver]
}
To monitor your SAP HANA® instance logs, you will use a combination of the following components:
local.file_match defines where to find the log file to be scraped. Change the following properties according to your environment:
__address__: The SAP HANA® instance address__path__: Select which trace files you would like to include with a path like.../trace/{filename.trc, nameserver*.trc, ...}. You can also set__path_exclude__patterns.instancelabel:constants.hostnamesets theinstancelabel to your Grafana Alloy server hostname. If that is not suitable, change it to a value uniquely identifies this SAP HANA® instance. Make sure this label value is the same for all telemetry data collected for this instance.
loki.source.file sends logs to Loki.
On linux, you must add the alloy user to the sapsys group with sudo usermod -a -G sapsys alloy
Verify that the /opt/hana/shared/<sid>/HDB<insnr> directory has read permission for the sapsys group (with ls -la, or set with chmod g+r HDB<insnr>)
Ensure that the path from that directory to each trace log you are monitoring also has read permission set for the sapsys group
If you have issues with setting permissions, contact your system administrator or run the Grafana Agent as the root user.
Grafana Agent static configuration (deprecated)
The following section shows configuration for running Grafana Agent in static mode which is deprecated. You should use Grafana Alloy for all new deployments.
Before you begin
In order for the integration to work properly, you must set up the SUSE hanadb exporter on your primary host.
Using the example config, metrics will be available on port 9668 by default.
Once deployed, the Grafana Agent will be able to scrape the endpoint.
Install SAP HANA® integration for Grafana Cloud
- In your Grafana Cloud stack, click Connections in the left-hand menu.
- Find SAP HANA® and click its tile to open the integration.
- Review the prerequisites in the Configuration Details tab and set up Grafana Agent to send SAP HANA® metrics and logs to your Grafana Cloud instance.
- Click Install to add this integration’s pre-built dashboards and alerts to your Grafana Cloud instance, and you can start monitoring your SAP HANA® setup.
Post-install configuration for the SAP HANA® integration
After enabling the metrics generation, instruct the Grafana Agent to scrape your SAP HANA system.
Make sure to change targets in the snippet according to your environment.
Select which trace files you would like to include with a path like .../trace/{filename.trc, nameserver*.trc, ...} or add a __path_exclude__ label (documentation)
metrics:
  configs:
    - scrape_configs:
      - job_name: integrations/sap-hana
        metrics_path: "/"
        static_configs:
          - targets: ['<host-name>:<exporter-port>']
logs:
  configs:
    scrape_configs:
      - job_name: integrations/sap-hana
        static_configs:
          - targets: [localhost]
            labels:
              __path__: /opt/hana/shared/*/HDB*/*/trace/*.trc
You should ensure that the user you are running the Grafana Agent with has permissions to access your trace files.
To do this:
- The default user that the Grafana Agent runs with is
grafana-agent, you can change the user in/usr/lib/systemd/system/grafana-agent.service - For this change to take effect, run
sudo systemctl daemon-reloadandsudo systemctl restart grafana-agent - Add the
grafana-agentuser to thesapsysgroup withsudo usermod -a -G sapsys grafana-agent - Verify that the
/opt/hana/shared/<sid>/HDB<insnr>directory has read permission for thesapsysgroup (withls -la, or set withchmod g+r HDB<insnr>) - Ensure that the path from that directory to each trace log you are monitoring also has read permission set for the
sapsysgroup - If you have issues with setting permissions, contact your system administrator or run the Grafana Agent as the root user.
Configuration snippets for Grafana Agent
Below metrics.configs.scrape_configs, insert the following lines and change the URLs according to your environment:
    - job_name: integrations/sap-hana
      metrics_path: "/"
      relabel_configs:
        - replacement: '<your-instance-name>'
          target_label: instance
      static_configs:
        - targets: ['localhost:9668']
Below logs.configs.scrape_configs, insert the following lines according to your environment.
    - job_name: integrations/sap-hana
      static_configs:
        - targets: [localhost]
          labels:
            __path__: /opt/hana/shared/*/HDB*/*/trace/*.trc
            instance: '<your-instance-name>'
Full example configuration for Grafana Agent
Refer to the following Grafana Agent configuration for a complete example that contains all the snippets used for the SAP HANA® integration. This example also includes metrics that are sent to monitor your Grafana Agent instance.
integrations:
  prometheus_remote_write:
  - basic_auth:
      password: <your_prom_pass>
      username: <your_prom_user>
    url: <your_prom_url>
  agent:
    enabled: true
    relabel_configs:
    - action: replace
      source_labels:
      - agent_hostname
      target_label: instance
    - action: replace
      target_label: job
      replacement: "integrations/agent-check"
    metric_relabel_configs:
    - action: keep
      regex: (prometheus_target_sync_length_seconds_sum|prometheus_target_scrapes_.*|prometheus_target_interval.*|prometheus_sd_discovered_targets|agent_build.*|agent_wal_samples_appended_total|process_start_time_seconds)
      source_labels:
      - __name__
  # Add here any snippet that belongs to the `integrations` section.
  # For a correct indentation, paste snippets copied from Grafana Cloud at the beginning of the line.
logs:
  configs:
  - clients:
    - basic_auth:
        password: <your_loki_pass>
        username: <your_loki_user>
      url: <your_loki_url>
    name: integrations
    positions:
      filename: /tmp/positions.yaml
    scrape_configs:
      # Add here any snippet that belongs to the `logs.configs.scrape_configs` section.
      # For a correct indentation, paste snippets copied from Grafana Cloud at the beginning of the line.
    - job_name: integrations/sap-hana
      static_configs:
        - targets: [localhost]
          labels:
            __path__: /opt/hana/shared/*/HDB*/*/trace/*.trc
            instance: '<your-instance-name>'
metrics:
  configs:
  - name: integrations
    remote_write:
    - basic_auth:
        password: <your_prom_pass>
        username: <your_prom_user>
      url: <your_prom_url>
    scrape_configs:
      # Add here any snippet that belongs to the `metrics.configs.scrape_configs` section.
      # For a correct indentation, paste snippets copied from Grafana Cloud at the beginning of the line.
    - job_name: integrations/sap-hana
      metrics_path: "/"
      relabel_configs:
        - replacement: '<your-instance-name>'
          target_label: instance
      static_configs:
        - targets: ['localhost:9668']
  global:
    scrape_interval: 60s
  wal_directory: /tmp/grafana-agent-wal
Dashboards
The SAP HANA® integration installs the following dashboards in your Grafana Cloud instance to help monitor your system.
- SAP HANA instance overview
- SAP HANA system overview
SAP HANA system overview (replicas)
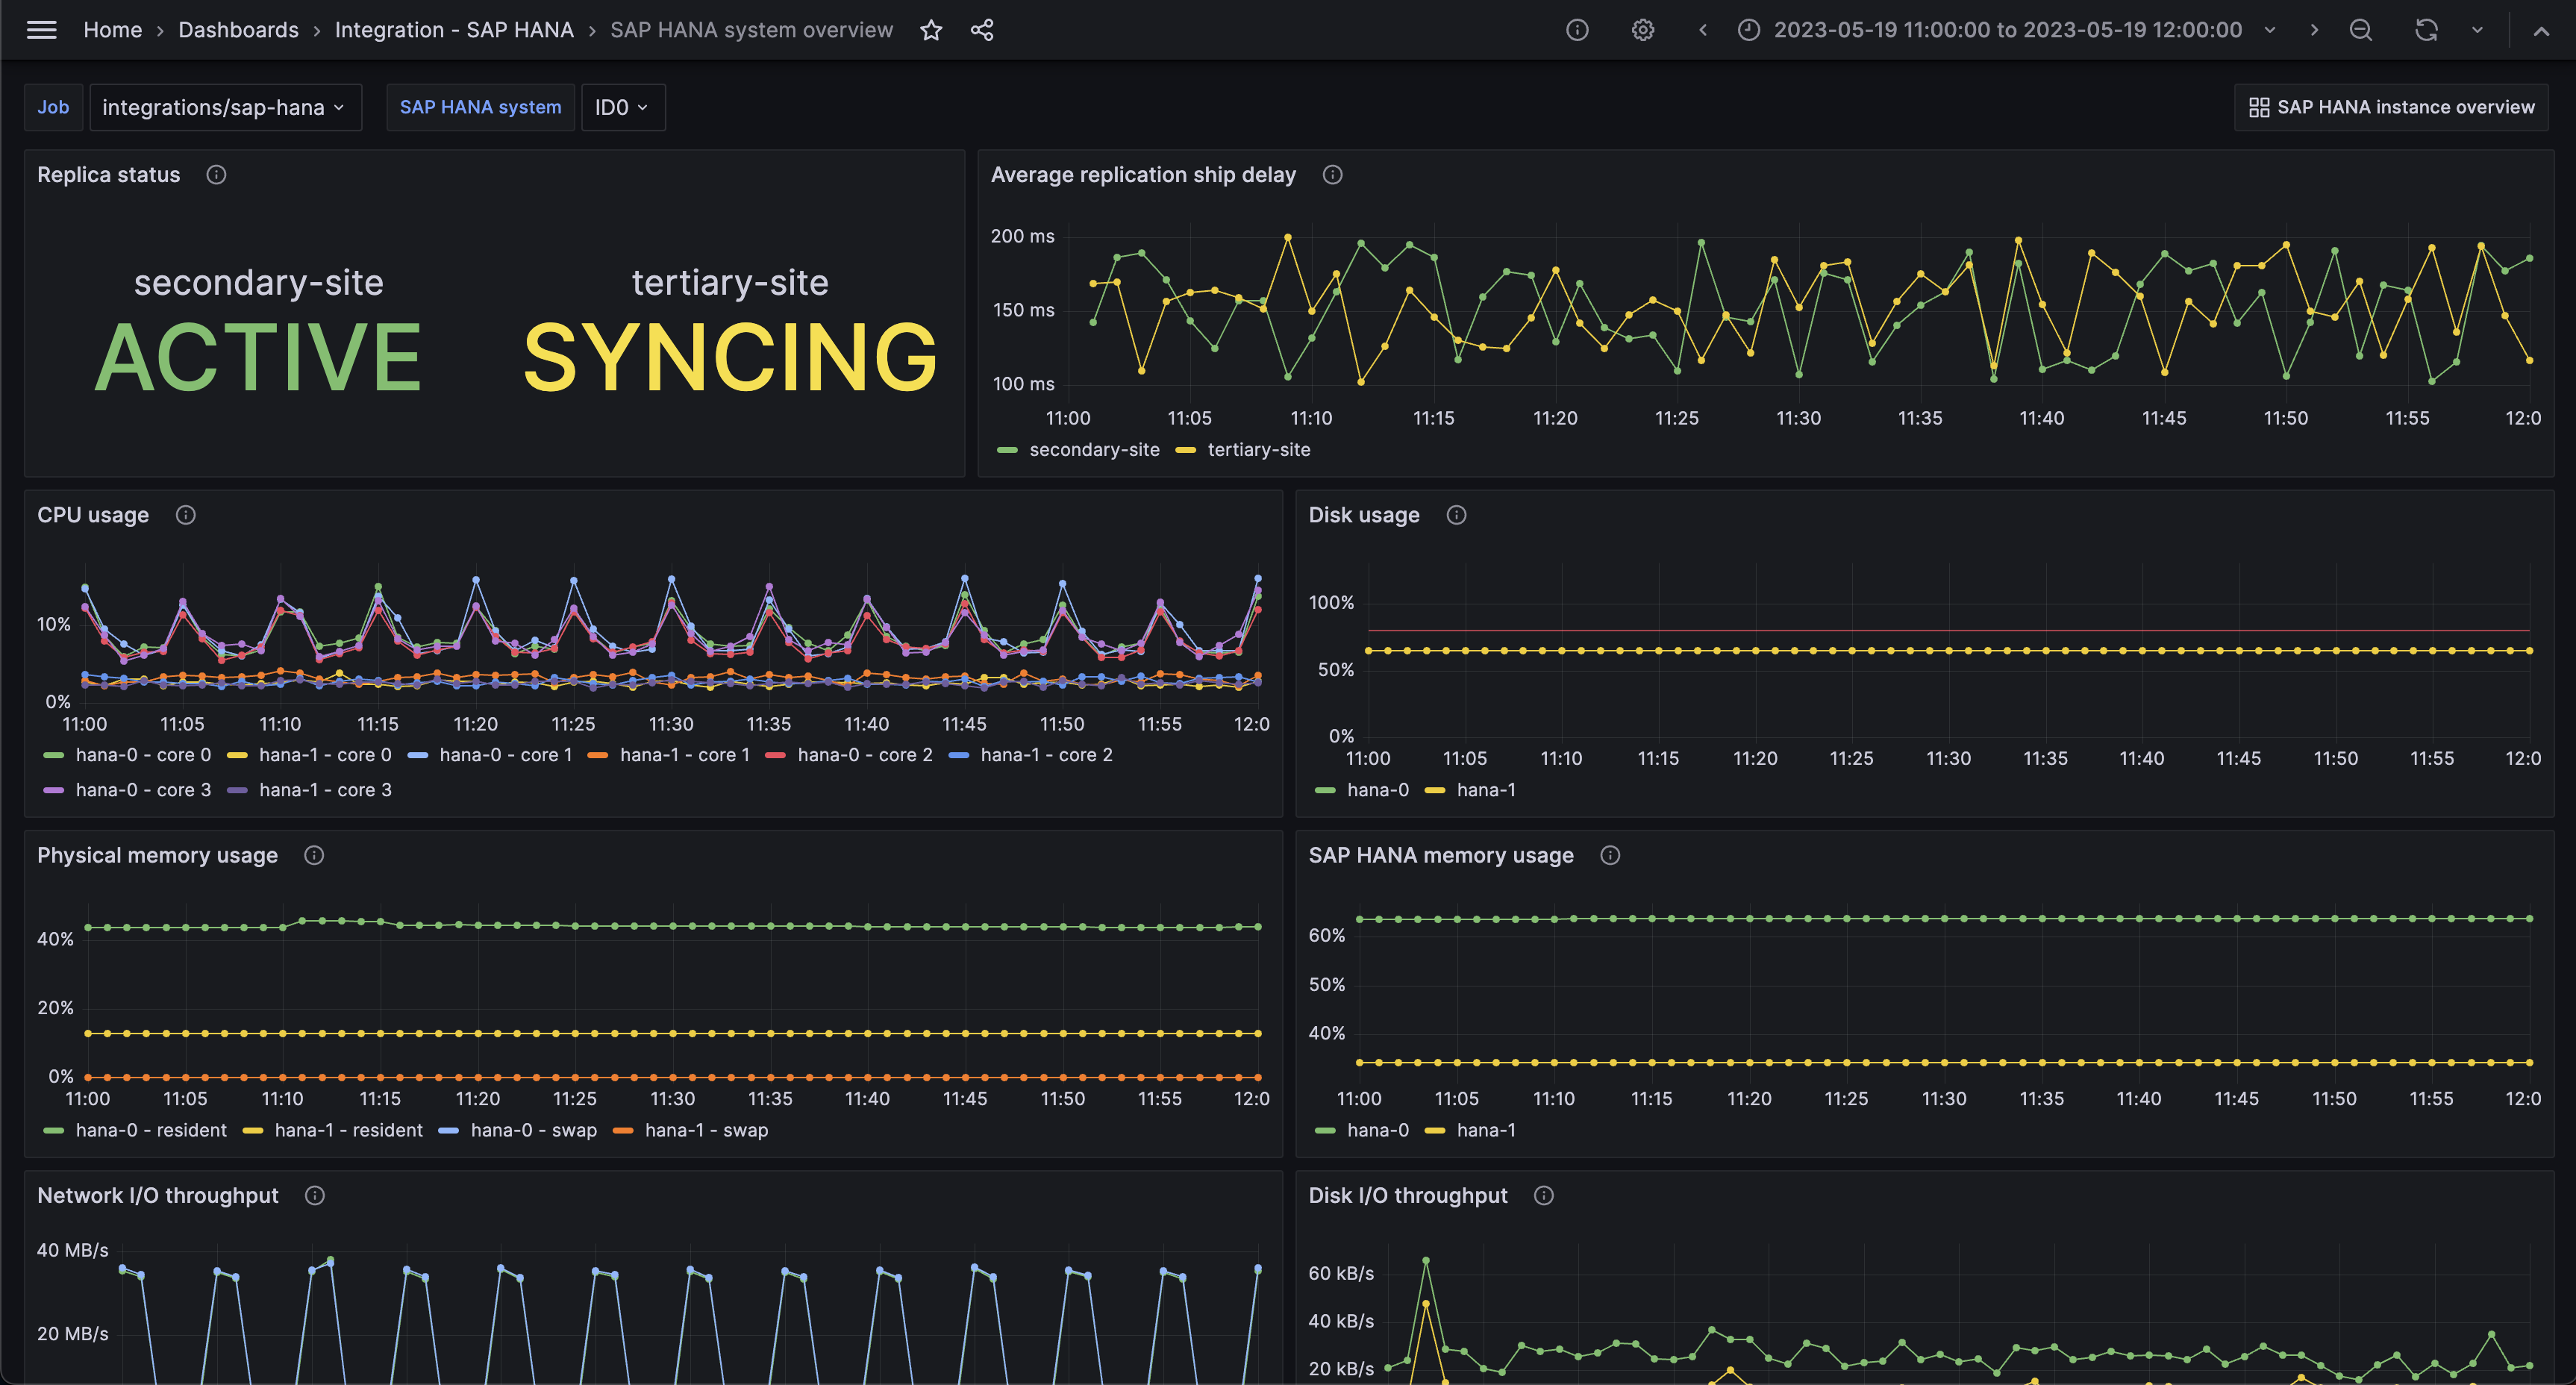
SAP HANA system overview (alerts)
SAP HANA instance overview (logs)
Alerts
The SAP HANA® integration includes the following useful alerts:
| Alert | Description |
|---|---|
| SapHanaHighCpuUtilization | Critical: CPU utilization is high. |
| SapHanaHighPhysicalMemoryUsage | Critical: Current physical memory usage of the host is approaching capacity. |
| SapHanaMemAllocLimitBelowRecommendation | Warning: Memory allocation limit set below recommended limit. |
| SapHanaHighMemoryUsage | Critical: Current SAP HANA memory usage is approaching capacity. |
| SapHanaHighDiskUtilization | Critical: SAP HANA disk is approaching capacity. |
| SapHanaHighSqlExecutionTime | Critical: SAP HANA SQL average execution time is high. |
| SapHanaHighReplicationShippingTime | Critical: SAP HANA system replication log shipping delay is high. |
| SapHanaReplicationStatusError | Critical: SAP HANA system replication status signifies an error. |
Metrics
The most important metrics provided by the SAP HANA® integration, which are used on the pre-built dashboards and Prometheus alerts, are as follows:
- hanadb_alerts_current_rating
- hanadb_connections_total_count
- hanadb_cpu_busy_percent
- hanadb_disk_io_throughput_kb_second
- hanadb_disk_total_size_mb
- hanadb_disk_total_used_size_mb
- hanadb_host_memory_alloc_limit_mb
- hanadb_host_memory_physical_total_mb
- hanadb_host_memory_resident_mb
- hanadb_host_memory_swap_free_mb
- hanadb_host_memory_swap_used_mb
- hanadb_host_memory_used_total_mb
- hanadb_network_receive_rate_kb_per_seconds
- hanadb_network_transmission_rate_kb_per_seconds
- hanadb_schema_used_memory_mb
- hanadb_sql_service_elap_per_exec_avg_ms
- hanadb_sql_service_lock_per_exec_ms
- hanadb_sql_top_time_consumers_mu
- hanadb_sr_replication
- hanadb_sr_ship_delay
- hanadb_table_cs_top_mem_total_mb
- up
Changelog
# 0.0.3 - September 2023

* New Filter Metrics option for configuring the Grafana Agent, which saves on metrics cost by dropping any metric not used by this integration. Beware that anything custom built using metrics that are not on the snippet will stop working.
* New hostname relabel option, which applies the instance name you write on the text box to the Grafana Agent configuration snippets, making it easier and less error prone to configure this mandatory label.

# 0.0.2 - August 2023

* Add regex filter for logs datasource

# 0.0.1 - June 2023

* Initial release
Cost
By connecting your SAP HANA® instance to Grafana Cloud, you might incur charges. To view information on the number of active series that your Grafana Cloud account uses for metrics included in each Cloud tier, see Active series and dpm usage and Cloud tier pricing.
Was this page helpful?
Related resources from Grafana Labs


