
Raspberry Pi integration for Grafana Cloud
The Raspberry Pi integration uses the agent to collect metrics related to the operating system (Linux-based), including aspects like CPU usage, load average, memory usage, and disk and networking I/O. It also supports system logs being scraped by the agent using promtail. An accompanying dashboard is provided to visualize these metrics and logs.
The Raspberry Pi integration uses node-observ-lib.
This integration includes 15 useful alerts and 2 pre-built dashboards to help monitor and visualize Raspberry Pi metrics and logs.
Before you begin
Each Raspberry Pi node being observed must have its dedicated Grafana Alloy running.
Install Raspberry Pi integration for Grafana Cloud
- In your Grafana Cloud stack, click Connections in the left-hand menu.
- Find Raspberry Pi and click its tile to open the integration.
- Review the prerequisites in the Configuration Details tab and set up Grafana Agent to send Raspberry Pi metrics and logs to your Grafana Cloud instance.
- Click Install to add this integration’s pre-built dashboards and alerts to your Grafana Cloud instance, and you can start monitoring your Raspberry Pi setup.
Configuration snippets for Grafana Alloy
Simple mode
These snippets are configured to scrape a single Raspberry Pi instance running locally with default ports.
First, manually copy and append the following snippets into your alloy configuration file.
Integrations snippets
prometheus.exporter.unix "integrations_node_exporter" { }

discovery.relabel "integrations_node_exporter" {
	targets = prometheus.exporter.unix.integrations_node_exporter.targets

	rule {
		target_label = "instance"
		replacement  = constants.hostname
	}

	rule {
		target_label = "job"
		replacement  = "integrations/raspberrypi-node"
	}
}

prometheus.scrape "integrations_node_exporter" {
	targets    = discovery.relabel.integrations_node_exporter.output
	forward_to = [prometheus.remote_write.metrics_service.receiver]
	job_name   = "integrations/node_exporter"
}
Logs snippets
linux
discovery.relabel "logs_integrations_integrations_node_exporter_journal_scrape" {
	targets = []

	rule {
		source_labels = ["__journal__systemd_unit"]
		target_label  = "unit"
	}

	rule {
		source_labels = ["__journal__boot_id"]
		target_label  = "boot_id"
	}

	rule {
		source_labels = ["__journal__transport"]
		target_label  = "transport"
	}

	rule {
		source_labels = ["__journal_priority_keyword"]
		target_label  = "level"
	}
}

loki.source.journal "logs_integrations_integrations_node_exporter_journal_scrape" {
	max_age       = "24h0m0s"
	relabel_rules = discovery.relabel.logs_integrations_integrations_node_exporter_journal_scrape.rules
	forward_to    = [loki.write.grafana_cloud_loki.receiver]
	labels        = {
		instance = constants.hostname,
		job      = "integrations/raspberrypi-node",
	}
}

local.file_match "logs_integrations_integrations_node_exporter_direct_scrape" {
	path_targets = [{
		__address__ = "localhost",
		__path__    = "/var/log/{syslog,messages,*.log}",
		instance    = constants.hostname,
		job         = "integrations/raspberrypi-node",
	}]
}

loki.source.file "logs_integrations_integrations_node_exporter_direct_scrape" {
	targets    = local.file_match.logs_integrations_integrations_node_exporter_direct_scrape.targets
	forward_to = [loki.write.grafana_cloud_loki.receiver]
}
Advanced mode
The following snippets provide examples to guide you through the configuration process.
To instruct Grafana Alloy to scrape your Raspberry Pi instances, manually copy and append the snippets to your alloy configuration file, then follow subsequent instructions.
Advanced integrations snippets
prometheus.exporter.unix "integrations_node_exporter" { }

discovery.relabel "integrations_node_exporter" {
	targets = prometheus.exporter.unix.integrations_node_exporter.targets

	rule {
		target_label = "instance"
		replacement  = constants.hostname
	}

	rule {
		target_label = "job"
		replacement  = "integrations/raspberrypi-node"
	}
}

prometheus.scrape "integrations_node_exporter" {
	targets    = discovery.relabel.integrations_node_exporter.output
	forward_to = [prometheus.remote_write.metrics_service.receiver]
	job_name   = "integrations/node_exporter"
}
This integrations uses the prometheus.exporter.unix component to generate metrics from a Raspberry Pi instance.
For the full array of configuration options, refer to the prometheus.exporter.unix component reference documentation.
This exporter must be linked with a discovery.relabel component to apply the necessary relabelings.
For each Raspberry Pi instance to be monitored you must create a pair of these components.
Configure the following properties within each discovery.relabel component:
instancelabel:constants.hostnamesets theinstancelabel to your Grafana Alloy server hostname. If that is not suitable, change it to a value uniquely identifies this Raspberry Pi instance. Make sure this label value is the same for all telemetry data collected for this instance.
You can then scrape them by including each discovery.relabel under targets within the prometheus.scrape component.
Advanced logs snippets
linux
discovery.relabel "logs_integrations_integrations_node_exporter_journal_scrape" {
	targets = []

	rule {
		source_labels = ["__journal__systemd_unit"]
		target_label  = "unit"
	}

	rule {
		source_labels = ["__journal__boot_id"]
		target_label  = "boot_id"
	}

	rule {
		source_labels = ["__journal__transport"]
		target_label  = "transport"
	}

	rule {
		source_labels = ["__journal_priority_keyword"]
		target_label  = "level"
	}
}

loki.source.journal "logs_integrations_integrations_node_exporter_journal_scrape" {
	max_age       = "24h0m0s"
	relabel_rules = discovery.relabel.logs_integrations_integrations_node_exporter_journal_scrape.rules
	forward_to    = [loki.write.grafana_cloud_loki.receiver]
	labels        = {
		instance = constants.hostname,
		job      = "integrations/raspberrypi-node",
	}
}

local.file_match "logs_integrations_integrations_node_exporter_direct_scrape" {
	path_targets = [{
		__address__ = "localhost",
		__path__    = "/var/log/{syslog,messages,*.log}",
		instance    = constants.hostname,
		job         = "integrations/raspberrypi-node",
	}]
}

loki.source.file "logs_integrations_integrations_node_exporter_direct_scrape" {
	targets    = local.file_match.logs_integrations_integrations_node_exporter_direct_scrape.targets
	forward_to = [loki.write.grafana_cloud_loki.receiver]
}
To monitor your Raspberry Pi instance logs, you will use a combination of the following components:
local.file_match defines where to find the log file to be scraped. Change the following properties according to your environment:
__address__: The Raspberry Pi instance address__path__: The path to the log file.instancelabel:constants.hostnamesets theinstancelabel to your Grafana Alloy server hostname. If that is not suitable, change it to a value uniquely identifies this Raspberry Pi instance. Make sure this label value is the same for all telemetry data collected for this instance.
loki.source.journal Reads logs from the systemd journal. Change the following properties according to your environment:
max_age: The oldest relative time from process start that will be read.
discovery.relabel defines any relabeling needed before sending logs to Loki.
loki.source.file sends logs to Loki.
Grafana Agent static configuration (deprecated)
The following section shows configuration for running Grafana Agent in static mode which is deprecated. You should use Grafana Alloy for all new deployments.
Before you begin
Each Raspberry Pi node being observed must have its dedicated Grafana Agent running.
Install Raspberry Pi integration for Grafana Cloud
- In your Grafana Cloud stack, click Connections in the left-hand menu.
- Find Raspberry Pi and click its tile to open the integration.
- Review the prerequisites in the Configuration Details tab and set up Grafana Agent to send Raspberry Pi metrics and logs to your Grafana Cloud instance.
- Click Install to add this integration’s pre-built dashboards and alerts to your Grafana Cloud instance, and you can start monitoring your Raspberry Pi setup.
Post-install configuration for the Raspberry Pi integration
This integration is configured to work with the node_exporter, which is embedded in Grafana Agent.
Enable the integration by adding the snippets provided to your agent configuration file.
Note: The
instancelabel must uniquely identify the node being scraped. Also, ensure each deployed Grafana Agent has a configuration that matches the node it is deployed to.
This integration supports metrics and logs from Raspberry Pi. If you want to monitor your Raspberry Pi node logs, there are 3 options. You can:
- scrape the journal
- scrape your OS log files directly
- scrape both your journal and OS log files
We recommend that you enable journal scraping because it comes with a unit label that can be used to filter logs on the dashboards. Config snippets for both cases are provided.
If you want to show logs and metrics signals correlated in your dashboards, as a single pane of glass, ensure the following:
jobandinstancelabel values must match fornode_exporterintegration andlogsscrape config in your agent configuration file.joblabel must be set tointegrations/raspberrypi-node(already configured in the snippets).instancelabel must be set to a value that uniquely identifies your Linux Node. Please replace the default<your-instance-name>value according to your environment - it should be set manually. Note that if you uselocalhostfor multiple nodes, the dashboards will not be able to filter correctly by instance.
For a full description of configuration options see how to configure the node_exporter_config block in the agent documentation.
Configuration snippets for Grafana Agent
Below integrations, insert the following lines and change the URLs according to your environment:
  node_exporter:
    enabled: true
    metric_relabel_configs:
    # drop extensive scrape statistics
    - action: drop
      regex: node_scrape_collector_.+
      source_labels: [__name__]
    relabel_configs:
    - replacement: '<your-instance-name>'
      target_label: instance
    - replacement: integrations/raspberrypi-node
      target_label: job
Below logs.configs.scrape_configs, insert the following lines according to your environment.
    - job_name: integrations/node_exporter_journal_scrape
      journal:
        max_age: 24h
        labels:
          instance: '<your-instance-name>'
          job: integrations/raspberrypi-node
      relabel_configs:
      - source_labels: ['__journal__systemd_unit']
        target_label: 'unit'
      - source_labels: ['__journal__boot_id']
        target_label: 'boot_id'
      - source_labels: ['__journal__transport']
        target_label: 'transport'
      - source_labels: ['__journal_priority_keyword']
        target_label: 'level'
    - job_name: integrations/node_exporter_direct_scrape
      static_configs:
      - targets:
        - localhost
        labels:
          instance: '<your-instance-name>'
          __path__: /var/log/{syslog,messages,*.log}
          job: integrations/raspberrypi-node
Full example configuration for Grafana Agent
Refer to the following Grafana Agent configuration for a complete example that contains all the snippets used for the Raspberry Pi integration. This example also includes metrics that are sent to monitor your Grafana Agent instance.
integrations:
  prometheus_remote_write:
  - basic_auth:
      password: <your_prom_pass>
      username: <your_prom_user>
    url: <your_prom_url>
  agent:
    enabled: true
    relabel_configs:
    - action: replace
      source_labels:
      - agent_hostname
      target_label: instance
    - action: replace
      target_label: job
      replacement: "integrations/agent-check"
    metric_relabel_configs:
    - action: keep
      regex: (prometheus_target_sync_length_seconds_sum|prometheus_target_scrapes_.*|prometheus_target_interval.*|prometheus_sd_discovered_targets|agent_build.*|agent_wal_samples_appended_total|process_start_time_seconds)
      source_labels:
      - __name__
  # Add here any snippet that belongs to the `integrations` section.
  # For a correct indentation, paste snippets copied from Grafana Cloud at the beginning of the line.
  node_exporter:
    enabled: true
    metric_relabel_configs:
    # drop extensive scrape statistics
    - action: drop
      regex: node_scrape_collector_.+
      source_labels: [__name__]
    relabel_configs:
    - replacement: '<your-instance-name>'
      target_label: instance
    - replacement: integrations/raspberrypi-node
      target_label: job
logs:
  configs:
  - clients:
    - basic_auth:
        password: <your_loki_pass>
        username: <your_loki_user>
      url: <your_loki_url>
    name: integrations
    positions:
      filename: /tmp/positions.yaml
    scrape_configs:
      # Add here any snippet that belongs to the `logs.configs.scrape_configs` section.
      # For a correct indentation, paste snippets copied from Grafana Cloud at the beginning of the line.
    - job_name: integrations/node_exporter_journal_scrape
      journal:
        max_age: 24h
        labels:
          instance: '<your-instance-name>'
          job: integrations/raspberrypi-node
      relabel_configs:
      - source_labels: ['__journal__systemd_unit']
        target_label: 'unit'
      - source_labels: ['__journal__boot_id']
        target_label: 'boot_id'
      - source_labels: ['__journal__transport']
        target_label: 'transport'
      - source_labels: ['__journal_priority_keyword']
        target_label: 'level'
    - job_name: integrations/node_exporter_direct_scrape
      static_configs:
      - targets:
        - localhost
        labels:
          instance: '<your-instance-name>'
          __path__: /var/log/{syslog,messages,*.log}
          job: integrations/raspberrypi-node
metrics:
  configs:
  - name: integrations
    remote_write:
    - basic_auth:
        password: <your_prom_pass>
        username: <your_prom_user>
      url: <your_prom_url>
    scrape_configs:
      # Add here any snippet that belongs to the `metrics.configs.scrape_configs` section.
      # For a correct indentation, paste snippets copied from Grafana Cloud at the beginning of the line.
  global:
    scrape_interval: 60s
  wal_directory: /tmp/grafana-agent-wal
Dashboards
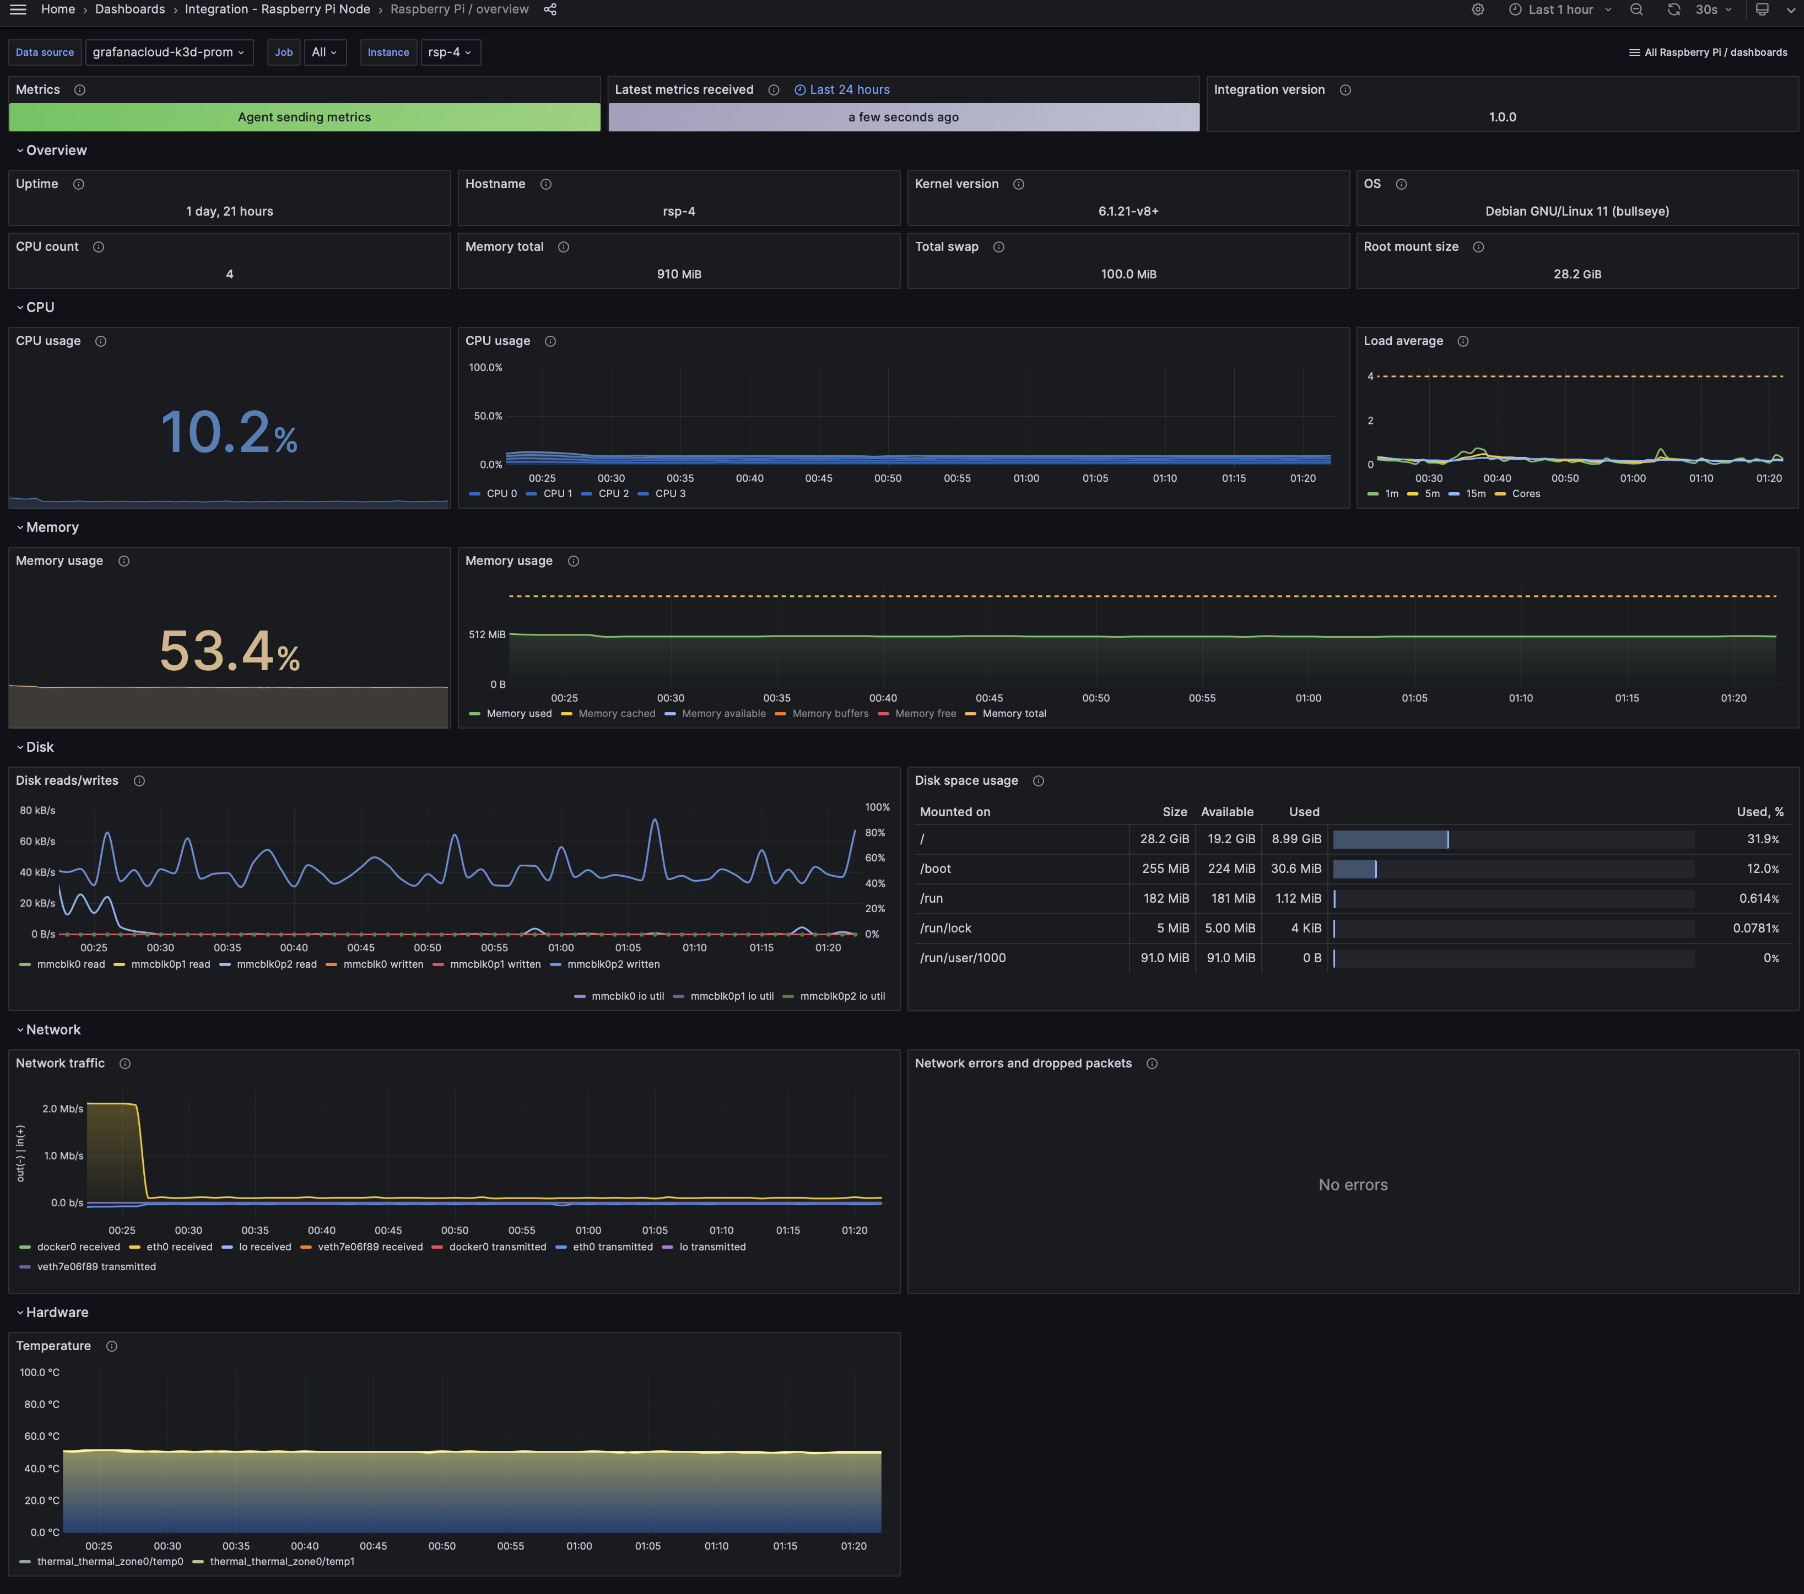
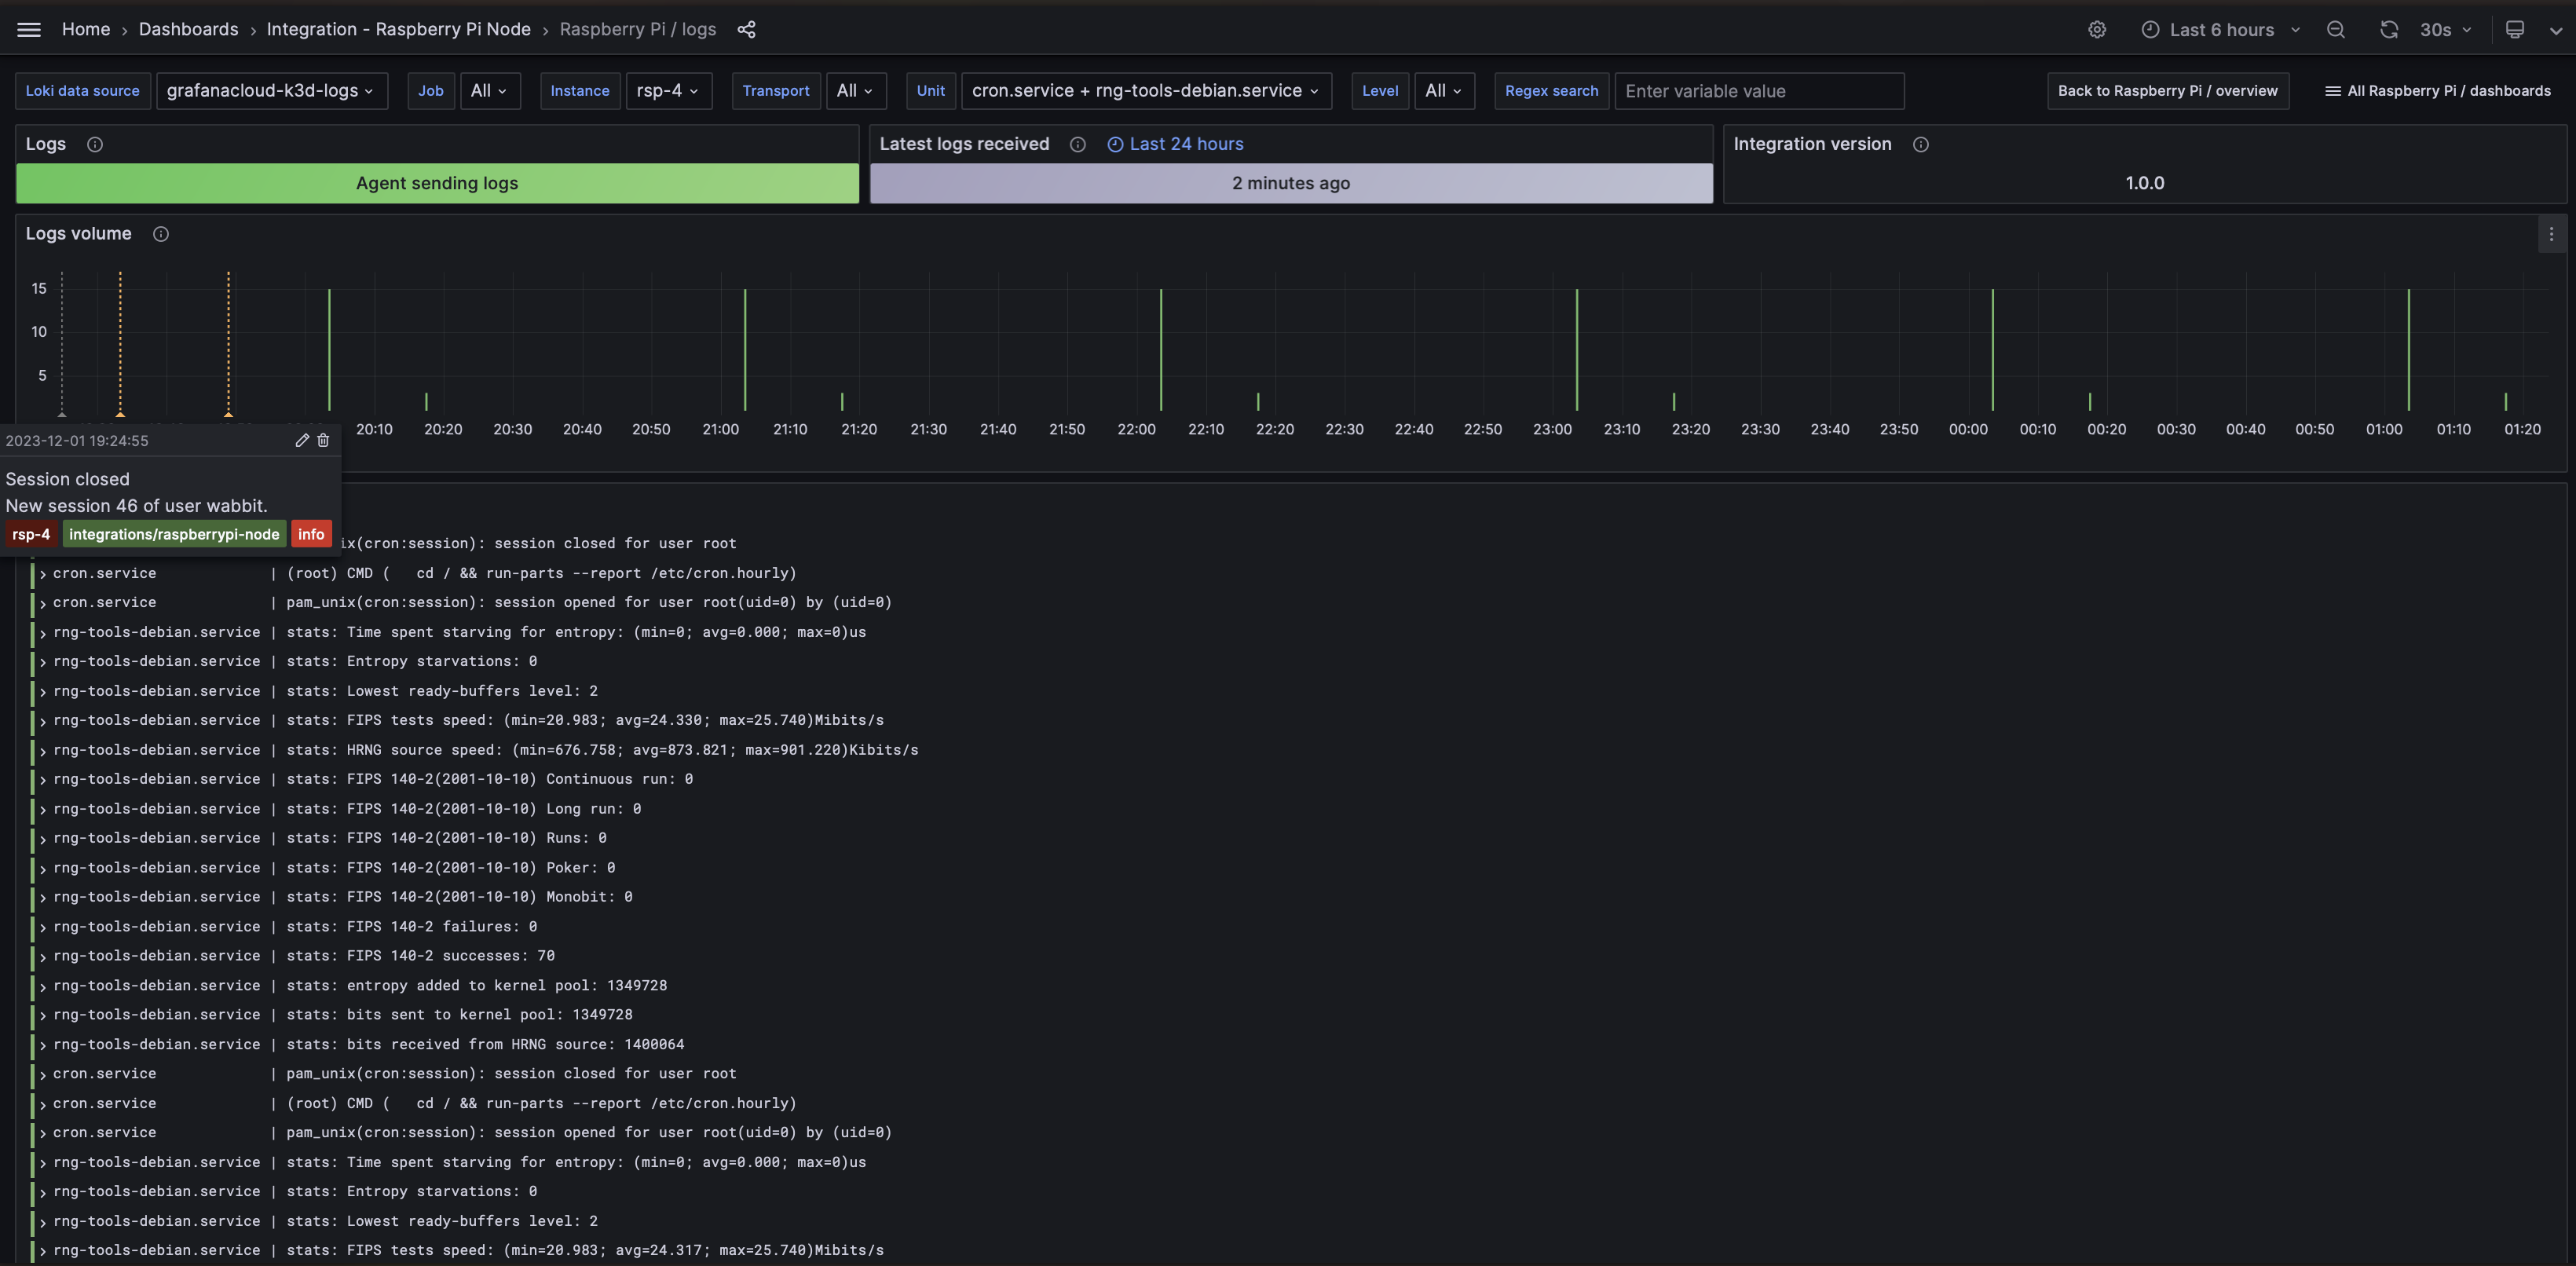
The Raspberry Pi integration installs the following dashboards in your Grafana Cloud instance to help monitor your system.
- Raspberry Pi / logs
- Raspberry Pi / overview
Raspberry Pi overview
Raspberry Pi logs
Alerts
The Raspberry Pi integration includes the following useful alerts:
raspberrypi-node-filesystem-alerts
| Alert | Description |
|---|---|
| NodeFilesystemAlmostOutOfSpace | Warning: Filesystem has less than 5% space left. |
| NodeFilesystemAlmostOutOfSpace | Critical: Filesystem has less than 3% space left. |
| NodeFilesystemFilesFillingUp | Warning: Filesystem is predicted to run out of inodes within the next 24 hours. |
| NodeFilesystemFilesFillingUp | Critical: Filesystem is predicted to run out of inodes within the next 4 hours. |
| NodeFilesystemAlmostOutOfFiles | Warning: Filesystem has less than 5% inodes left. |
| NodeFilesystemAlmostOutOfFiles | Critical: Filesystem has less than 3% inodes left. |
raspberrypi-node-alerts
| Alert | Description |
|---|---|
| NodeNetworkReceiveErrs | Warning: Network interface is reporting many receive errors. |
| NodeNetworkTransmitErrs | Warning: Network interface is reporting many transmit errors. |
| NodeCPUHighUsage | Info: High CPU usage. |
| NodeSystemSaturation | Warning: System saturated, load per core is very high. |
| NodeMemoryMajorPagesFaults | Warning: Memory major page faults are occurring at very high rate. |
| NodeMemoryHighUtilization | Warning: Host is running out of memory. |
| NodeDiskIOSaturation | Warning: Disk IO queue is high. |
| NodeSystemdServiceFailed | Warning: Systemd service has entered failed state. |
| NodeHardwareTemperatureHigh | Warning: Sensor’s temperature is high. |
Metrics
The most important metrics provided by the Raspberry Pi integration, which are used on the pre-built dashboards and Prometheus alerts, are as follows:
- node_boot_time_seconds
- node_cpu_seconds_total
- node_disk_io_time_seconds_total
- node_disk_io_time_weighted_seconds_total
- node_disk_read_bytes_total
- node_disk_written_bytes_total
- node_filesystem_avail_bytes
- node_filesystem_files
- node_filesystem_files_free
- node_filesystem_readonly
- node_filesystem_size_bytes
- node_hwmon_temp_celsius
- node_load1
- node_load15
- node_load5
- node_memory_Buffers_bytes
- node_memory_Cached_bytes
- node_memory_MemAvailable_bytes
- node_memory_MemFree_bytes
- node_memory_MemTotal_bytes
- node_memory_Slab_bytes
- node_memory_SwapTotal_bytes
- node_network_receive_bytes_total
- node_network_receive_drop_total
- node_network_receive_errs_total
- node_network_receive_packets_total
- node_network_transmit_bytes_total
- node_network_transmit_drop_total
- node_network_transmit_errs_total
- node_network_transmit_packets_total
- node_os_info
- node_systemd_unit_state
- node_uname_info
- node_vmstat_pgmajfault
- up
Changelog
# 1.0.0 - December 2023

* Use latest linux observabiltiy library
* Add separate logs dashboard
* Add inventory panels row
* Add grafana annotations for events like reboot, OOMkill and others
* Add metrics and logs status panels
* Rename dashboards' prefix to 'Raspberry Pi /'
* Add new alerts: NodeCPUHighUsage, NodeSystemSaturation, NodeMemoryMajorPagesFaults, NodeDiskIOSaturation, NodeSystemdServiceFailed, NodeHardwareTemperatureHigh.

# 0.0.4 - September 2023

* Update Grafana Agent configuration snippets to include filtered metrics used in gauge panels

# 0.0.3 - August 2023

* Add regex filter for logs datasource

# 0.0.2 - July 2023

* New Filter Metrics option for configuring the Grafana Agent, which saves on metrics cost by dropping any metric not used by this integration. Beware that anything custom built using metrics that are not on the snippet will stop working.

# 0.0.1 - September 2022

* Initial release
Cost
By connecting your Raspberry Pi instance to Grafana Cloud, you might incur charges. To view information on the number of active series that your Grafana Cloud account uses for metrics included in each Cloud tier, see Active series and dpm usage and Cloud tier pricing.
Was this page helpful?
Related resources from Grafana Labs


