
OpenStack integration for Grafana Cloud
OpenStack is an open-source cloud computing platform that facilitates the management of large pools of computing, storage, and networking resources in a data center. It provides scalable Infrastructure as a Service (IaaS) with multiple storage options, networking, IAM, monitoring, and more all built-in to the platform.
This integration supports Openstack 2023.2 Bobcat+.
This integration includes 9 useful alerts and 5 pre-built dashboards to help monitor and visualize OpenStack metrics and logs.
Before you begin
OpenStack prometheus exporter
This integration supports metrics and logs from an OpenStack cloud. It is configured to work with the OpenStack Prometheus Exporter, which must be installed and configured separately from Grafana Alloy. Follow instructions in exporter repo to configure the exporter, referring to /etc/openstack/clouds.yaml for the possible names of clouds to monitor.
Logging to a file (optional)
This integration collects logs from journald, assuming that logging to a file is not configured. If you wish to configure a log file for your OpenStack services:
- Create a
<service>.logfile. - Edit the
<service>.conffile to includelog_fileandlevelconfig options.
log_file = /Path/to/log/dir/<service>.log
level = WARNING- Other possible
leveloptions areDEBUG,INFO, andERROR.
- Restart the service:
systemctl restart <service-name>- Repeat steps 1-3 for each service.
Install OpenStack integration for Grafana Cloud
- In your Grafana Cloud stack, click Connections in the left-hand menu.
- Find OpenStack and click its tile to open the integration.
- Review the prerequisites in the Configuration Details tab and set up Grafana Agent to send OpenStack metrics and logs to your Grafana Cloud instance.
- Click Install to add this integration’s pre-built dashboards and alerts to your Grafana Cloud instance, and you can start monitoring your OpenStack setup.
Configuration snippets for Grafana Alloy
Simple mode
These snippets are configured to scrape a single OpenStack cloud with Grafana Alloy running locally.
Copy and Paste the following snippets into your Grafana Alloy configuration file.
Metrics snippets
discovery.relabel "openstack_metrics" {
  targets = [{
    __address__ = "localhost:9090",
  }]

  rule {
    target_label = "instance"
    replacement  = constants.hostname
  }
}

prometheus.scrape "openstack_metrics" {
  targets      = discovery.relabel.openstack_metrics.output
  forward_to   = [prometheus.remote_write.metrics_service.receiver]
  job_name     = "integrations/openstack"
  metrics_path = "/metrics"
}
Logs snippets
all
loki.process "logs_integrations_openstack" {
  forward_to = [loki.write.grafana_cloud_loki.receiver]
  stage.multiline {
    firstline = "(?P<level>(DEBUG|INFO|WARNING|ERROR)) "
  }
  stage.regex {
    expression = "(?P<level>(DEBUG|INFO|WARNING|ERROR)) (?P<service>\\w+)[\\w|.]+ (\\[.*] )(?P<message>.*)"
  }
  stage.labels {
    values = {
      level     = "",
      service   = "",
    }
  }
}
loki.relabel "logs_integrations_openstack" {
  forward_to = [loki.process.logs_integrations_openstack.receiver]

  rule {
    source_labels = ["__journal_systemd_unit"]
    target_label  = "unit"
  }
}
loki.source.journal "logs_integrations_openstack" {
  max_age = "12h"
  labels  = {
    job      = "integrations/openstack",
    instance = constants.hostname,
  }
  forward_to = [loki.process.logs_integrations_openstack.receiver]
}
Advanced mode
The following snippets provide examples to guide you through the configuration process.
To instruct Grafana Alloy to scrape your OpenStack cloud, manually copy and append the snippets to your alloy configuration file, then follow subsequent instructions.
Advanced metrics snippets
discovery.relabel "openstack_metrics" {
  targets = [{
    __address__ = "localhost:9090",
  }]

  rule {
    target_label = "instance"
    replacement  = constants.hostname
  }
}

prometheus.scrape "openstack_metrics" {
  targets      = discovery.relabel.openstack_metrics.output
  forward_to   = [prometheus.remote_write.metrics_service.receiver]
  job_name     = "integrations/openstack"
  metrics_path = "/metrics"
}
To monitor an OpenStack instance, you must use a discovery.relabel component to discover your OpenStack Prometheus endpoint and apply appropriate labels, followed by a prometheus.scrape component to scrape it.
Configure the following properties within the discovery.relabel component:
__address__: change this fromlocalhost:9090to the host and port of the remote OpenStack Prometheus metrics endpoint.constants.hostname: the snippets set theinstancelabel to your Grafana Alloy server hostname using theconstants.hostnamevariable. If you are running Grafana Alloy outside of your OpenStack server host, change the variable to a value that uniquely identifies it.
If you have multiple OpenStack servers to scrape, configure one discovery.relabel for each and scrape them by including each under targets within the prometheus.scrape component.
Advanced logs snippets
linux
loki.process "logs_integrations_openstack" {
  forward_to = [loki.write.grafana_cloud_loki.receiver]
  stage.multiline {
    firstline = "(?P<level>(DEBUG|INFO|WARNING|ERROR)) "
  }
  stage.regex {
    expression = "(?P<level>(DEBUG|INFO|WARNING|ERROR)) (?P<service>\\w+)[\\w|.]+ (\\[.*] )(?P<message>.*)"
  }
  stage.labels {
    values = {
      level     = "",
      service   = "",
    }
  }
}
loki.relabel "logs_integrations_openstack" {
  forward_to = [loki.process.logs_integrations_openstack.receiver]

  rule {
    source_labels = ["__journal_systemd_unit"]
    target_label  = "unit"
  }
}
loki.source.journal "logs_integrations_openstack" {
  max_age = "12h"
  labels  = {
    job      = "integrations/openstack",
    instance = constants.hostname,
  }
  forward_to = [loki.process.logs_integrations_openstack.receiver]
}
This integration uses the loki.source.journal component to collect OpenStack service logs.
If you configure logging to a file for your OpenStack services, refer to the loki.source.file component documentation.
Grafana Agent static configuration (deprecated)
The following section shows configuration for running Grafana Agent in static mode which is deprecated. You should use Grafana Alloy for all new deployments.
Before you begin
OpenStack prometheus exporter
This integration supports metrics and logs from an OpenStack cloud. It is configured to work with the OpenStack Prometheus Exporter, which must be installed and configured separately from the Grafana Agent. Follow instructions in exporter repo to configure the exporter, referring to /etc/openstack/clouds.yaml for the possible names of clouds to monitor.
Logging to a file (optional)
This integration collects logs from journald, assuming that logging to a file is not configured. If you wish to configure a log file for your OpenStack services:
- Create a
<service>.logfile. - Edit the
<service>.conffile to includelog_fileandlevelconfig options.
log_file = /Path/to/log/dir/<service>.log
level = WARNING- Other possible
leveloptions areDEBUG,INFO, andERROR.
- Restart the service:
systemctl restart <service-name>- Repeat steps 1-3 for each service.
Install OpenStack integration for Grafana Cloud
- In your Grafana Cloud stack, click Connections in the left-hand menu.
- Find OpenStack and click its tile to open the integration.
- Review the prerequisites in the Configuration Details tab and set up Grafana Agent to send OpenStack metrics and logs to your Grafana Cloud instance.
- Click Install to add this integration’s pre-built dashboards and alerts to your Grafana Cloud instance, and you can start monitoring your OpenStack setup.
Post-install configuration for the OpenStack integration
To show logs and metrics signals correlated in your dashboards, as a single pane of glass, ensure the following:
jobandinstancelabel values must match for metrics and logs scrape config in your agent configuration file.joblabel must be set tointegrations/openstack(already configured in the snippets).instancelabel must be set to a value that uniquely identifies your OpenStack node. Please replace the default hostname value according to your environment - it must be set manually.
Configuration snippets for Grafana Agent
Below metrics.configs.scrape_configs, insert the following lines and change the URLs according to your environment:
    - job_name: integrations/openstack
      metrics_path: /metrics
      static_configs:
        - targets: ["<your-instance-name>:<your-instance-port>"]
Below logs.configs.scrape_configs, insert the following lines according to your environment.
    - job_name: integrations/openstack
      journal:
        max_age: 12h
        labels:
          job: integrations/openstack
          instance: <your-instance-name>
      relabel_configs:
        - source_labels: ["__journal_systemd_unit"]
          target_label: "unit"
      pipeline_stages:
        - multiline:
            firstline: '(?P<level>(DEBUG|INFO|WARNING|ERROR)) '
        - regex:
            expression: '(?P<level>(DEBUG|INFO|WARNING|ERROR)) (?P<service>\w+)[\w|.]+ (\[.*] )(?P<message>.*)'
        - labels:
            level:
            service:
Full example configuration for Grafana Agent
Refer to the following Grafana Agent configuration for a complete example that contains all the snippets used for the OpenStack integration. This example also includes metrics that are sent to monitor your Grafana Agent instance.
integrations:
  prometheus_remote_write:
  - basic_auth:
      password: <your_prom_pass>
      username: <your_prom_user>
    url: <your_prom_url>
  agent:
    enabled: true
    relabel_configs:
    - action: replace
      source_labels:
      - agent_hostname
      target_label: instance
    - action: replace
      target_label: job
      replacement: "integrations/agent-check"
    metric_relabel_configs:
    - action: keep
      regex: (prometheus_target_sync_length_seconds_sum|prometheus_target_scrapes_.*|prometheus_target_interval.*|prometheus_sd_discovered_targets|agent_build.*|agent_wal_samples_appended_total|process_start_time_seconds)
      source_labels:
      - __name__
  # Add here any snippet that belongs to the `integrations` section.
  # For a correct indentation, paste snippets copied from Grafana Cloud at the beginning of the line.
logs:
  configs:
  - clients:
    - basic_auth:
        password: <your_loki_pass>
        username: <your_loki_user>
      url: <your_loki_url>
    name: integrations
    positions:
      filename: /tmp/positions.yaml
    scrape_configs:
      # Add here any snippet that belongs to the `logs.configs.scrape_configs` section.
      # For a correct indentation, paste snippets copied from Grafana Cloud at the beginning of the line.
    - job_name: integrations/openstack
      journal:
        max_age: 12h
        labels:
          job: integrations/openstack
          instance: <your-instance-name>
      relabel_configs:
        - source_labels: ["__journal_systemd_unit"]
          target_label: "unit"
      pipeline_stages:
        - multiline:
            firstline: '(?P<level>(DEBUG|INFO|WARNING|ERROR)) '
        - regex:
            expression: '(?P<level>(DEBUG|INFO|WARNING|ERROR)) (?P<service>\w+)[\w|.]+ (\[.*] )(?P<message>.*)'
        - labels:
            level:
            service:
metrics:
  configs:
  - name: integrations
    remote_write:
    - basic_auth:
        password: <your_prom_pass>
        username: <your_prom_user>
      url: <your_prom_url>
    scrape_configs:
      # Add here any snippet that belongs to the `metrics.configs.scrape_configs` section.
      # For a correct indentation, paste snippets copied from Grafana Cloud at the beginning of the line.
    - job_name: integrations/openstack
      metrics_path: /metrics
      static_configs:
        - targets: ["<your-instance-name>:<your-instance-port>"]
  global:
    scrape_interval: 60s
  wal_directory: /tmp/grafana-agent-wal
Dashboards
The OpenStack integration installs the following dashboards in your Grafana Cloud instance to help monitor your system.
- OpenStack Cinder
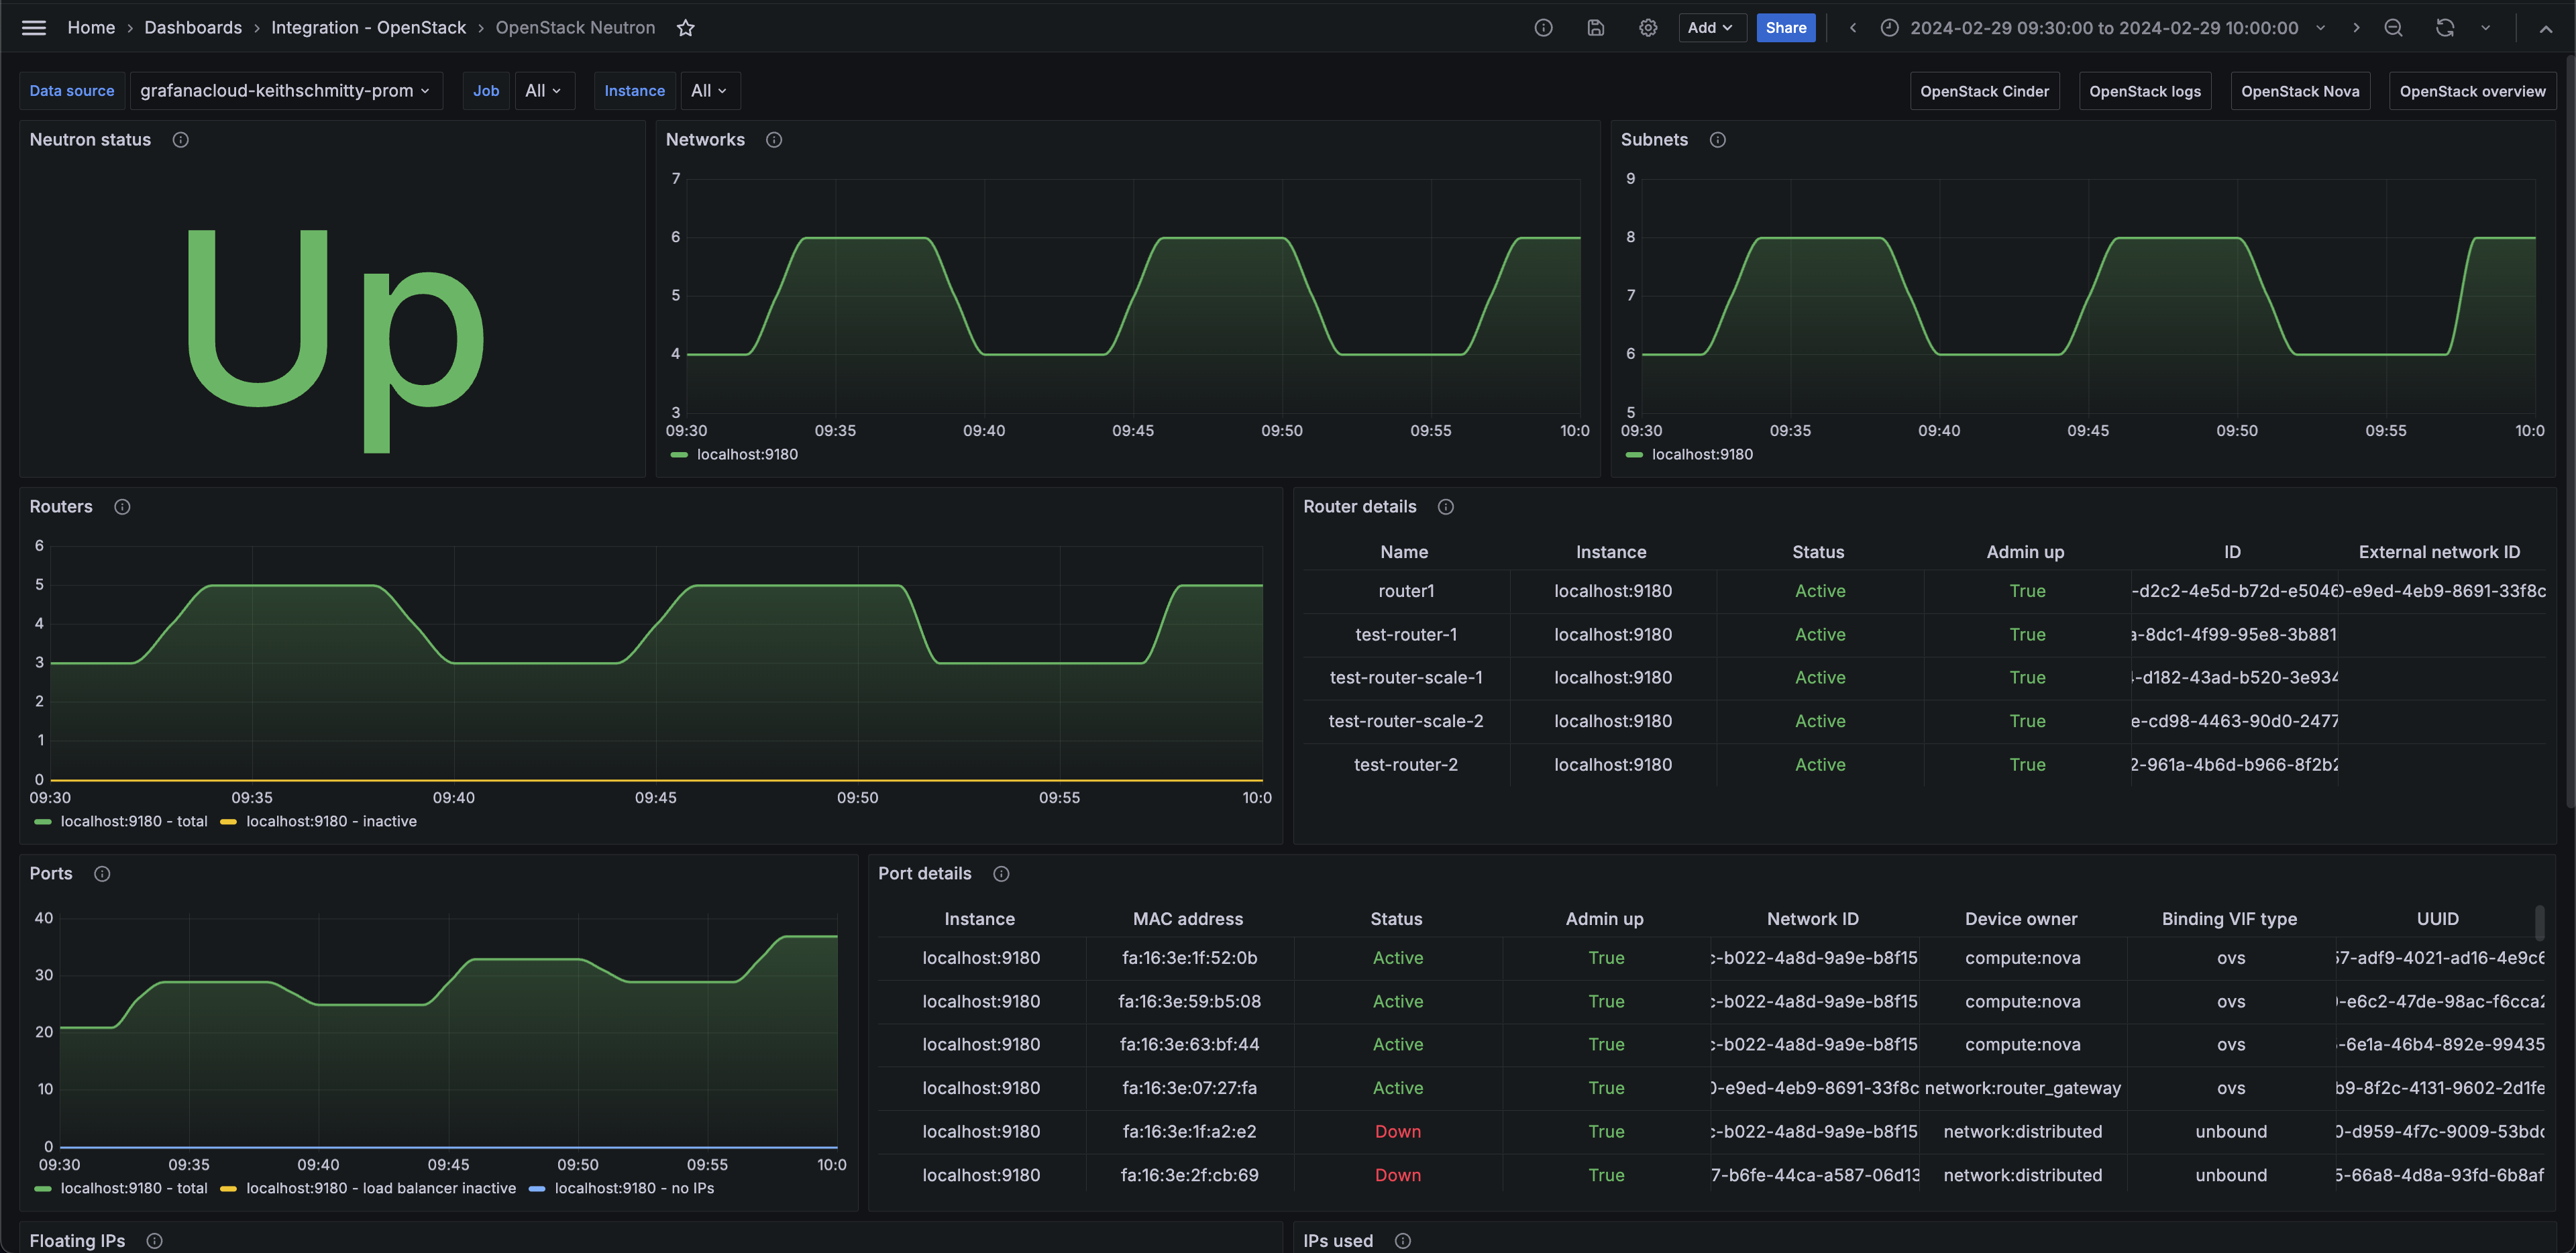
- OpenStack Neutron
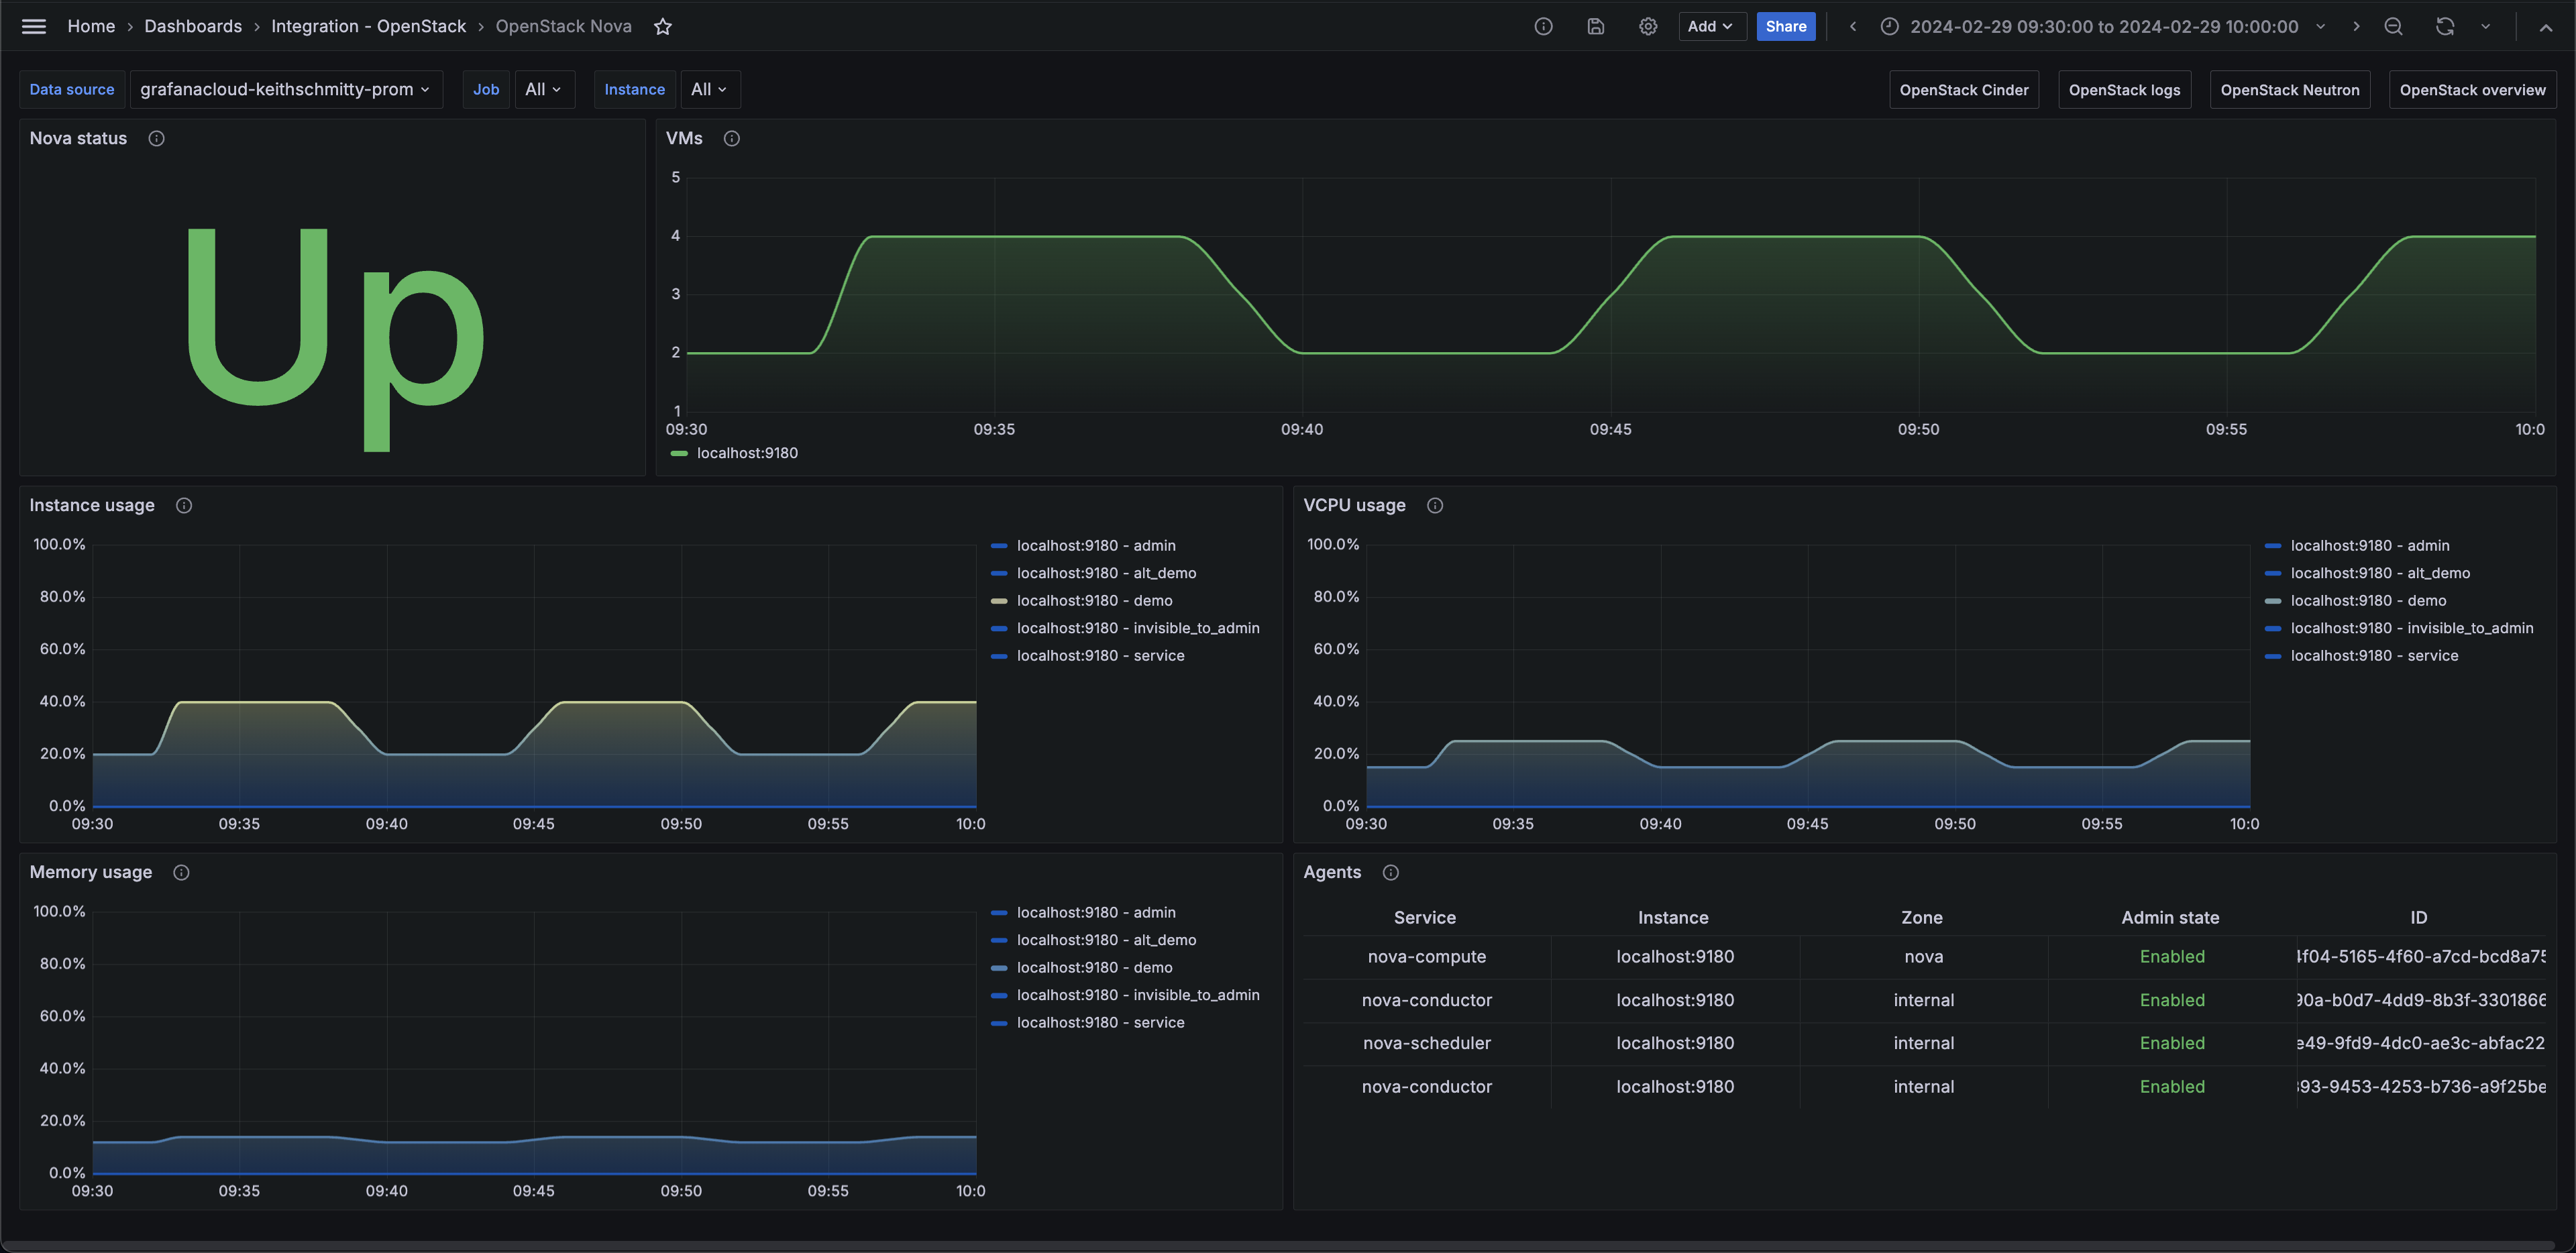
- OpenStack Nova
- OpenStack logs
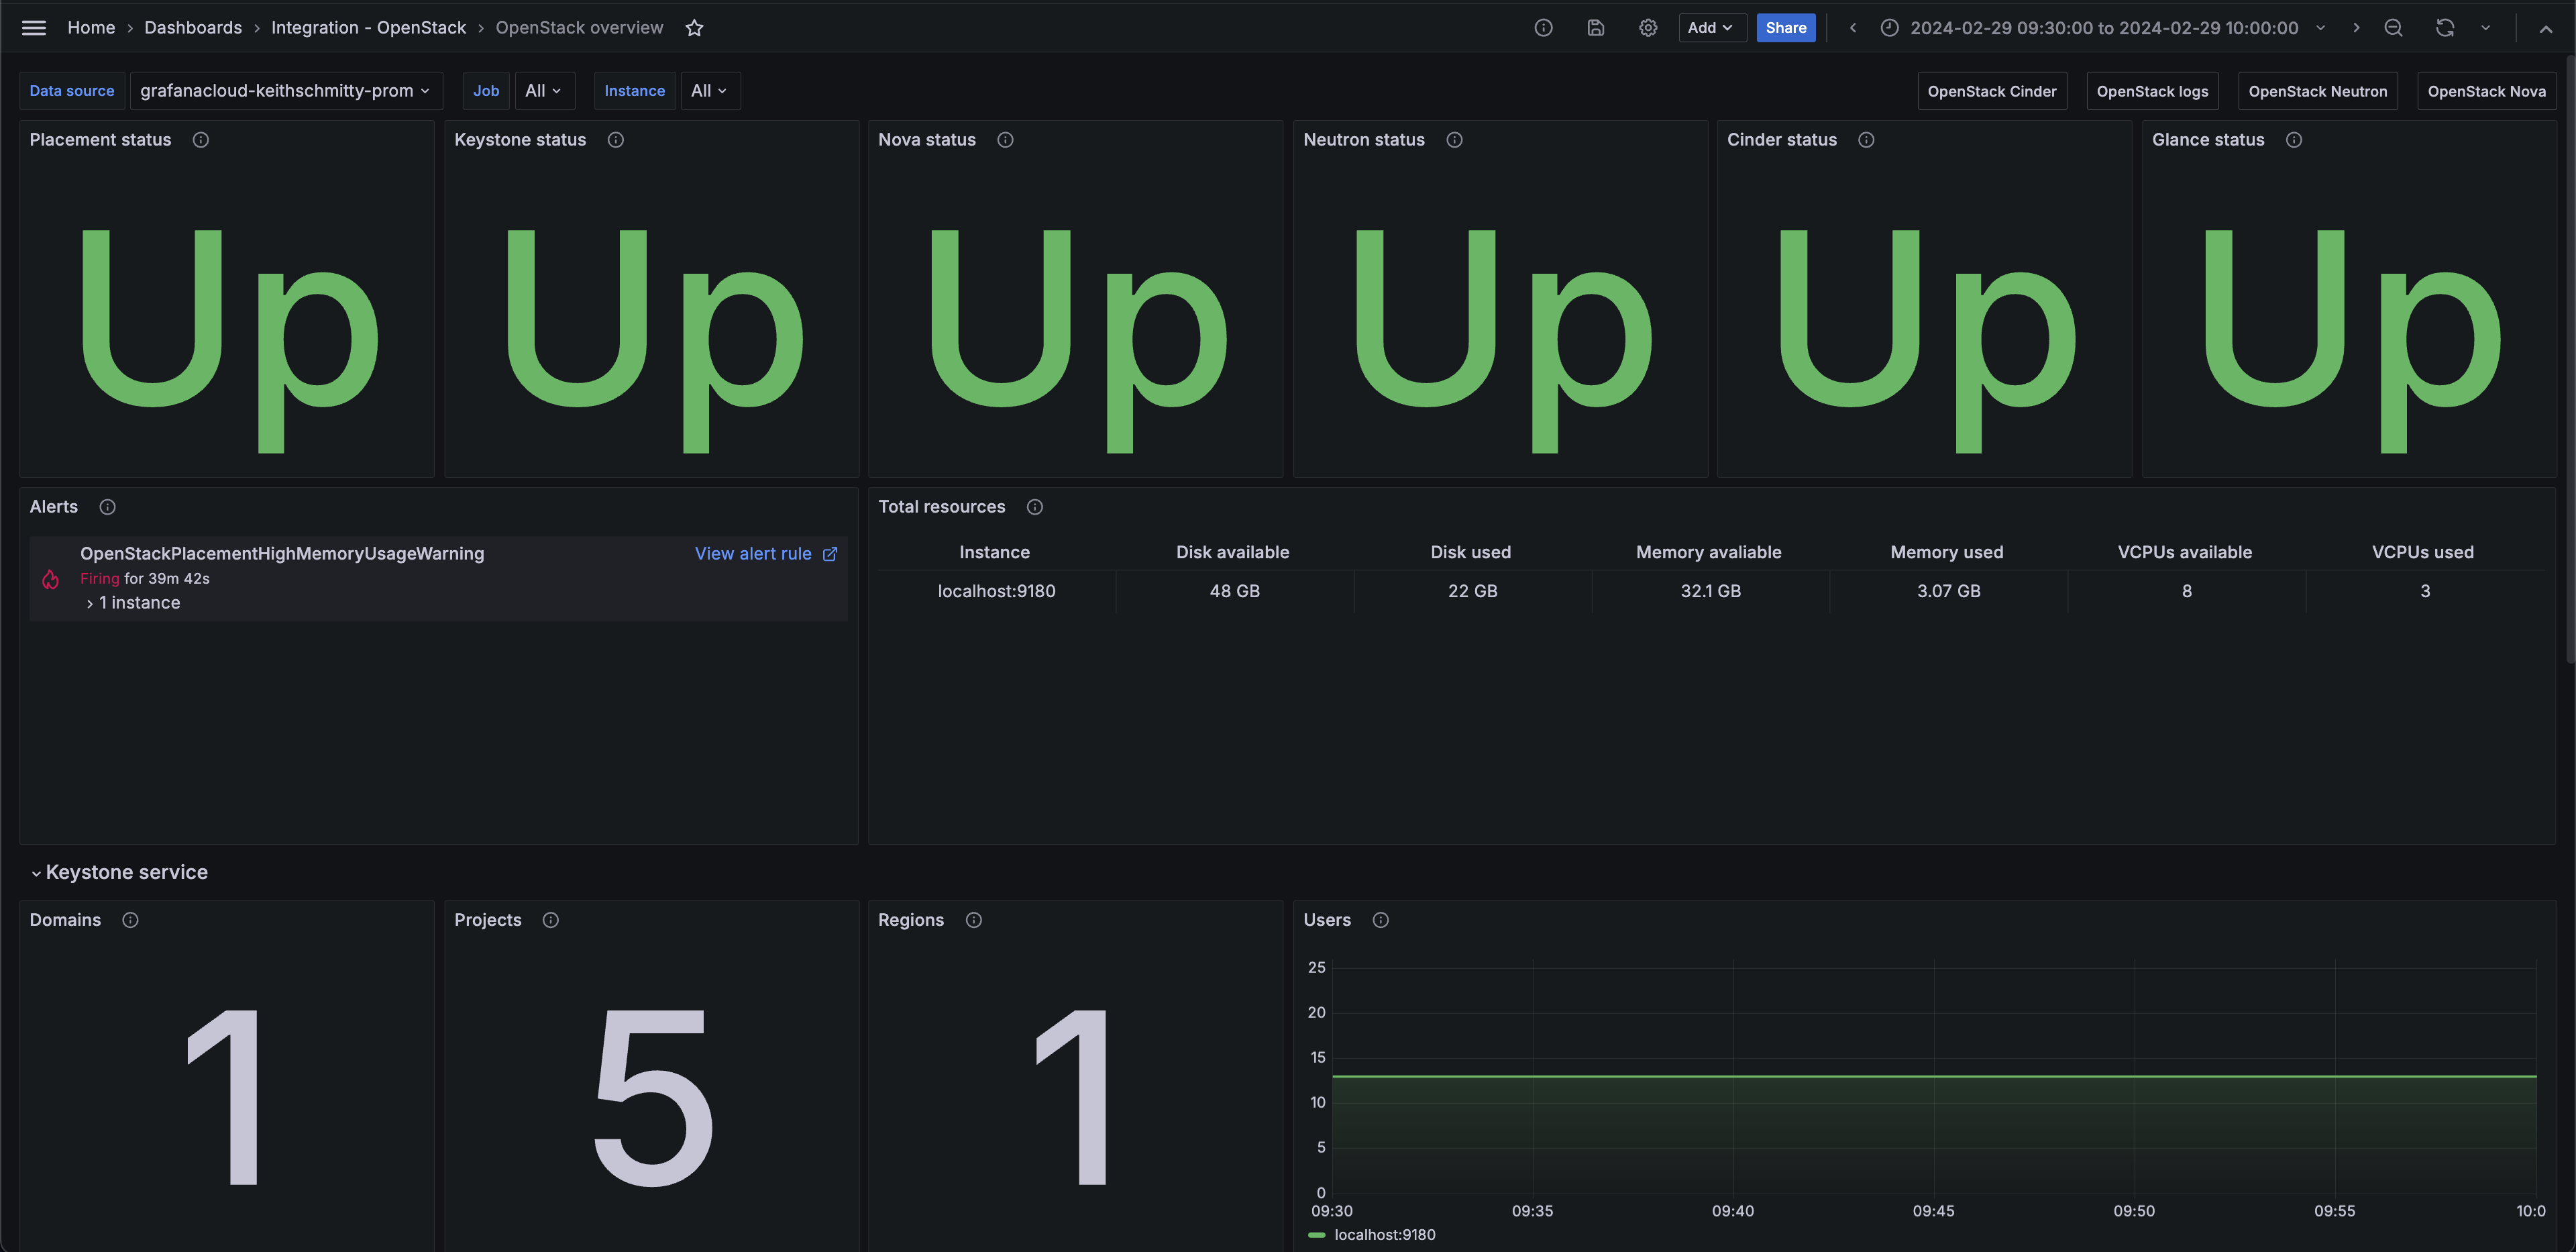
- OpenStack overview
OpenStack overview (services)
OpenStack Nova
OpenStack Neutron (networks)
Alerts
The OpenStack integration includes the following useful alerts:
| Alert | Description |
|---|---|
| OpenStackPlacementHighMemoryUsageWarning | Warning: The cloud is using a significant percentage of its allocated memory. |
| OpenStackPlacementHighMemoryUsageCritical | Critical: The cloud is using a large percentage of its allocated memory, consider allocating more resources. |
| OpenStackNovaHighVMMemoryUsage | Warning: VMs are using a high percentage of their allocated memory. |
| OpenStackNovaHighVMVCPUUsage | Warning: VMs are using a high percentage of their allocated virtual CPUs. |
| OpenStackNeutronHighDisconnectedPortRate | Critical: A high rate of ports have no IP addresses assigned to them. |
| OpenStackNeutronHighInactiveRouterRate | Critical: A high rate of routers are currently inactive. |
| OpenStackCinderHighBackupMemoryUsage | Warning: Cinder backups are using a large amount of their maximum memory. |
| OpenStackCinderHighVolumeMemoryUsage | Warning: Cinder volumes are using a large amount of their maximum memory. |
| OpenStackCinderHighPoolCapacityUsage | Warning: Cinder pools are using a large amount of their maximum capacity. |
Metrics
The most important metrics provided by the OpenStack integration, which are used on the pre-built dashboards and Prometheus alerts, are as follows:
- openstack_cinder_agent_state
- openstack_cinder_limits_backup_max_gb
- openstack_cinder_limits_backup_used_gb
- openstack_cinder_limits_volume_max_gb
- openstack_cinder_limits_volume_used_gb
- openstack_cinder_pool_capacity_free_gb
- openstack_cinder_pool_capacity_total_gb
- openstack_cinder_snapshots
- openstack_cinder_volume_status_counter
- openstack_cinder_volumes
- openstack_glance_image_bytes
- openstack_glance_images
- openstack_identity_domains
- openstack_identity_project_info
- openstack_identity_projects
- openstack_identity_regions
- openstack_identity_up
- openstack_identity_users
- openstack_neutron_agent_state
- openstack_neutron_floating_ips
- openstack_neutron_floating_ips_associated_not_active
- openstack_neutron_network_ip_availabilities_total
- openstack_neutron_network_ip_availabilities_used
- openstack_neutron_networks
- openstack_neutron_port
- openstack_neutron_ports
- openstack_neutron_ports_lb_not_active
- openstack_neutron_ports_no_ips
- openstack_neutron_router
- openstack_neutron_routers
- openstack_neutron_routers_not_active
- openstack_neutron_security_groups
- openstack_neutron_subnets
- openstack_nova_agent_state
- openstack_nova_limits_instances_max
- openstack_nova_limits_instances_used
- openstack_nova_limits_memory_max
- openstack_nova_limits_memory_used
- openstack_nova_limits_vcpus_max
- openstack_nova_limits_vcpus_used
- openstack_nova_total_vms
- openstack_placement_resource_total
- openstack_placement_resource_usage
- openstack_placement_up
- up
Changelog
# 1.0.0 - March 2024

- Initial release
Cost
By connecting your OpenStack instance to Grafana Cloud, you might incur charges. To view information on the number of active series that your Grafana Cloud account uses for metrics included in each Cloud tier, see Active series and dpm usage and Cloud tier pricing.
Was this page helpful?
Related resources from Grafana Labs


