
OpenSearch integration for Grafana Cloud
OpenSearch is an open-source project and a fork of Elasticsearch that provides a fully-featured and compatible alternative. It uses the same core technologies as Elasticsearch, including the Lucene search engine, and offers similar features such as distributed search, indexing, and analytics. This integration for Grafana Cloud allows users to monitor an OpenSearch clustered deployment with 3 separate dashboards for visualizing metric details at the cluster, node, and index levels.
This integration supports OpenSearch version 2.5.0+
This integration supports Prometheus exporter plugin for OpenSearch version 2.5.0.0+
This integration includes 12 useful alerts and 3 pre-built dashboards to help monitor and visualize OpenSearch metrics and logs.
Before you begin
In order for the integration to properly work, you must set up the Prometheus Exporter Plugin for OpenSearch.
Set up Prometheus Exporter Plugin for OpenSearch
To ensure compatibility, it is recommended that you refer to the Prometheus exporter plugins compatibility matrix and download the appropriate version based on your OpenSearch version.
You can find where to install the OpenSearch Prometheus exporter plugin by running:
sudo find / -name opensearch-pluginThis should give a location like /usr/share/opensearch/bin/opensearch-plugin which you can then change directory into with cd /usr/share/opensearch.
The Prometheus Exporter for OpenSearch version 2.5.0 can be installed via:
./bin/opensearch-plugin install https://github.com/aiven/prometheus-exporter-plugin-for-opensearch/releases/download/2.5.0.0/prometheus-exporter-2.5.0.0.zipFor more information on how to configure the Prometheus exporter plugin on each node, please refer to the Plugin Configuration documentation for further configuration details.
To validate the plugin is working correctly, Prometheus metrics should be available locally via curl:
curl http://localhost:9200/_prometheus/metricsIf you are unable to collect Prometheus metrics, then the OpenSearch configuration needs to be updated. This can be achieved by editing /etc/opensearch/opensearch.yml config.
To get running quickly, add plugins.security.disabled: true to the bottom of the file. Once this is done, OpenSearch can be restarted with sudo systemctl restart opensearch. Validate that Prometheus metrics can be collected via curl.
Install OpenSearch integration for Grafana Cloud
- In your Grafana Cloud stack, click Connections in the left-hand menu.
- Find OpenSearch and click its tile to open the integration.
- Review the prerequisites in the Configuration Details tab and set up Grafana Agent to send OpenSearch metrics and logs to your Grafana Cloud instance.
- Click Install to add this integration’s pre-built dashboards and alerts to your Grafana Cloud instance, and you can start monitoring your OpenSearch setup.
Configuration snippets for Grafana Alloy
Simple mode
These snippets are configured to scrape a single OpenSearch instance running locally with default ports.
First, manually copy and append the following snippets into your alloy configuration file.
Logs snippets
linux
local.file_match "logs_integrations_integrations_opensearch" {
	path_targets = [{
		__address__ = "localhost",
		__path__    = "/var/log/opensearch/opensearch.log",
		job         = "integrations/opensearch",
		node        = constants.hostname,
	}]
}

loki.source.file "logs_integrations_integrations_opensearch" {
	targets    = local.file_match.logs_integrations_integrations_opensearch.targets
	forward_to = [loki.write.grafana_cloud_loki.receiver]
}
Advanced mode
The following snippets provide examples to guide you through the configuration process.
To instruct Grafana Alloy to scrape your OpenSearch instances, manually copy and append the snippets to your alloy configuration file, then follow subsequent instructions.
Advanced metrics snippets
discovery.relabel "metrics_integrations_integrations_opensearch" {
	targets = [{
		__address__ = "<your-host-name>:9200",
	}]

	rule {
		target_label = "node"
		replacement  = constants.hostname
	}
}

prometheus.scrape "metrics_integrations_integrations_opensearch" {
	targets      = discovery.relabel.metrics_integrations_integrations_opensearch.output
	forward_to   = [prometheus.remote_write.metrics_service.receiver]
	job_name     = "integrations/opensearch"
	metrics_path = "/_prometheus/metrics"
}
To monitor your OpenSearch instance, you must use a discovery.relabel component to discover your OpenSearch Prometheus endpoint and apply appropriate labels, followed by a prometheus.scrape component to scrape it.
Configure the following properties within each discovery.relabel component:
__address__: The address to your OpenSearch Prometheus metrics endpoint.nodelabel:constants.hostnamesets theinstancelabel to your Grafana Alloy server hostname. If that is not suitable, change it to a value uniquely identifies this OpenSearch instance. Make sure this label value is the same for all telemetry data collected for this instance.
If you have multiple OpenSearch servers to scrape, configure one discovery.relabel for each and scrape them by including each under targets within the prometheus.scrape component.
Advanced logs snippets
linux
local.file_match "logs_integrations_integrations_opensearch" {
	path_targets = [{
		__address__ = "localhost",
		__path__    = "/var/log/opensearch/opensearch.log",
		job         = "integrations/opensearch",
		node        = constants.hostname,
	}]
}

loki.source.file "logs_integrations_integrations_opensearch" {
	targets    = local.file_match.logs_integrations_integrations_opensearch.targets
	forward_to = [loki.write.grafana_cloud_loki.receiver]
}
To monitor your OpenSearch instance logs, you will use a combination of the following components:
local.file_match defines where to find the log file to be scraped. Change the following properties according to your environment:
__address__: The OpenSearch instance address__path__: The path to the log file.nodelabel:constants.hostnamesets theinstancelabel to your Grafana Alloy server hostname. If that is not suitable, change it to a value uniquely identifies this OpenSearch instance. Make sure this label value is the same for all telemetry data collected for this instance.
loki.source.file sends logs to Loki.
On Linux, you will also need to add the alloy user to the opensearch group to get logs. Run the following command to configure the user as required:
sudo usermod -a -G opensearch alloyGrafana Agent static configuration (deprecated)
The following section shows configuration for running Grafana Agent in static mode which is deprecated. You should use Grafana Alloy for all new deployments.
Before you begin
In order for the integration to properly work, you must set up the Prometheus Exporter Plugin for OpenSearch.
Set up Prometheus Exporter Plugin for OpenSearch
To ensure compatibility, it is recommended that you refer to the Prometheus exporter plugins compatibility matrix and download the appropriate version based on your OpenSearch version.
You can find where to install the OpenSearch Prometheus exporter plugin by running:
sudo find / -name opensearch-pluginThis should give a location like /usr/share/opensearch/bin/opensearch-plugin which you can then change directory into with cd /usr/share/opensearch.
The Prometheus Exporter for OpenSearch version 2.5.0 can be installed via:
./bin/opensearch-plugin install https://github.com/aiven/prometheus-exporter-plugin-for-opensearch/releases/download/2.5.0.0/prometheus-exporter-2.5.0.0.zipFor more information on how to configure the Prometheus exporter plugin on each node, please refer to the Plugin Configuration documentation for further configuration details.
To validate the plugin is working correctly, Prometheus metrics should be available locally via curl:
curl http://localhost:9200/_prometheus/metricsIf you are unable to collect Prometheus metrics, then the OpenSearch configuration needs to be updated. This can be achieved by editing /etc/opensearch/opensearch.yml config.
To get running quickly, add plugins.security.disabled: true to the bottom of the file. Once this is done, OpenSearch can be restarted with sudo systemctl restart opensearch. Validate that Prometheus metrics can be collected via curl.
Install OpenSearch integration for Grafana Cloud
- In your Grafana Cloud stack, click Connections in the left-hand menu.
- Find OpenSearch and click its tile to open the integration.
- Review the prerequisites in the Configuration Details tab and set up Grafana Agent to send OpenSearch metrics and logs to your Grafana Cloud instance.
- Click Install to add this integration’s pre-built dashboards and alerts to your Grafana Cloud instance, and you can start monitoring your OpenSearch setup.
Post-install configuration for the OpenSearch integration
After enabling the metrics generation, instruct the Grafana Agent to scrape your OpenSearch cluster. The Grafana Agent config is stored in /etc/grafana-agent.yaml.
Enable the integration by adding the suggested snippets to your agent configuration file.
If you want to show logs and metrics signals correlated in your dashboards as a single pane of glass, ensure the following:
jobandnodelabel values must match for the OpenSearch integration and logs scrape config in your agent configuration file.jobmust be set tointegrations/opensearch(already configured in the snippets).nodelabel must be set to a value that uniquely identifies your OpenSearch node which is the same as an instance name on a single node.__path__is the error log location, which isvar/log/opensearch/opensearch.logby default (already configured in the snippets).
Make sure to change targets in the snippet according to your environment. The default port for OpenSearch targets is 9200.
On Linux, you will also need to add the grafana-agent user to the opensearch group to get logs. Run the following command to configure the user as required:
sudo usermod -a -G opensearch grafana-agentConfiguration snippets for Grafana Agent
Below metrics.configs.scrape_configs, insert the following lines and change the URLs according to your environment:
    - job_name: integrations/opensearch
      metrics_path: /_prometheus/metrics
      relabel_configs:
        - replacement: '<your-instance-name>'
          target_label: node
      static_configs:
        - targets: ['<your-host-name>:9200']
Below logs.configs.scrape_configs, insert the following lines according to your environment.
    - job_name: integrations/opensearch
      static_configs:
        - targets:
          - localhost
          labels:
            job: integrations/opensearch
            node: '<your-instance-name>'
            __path__: /var/log/opensearch/opensearch.log
Full example configuration for Grafana Agent
Refer to the following Grafana Agent configuration for a complete example that contains all the snippets used for the OpenSearch integration. This example also includes metrics that are sent to monitor your Grafana Agent instance.
integrations:
  prometheus_remote_write:
  - basic_auth:
      password: <your_prom_pass>
      username: <your_prom_user>
    url: <your_prom_url>
  agent:
    enabled: true
    relabel_configs:
    - action: replace
      source_labels:
      - agent_hostname
      target_label: instance
    - action: replace
      target_label: job
      replacement: "integrations/agent-check"
    metric_relabel_configs:
    - action: keep
      regex: (prometheus_target_sync_length_seconds_sum|prometheus_target_scrapes_.*|prometheus_target_interval.*|prometheus_sd_discovered_targets|agent_build.*|agent_wal_samples_appended_total|process_start_time_seconds)
      source_labels:
      - __name__
  # Add here any snippet that belongs to the `integrations` section.
  # For a correct indentation, paste snippets copied from Grafana Cloud at the beginning of the line.
logs:
  configs:
  - clients:
    - basic_auth:
        password: <your_loki_pass>
        username: <your_loki_user>
      url: <your_loki_url>
    name: integrations
    positions:
      filename: /tmp/positions.yaml
    scrape_configs:
      # Add here any snippet that belongs to the `logs.configs.scrape_configs` section.
      # For a correct indentation, paste snippets copied from Grafana Cloud at the beginning of the line.
    - job_name: integrations/opensearch
      static_configs:
        - targets:
          - localhost
          labels:
            job: integrations/opensearch
            node: '<your-instance-name>'
            __path__: /var/log/opensearch/opensearch.log
metrics:
  configs:
  - name: integrations
    remote_write:
    - basic_auth:
        password: <your_prom_pass>
        username: <your_prom_user>
      url: <your_prom_url>
    scrape_configs:
      # Add here any snippet that belongs to the `metrics.configs.scrape_configs` section.
      # For a correct indentation, paste snippets copied from Grafana Cloud at the beginning of the line.
    - job_name: integrations/opensearch
      metrics_path: /_prometheus/metrics
      relabel_configs:
        - replacement: '<your-instance-name>'
          target_label: node
      static_configs:
        - targets: ['<your-host-name>:9200']
  global:
    scrape_interval: 60s
  wal_directory: /tmp/grafana-agent-wal
Dashboards
The OpenSearch integration installs the following dashboards in your Grafana Cloud instance to help monitor your system.
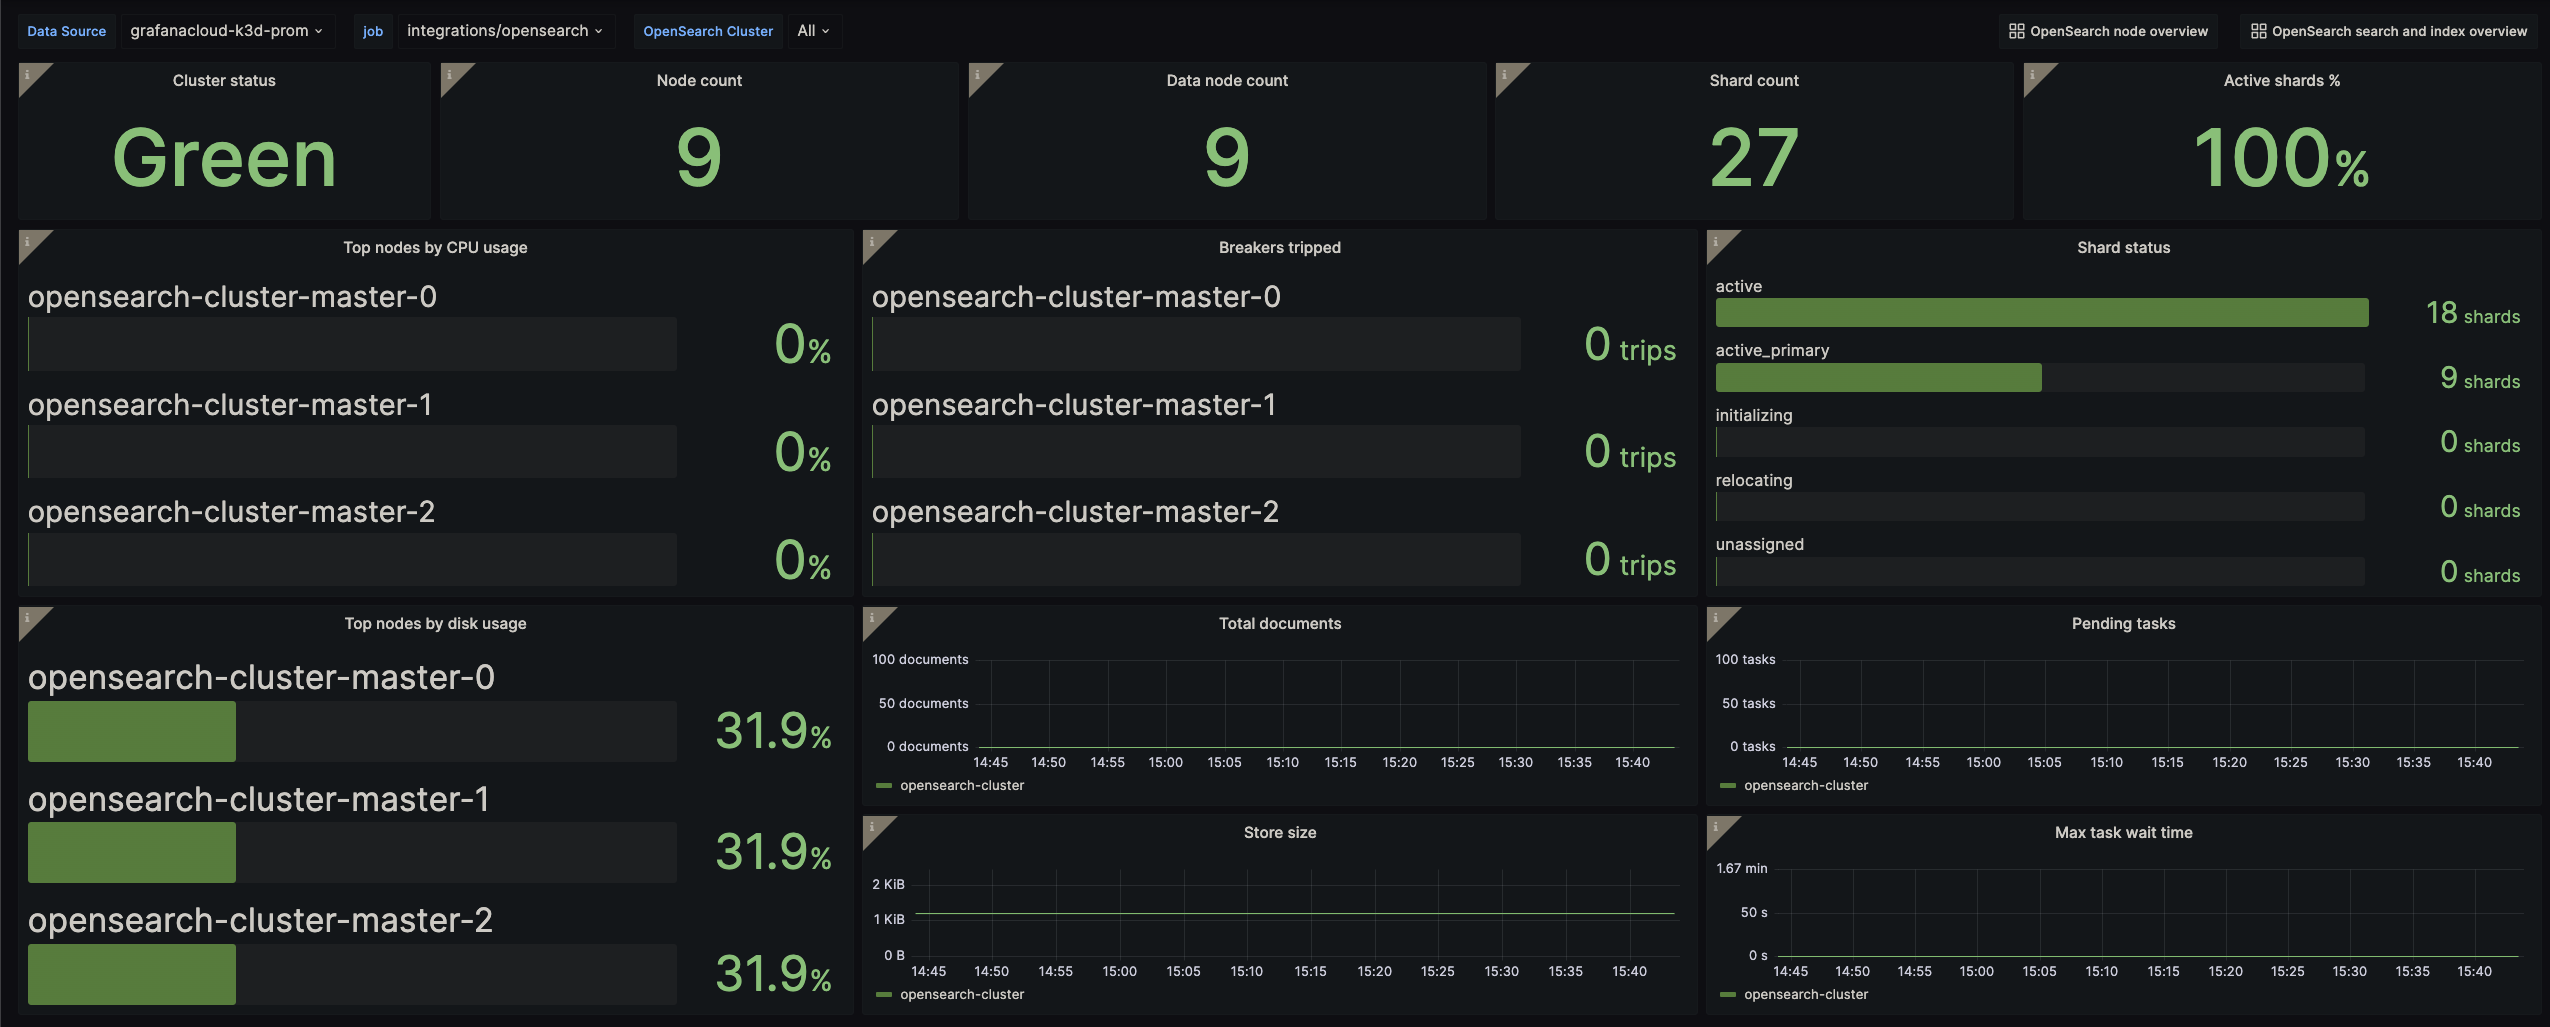
- OpenSearch cluster overview
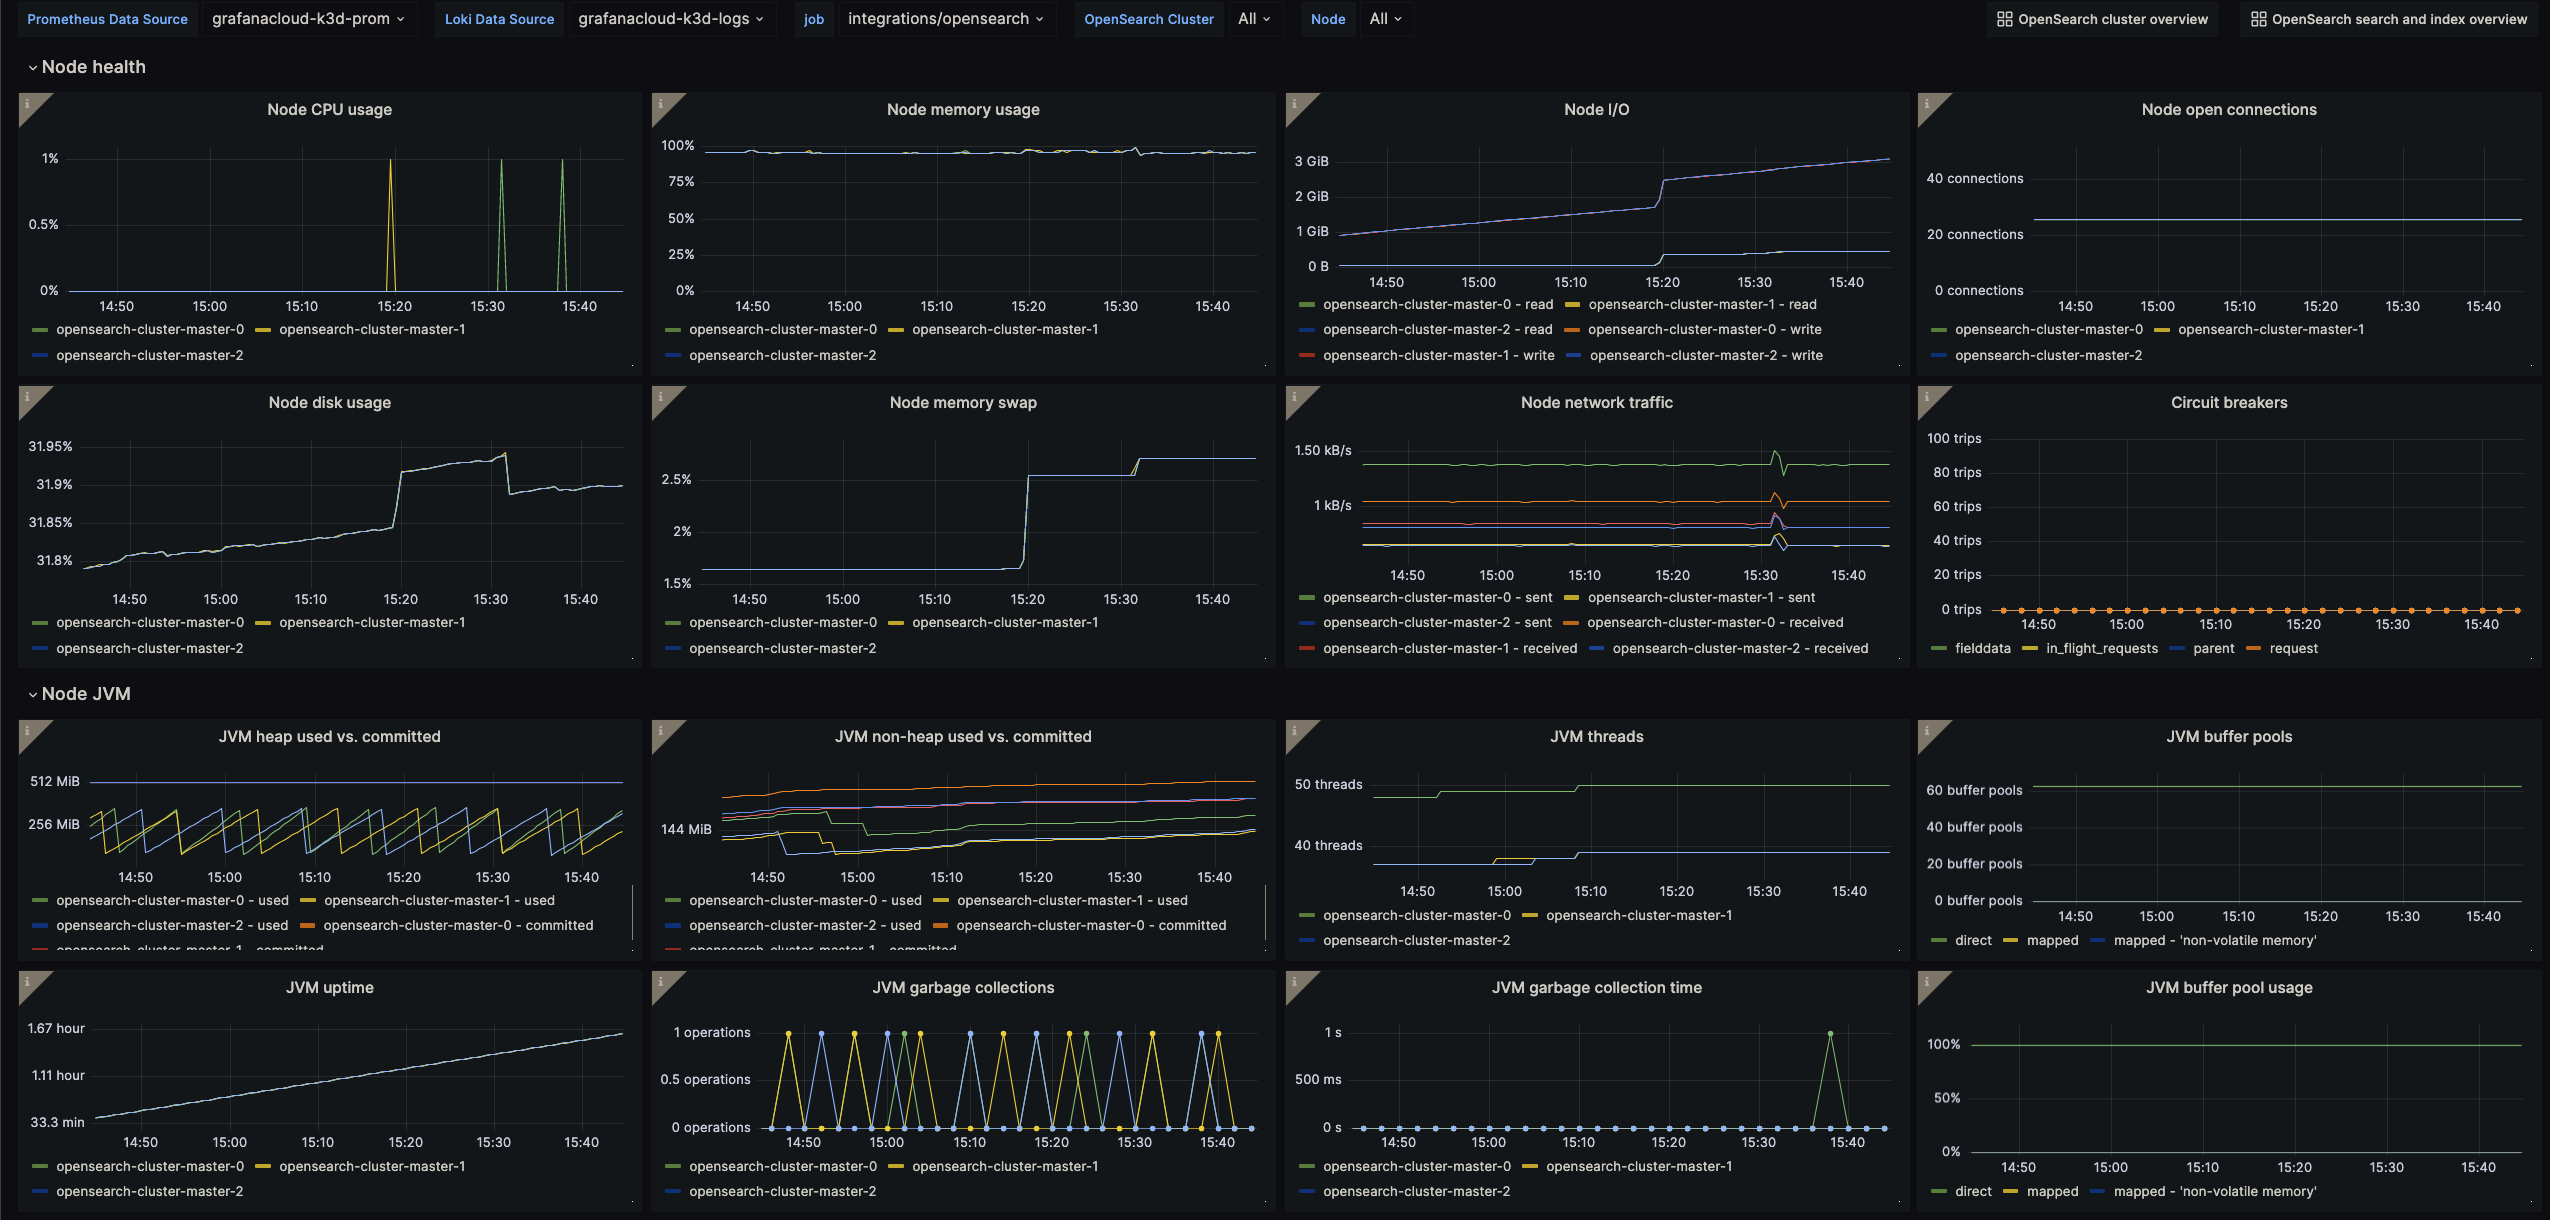
- OpenSearch node overview
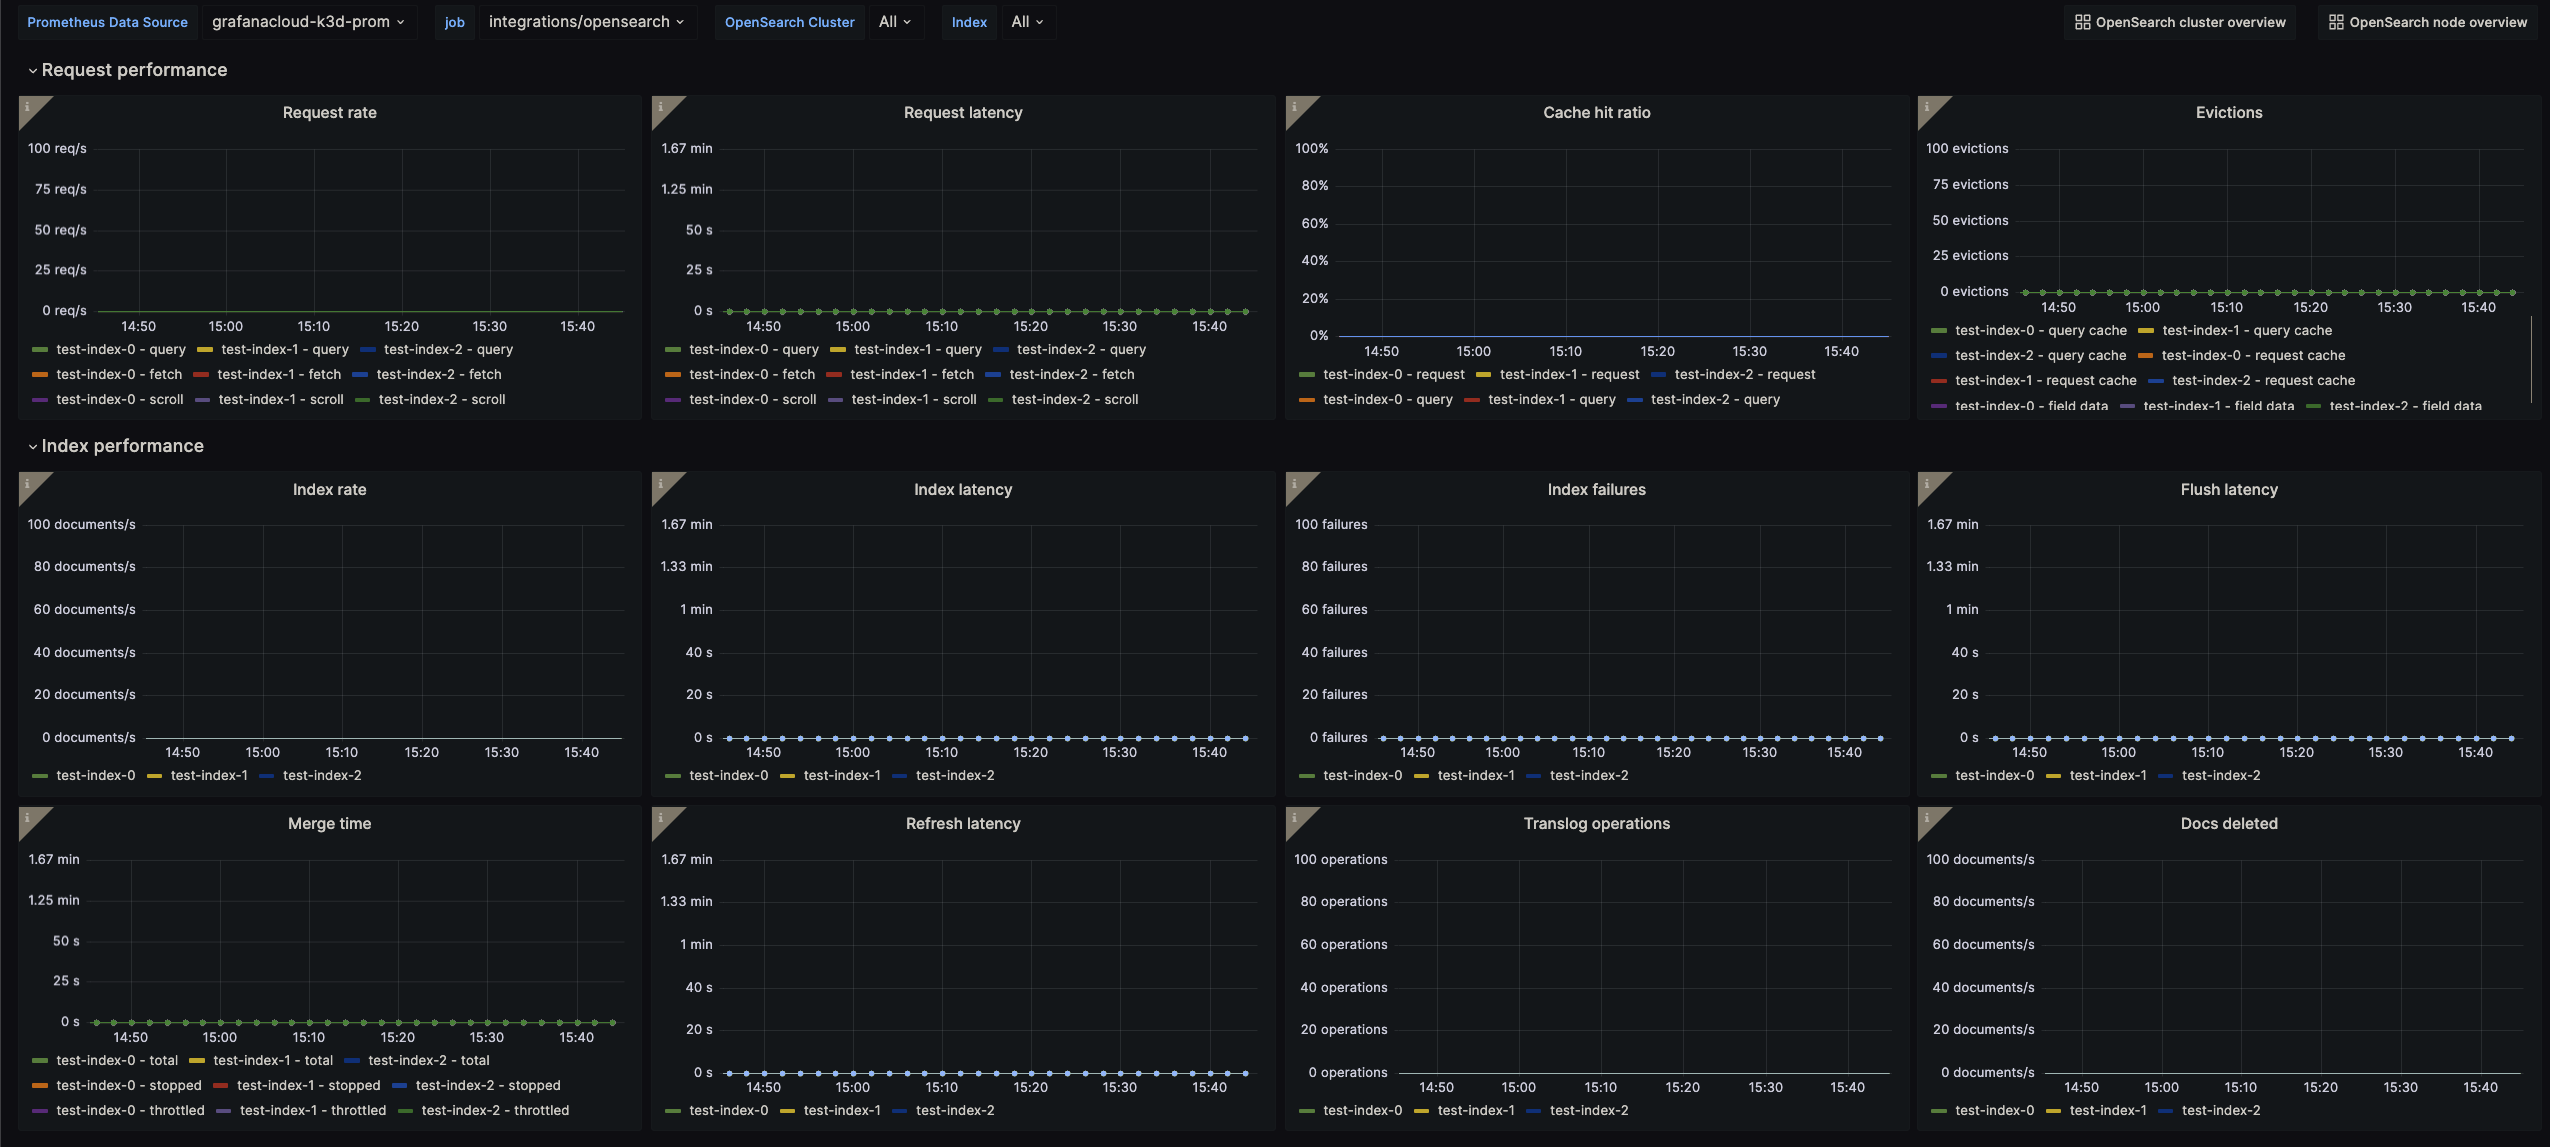
- OpenSearch search and index overview
OpenSearch Cluster Overview Dashboard 1
OpenSearch Node Overview Dashboard 1
OpenSearch Search and Index Overview Dashboard 1
Alerts
The OpenSearch integration includes the following useful alerts:
| Alert | Description |
|---|---|
| OpenSearchYellowCluster | Warning: At least one of the clusters is reporting a yellow status. |
| OpenSearchRedCluster | Critical: At least one of the clusters is reporting a red status. |
| OpenSearchUnstableShardReallocation | Warning: A node has gone offline or has been disconnected triggering shard reallocation. |
| OpenSearchUnstableShardUnassigned | Warning: There are shards that have been detected as unassigned. |
| OpenSearchModerateNodeDiskUsage | Warning: The node disk usage has exceeded the warning threshold. |
| OpenSearchHighNodeDiskUsage | Critical: The node disk usage has exceeded the critical threshold. |
| OpenSearchModerateNodeCpuUsage | Warning: The node CPU usage has exceeded the warning threshold. |
| OpenSearchHighNodeCpuUsage | Critical: The node CPU usage has exceeded the critical threshold. |
| OpenSearchModerateNodeMemoryUsage | Warning: The node memory usage has exceeded the warning threshold. |
| OpenSearchHighNodeMemoryUsage | Critical: The node memory usage has exceeded the critical threshold. |
| OpenSearchModerateRequestLatency | Warning: The request latency has exceeded the warning threshold. |
| OpenSearchModerateIndexLatency | Warning: The index latency has exceeded the warning threshold. |
Metrics
The most important metrics provided by the OpenSearch integration, which are used on the pre-built dashboards and Prometheus alerts, are as follows:
- opensearch_circuitbreaker_tripped_count
- opensearch_cluster_datanodes_number
- opensearch_cluster_nodes_number
- opensearch_cluster_pending_tasks_number
- opensearch_cluster_shards_active_percent
- opensearch_cluster_shards_number
- opensearch_cluster_status
- opensearch_cluster_task_max_waiting_time_seconds
- opensearch_fs_io_total_read_bytes
- opensearch_fs_io_total_write_bytes
- opensearch_fs_path_free_bytes
- opensearch_fs_path_total_bytes
- opensearch_index_fielddata_evictions_count
- opensearch_index_flush_total_count
- opensearch_index_flush_total_time_seconds
- opensearch_index_indexing_delete_current_number
- opensearch_index_indexing_index_count
- opensearch_index_indexing_index_current_number
- opensearch_index_indexing_index_failed_count
- opensearch_index_indexing_index_time_seconds
- opensearch_index_merges_current_size_bytes
- opensearch_index_merges_total_docs_count
- opensearch_index_merges_total_stopped_time_seconds
- opensearch_index_merges_total_throttled_time_seconds
- opensearch_index_merges_total_time_seconds
- opensearch_index_querycache_evictions_count
- opensearch_index_querycache_hit_count
- opensearch_index_querycache_memory_size_bytes
- opensearch_index_querycache_miss_number
- opensearch_index_refresh_total_count
- opensearch_index_refresh_total_time_seconds
- opensearch_index_requestcache_evictions_count
- opensearch_index_requestcache_hit_count
- opensearch_index_requestcache_memory_size_bytes
- opensearch_index_requestcache_miss_count
- opensearch_index_search_fetch_count
- opensearch_index_search_fetch_current_number
- opensearch_index_search_fetch_time_seconds
- opensearch_index_search_query_count
- opensearch_index_search_query_current_number
- opensearch_index_search_query_time_seconds
- opensearch_index_search_scroll_count
- opensearch_index_search_scroll_current_number
- opensearch_index_search_scroll_time_seconds
- opensearch_index_segments_memory_bytes
- opensearch_index_segments_number
- opensearch_index_shards_number
- opensearch_index_store_size_bytes
- opensearch_index_translog_operations_number
- opensearch_indices_indexing_index_count
- opensearch_indices_store_size_bytes
- opensearch_ingest_total_count
- opensearch_ingest_total_failed_count
- opensearch_ingest_total_time_seconds
- opensearch_jvm_bufferpool_number
- opensearch_jvm_bufferpool_total_capacity_bytes
- opensearch_jvm_bufferpool_used_bytes
- opensearch_jvm_gc_collection_count
- opensearch_jvm_gc_collection_time_seconds
- opensearch_jvm_mem_heap_committed_bytes
- opensearch_jvm_mem_heap_used_bytes
- opensearch_jvm_mem_nonheap_committed_bytes
- opensearch_jvm_mem_nonheap_used_bytes
- opensearch_jvm_threads_number
- opensearch_jvm_uptime_seconds
- opensearch_os_cpu_percent
- opensearch_os_mem_used_percent
- opensearch_os_swap_free_bytes
- opensearch_os_swap_used_bytes
- opensearch_threadpool_tasks_number
- opensearch_threadpool_threads_number
- opensearch_transport_rx_bytes_count
- opensearch_transport_server_open_number
- opensearch_transport_tx_bytes_count
- up
Changelog
# 0.0.2 - August 2023

* Add regex filter for logs datasource

# 0.0.1 - May 2023

* Initial release
Cost
By connecting your OpenSearch instance to Grafana Cloud, you might incur charges. To view information on the number of active series that your Grafana Cloud account uses for metrics included in each Cloud tier, see Active series and dpm usage and Cloud tier pricing.
Was this page helpful?
Related resources from Grafana Labs


