
MySQL integration for Grafana Cloud
MySQL is a managed, open source relational database that is a widely used for both small and large applications.
This integration includes 8 useful alerts and 2 pre-built dashboards to help monitor and visualize MySQL metrics and logs.
Before you begin
A running MySQL instance, user and password are required for the integration.
Supported versions:
- MySQL >= 5.6
- MariaDB >= 10.2
We recommend that you configure a separate user for the Agent, and give it only the strictly mandatory security privileges necessary for monitoring your node, as per the official documentation.
Install MySQL integration for Grafana Cloud
- In your Grafana Cloud stack, click Connections in the left-hand menu.
- Find MySQL and click its tile to open the integration.
- Review the prerequisites in the Configuration Details tab and set up Grafana Agent to send MySQL metrics and logs to your Grafana Cloud instance.
- Click Install to add this integration’s pre-built dashboards and alerts to your Grafana Cloud instance, and you can start monitoring your MySQL setup.
Configuration snippets for Grafana Alloy
Simple mode
These snippets are configured to scrape a single MySQL node with Grafana Alloy running locally.
Copy and Paste the following snippets into your Grafana Alloy configuration file.
Replace data_source_name value to your MySQL DSN connection details. It must follow the URI patterns defined in go-sql-driver README, which is [username[:password]@][protocol[(address)]]/dbname[?param1=value1&...¶mN=valueN].
If your MySQL server requires authentication, check the integration documentation to understand how to setup a secret file.
Integrations snippets
prometheus.exporter.mysql "integrations_mysqld_exporter" {
  data_source_name = "root:password@(localhost:3306)/"
}

discovery.relabel "integrations_mysqld_exporter" {
  targets = prometheus.exporter.mysql.integrations_mysqld_exporter.targets

  rule {
    target_label = "job"
    replacement  = "integrations/mysql"
  }

  rule {
    target_label = "instance"
    replacement  = constants.hostname
  }
}

prometheus.scrape "integrations_mysqld_exporter" {
  targets    = discovery.relabel.integrations_mysqld_exporter.output
  forward_to = [prometheus.remote_write.metrics_service.receiver]
  job_name   = "integrations/mysqld_exporter"
}
Logs snippets
all
local.file_match "logs_integrations_mysql" {
  path_targets = [{
    __address__ = "localhost",
    __path__    = "/var/log/mysql/*.log",
    instance    = constants.hostname,
    job         = "integrations/mysql",
  }]
}

loki.process "logs_integrations_mysql" {
  forward_to = [loki.write.grafana_cloud_loki.receiver]

  stage.regex {
    expression = "(?P<timestamp>.+) (?P<thread>[\\d]+) \\[(?P<label>.+?)\\]( \\[(?P<err_code>.+?)\\] \\[(?P<subsystem>.+?)\\])? (?P<msg>.+)"
  }

  stage.labels {
    values = {
      err_code  = null,
      level     = "label",
      subsystem = null,
    }
  }

  stage.drop {
    drop_counter_reason = "drop empty lines"
    expression          = "^ *$"
  }
}

loki.source.file "logs_integrations_mysql" {
  targets    = local.file_match.logs_integrations_mysql.targets
  forward_to = [loki.process.logs_integrations_mysql.receiver]
}
Advanced mode
The following snippets provide examples to guide you through the configuration process.
To instruct Grafana Alloy to scrape your MySQL server, manually copy and append the snippets to your alloy configuration file, then follow subsequent instructions.
Advanced integrations snippets
local.file "mysql_secret" {
  filename = "/var/lib/grafana-agent-flow/mysql-secret"
  is_secret = true
}

prometheus.exporter.mysql "integrations_mysqld_exporter" {
  data_source_name = local.file.mysql_secret.content
}

discovery.relabel "integrations_mysqld_exporter" {
  targets = prometheus.exporter.mysql.integrations_mysqld_exporter.targets

  rule {
    target_label = "job"
    replacement  = "integrations/mysql"
  }

  rule {
    target_label = "instance"
    replacement  = constants.hostname
  }
}

prometheus.scrape "integrations_mysqld_exporter" {
  targets    = discovery.relabel.integrations_mysqld_exporter.output
  forward_to = [prometheus.remote_write.metrics_service.receiver]
  job_name   = "integrations/mysqld_exporter"
}
This integration uses the prometheus.exporter.mysql component to collect metrics from a MySQL instance.
For better security, your DSN containing authentication details will be stored in a file, and loaded by the Grafana Agent as a secret. The snippets are prepared to read from /var/lib/grafana-agent-flow/mysql-secret. It must follow the URI patterns defined in go-sql-driver README, which is [username[:password]@][protocol[(address)]]/dbname[?param1=value1&...¶mN=valueN].
You can create this file using the following command;
echo -n 'user:password@(hostname:3306)/' > /var/lib/grafana-agent-flow/mysql-secret
For the full array of options included within this exporter, please check the component documentation.
This exporter must be linked with a discovery.relabel component to apply the necessary relabelings. For each MySQL instance to be monitored you must create a pair of these components.
The snippets set the instance label to your Grafana Alloy server hostname using the constants.hostname variable. If you are running Grafana Alloy outside of your MySQL server host, change the variable to a value that uniquely identifies it.
You can then scrape them by including each discovery.relabel under targets within the prometheus.scrape component.
Advanced logs snippets
darwin
local.file_match "logs_integrations_mysql" {
  path_targets = [{
    __address__ = "localhost",
    __path__    = "/var/log/mysql/*.log",
    instance    = constants.hostname,
    job         = "integrations/mysql",
  }]
}

loki.process "logs_integrations_mysql" {
  forward_to = [loki.write.grafana_cloud_loki.receiver]

  stage.regex {
    expression = "(?P<timestamp>.+) (?P<thread>[\\d]+) \\[(?P<label>.+?)\\]( \\[(?P<err_code>.+?)\\] \\[(?P<subsystem>.+?)\\])? (?P<msg>.+)"
  }

  stage.labels {
    values = {
      err_code  = null,
      level     = "label",
      subsystem = null,
    }
  }

  stage.drop {
    drop_counter_reason = "drop empty lines"
    expression          = "^ *$"
  }
}

loki.source.file "logs_integrations_mysql" {
  targets    = local.file_match.logs_integrations_mysql.targets
  forward_to = [loki.process.logs_integrations_mysql.receiver]
}
To collect your MySQL Server logs, you must use a local.file_match component to tag the file to be scraped, a loki.source.file component to prepare it for Loki ingestion and a loki.process component to process your logs with adequate labels and drop empty lines.
You can check the full array of options in each component documentation.
linux
local.file_match "logs_integrations_mysql" {
  path_targets = [{
    __address__ = "localhost",
    __path__    = "/var/log/mysql/*.log",
    instance    = constants.hostname,
    job         = "integrations/mysql",
  }]
}

loki.process "logs_integrations_mysql" {
  forward_to = [loki.write.grafana_cloud_loki.receiver]

  stage.regex {
    expression = "(?P<timestamp>.+) (?P<thread>[\\d]+) \\[(?P<label>.+?)\\]( \\[(?P<err_code>.+?)\\] \\[(?P<subsystem>.+?)\\])? (?P<msg>.+)"
  }

  stage.labels {
    values = {
      err_code  = null,
      level     = "label",
      subsystem = null,
    }
  }

  stage.drop {
    drop_counter_reason = "drop empty lines"
    expression          = "^ *$"
  }
}

loki.source.file "logs_integrations_mysql" {
  targets    = local.file_match.logs_integrations_mysql.targets
  forward_to = [loki.process.logs_integrations_mysql.receiver]
}
To collect your MySQL Server logs, you must use a local.file_match component to tag the file to be scraped, a loki.source.file component to prepare it for Loki ingestion and a loki.process component to process your logs with adequate labels and drop empty lines.
You can check the full array of options in each component documentation.
windows
local.file_match "logs_integrations_mysql" {
  path_targets = [{
    __address__ = "localhost",
    __path__    = "/var/log/mysql/*.log",
    instance    = constants.hostname,
    job         = "integrations/mysql",
  }]
}

loki.process "logs_integrations_mysql" {
  forward_to = [loki.write.grafana_cloud_loki.receiver]

  stage.regex {
    expression = "(?P<timestamp>.+) (?P<thread>[\\d]+) \\[(?P<label>.+?)\\]( \\[(?P<err_code>.+?)\\] \\[(?P<subsystem>.+?)\\])? (?P<msg>.+)"
  }

  stage.labels {
    values = {
      err_code  = null,
      level     = "label",
      subsystem = null,
    }
  }

  stage.drop {
    drop_counter_reason = "drop empty lines"
    expression          = "^ *$"
  }
}

loki.source.file "logs_integrations_mysql" {
  targets    = local.file_match.logs_integrations_mysql.targets
  forward_to = [loki.process.logs_integrations_mysql.receiver]
}
To collect your MySQL Server logs, you must use a local.file_match component to tag the file to be scraped, a loki.source.file component to prepare it for Loki ingestion and a loki.process component to process your logs with adequate labels and drop empty lines.
You can check the full array of options in each component documentation.
Grafana Agent static configuration (deprecated)
The following section shows configuration for running Grafana Agent in static mode which is deprecated. You should use Grafana Alloy for all new deployments.
Before you begin
A running MySQL instance, user and password are required for the integration.
Supported versions:
- MySQL >= 5.6
- MariaDB >= 10.2
We recommend that you configure a separate user for the Agent, and give it only the strictly mandatory security privileges necessary for monitoring your node, as per the official documentation.
Install MySQL integration for Grafana Cloud
- In your Grafana Cloud stack, click Connections in the left-hand menu.
- Find MySQL and click its tile to open the integration.
- Review the prerequisites in the Configuration Details tab and set up Grafana Agent to send MySQL metrics and logs to your Grafana Cloud instance.
- Click Install to add this integration’s pre-built dashboards and alerts to your Grafana Cloud instance, and you can start monitoring your MySQL setup.
Post-install configuration for the MySQL integration
This integration is configured to work with the mysqld_exporter, which is embedded in Grafana Agent.
Enable the integration by manually adding the provided snippets to your agent configuration file.
This integration supports metrics and logs from MySQL. In order to see those signals correlated on your dashboard, as a single pane of glass, ensure the following:
jobandinstancelabels must match formysql_integration(metrics) andlogsin the Agent configuration file.joblabel must be set tointegrations/mysql(already configured in the snippets).instancelabel must be set to a value that uniquely identifies your MySQL Node. Replace it manually, according to your environment. Note that if you uselocalhostfor multiple nodes, the dashboards will not be able to filter correctly by instance.
Please note that the value under data_source_name snippet parameter must follow the URI patterns defined in go-sql-driver README, which is [username[:password]@][protocol[(address)]]/dbname[?param1=value1&...¶mN=valueN].
If you set the MYSQL_ALLOW_EMPTY_PASSWORD flag on your MySQL Node configuration, you can omit the password in the URI.
For a full description of configuration options see how to configure the mysqld_exporter_config block in the agent documentation.
Configuration snippets for Grafana Agent
Below integrations, insert the following lines and change the URLs according to your environment:
  mysqld_exporter:
    enabled: true
    instance: '<your-instance-name>' # must match instance used in logs
    data_source_name: 'root:password@(localhost:3306)/' # replace with your connection string
    relabel_configs:
      - target_label: job
        replacement: 'integrations/mysql' # must match job used in logs
Below logs.configs.scrape_configs, insert the following lines according to your environment.
    - job_name: integrations/mysql
      static_configs:
        - labels:
            instance: '<your-instance-name>' # must match instance used in mysqld_exporter
            job: integrations/mysql # must match job used in mysqld_exporter
            __path__: /var/log/mysql/*.log
      pipeline_stages:
        - regex:
              expression: '(?P<timestamp>.+) (?P<thread>[\d]+) \[(?P<label>.+?)\]( \[(?P<err_code>.+?)\] \[(?P<subsystem>.+?)\])? (?P<msg>.+)'
        - labels:
            level: label
            err_code:
            subsystem:
        - drop:
            expression: "^ *$"
            drop_counter_reason: "drop empty lines"
Full example configuration for Grafana Agent
Refer to the following Grafana Agent configuration for a complete example that contains all the snippets used for the MySQL integration. This example also includes metrics that are sent to monitor your Grafana Agent instance.
integrations:
  prometheus_remote_write:
  - basic_auth:
      password: <your_prom_pass>
      username: <your_prom_user>
    url: <your_prom_url>
  agent:
    enabled: true
    relabel_configs:
    - action: replace
      source_labels:
      - agent_hostname
      target_label: instance
    - action: replace
      target_label: job
      replacement: "integrations/agent-check"
    metric_relabel_configs:
    - action: keep
      regex: (prometheus_target_sync_length_seconds_sum|prometheus_target_scrapes_.*|prometheus_target_interval.*|prometheus_sd_discovered_targets|agent_build.*|agent_wal_samples_appended_total|process_start_time_seconds)
      source_labels:
      - __name__
  # Add here any snippet that belongs to the `integrations` section.
  # For a correct indentation, paste snippets copied from Grafana Cloud at the beginning of the line.
  mysqld_exporter:
    enabled: true
    instance: '<your-instance-name>' # must match instance used in logs
    data_source_name: 'root:password@(localhost:3306)/' # replace with your connection string
    relabel_configs:
      - target_label: job
        replacement: 'integrations/mysql' # must match job used in logs
logs:
  configs:
  - clients:
    - basic_auth:
        password: <your_loki_pass>
        username: <your_loki_user>
      url: <your_loki_url>
    name: integrations
    positions:
      filename: /tmp/positions.yaml
    scrape_configs:
      # Add here any snippet that belongs to the `logs.configs.scrape_configs` section.
      # For a correct indentation, paste snippets copied from Grafana Cloud at the beginning of the line.
    - job_name: integrations/mysql
      static_configs:
        - labels:
            instance: '<your-instance-name>' # must match instance used in mysqld_exporter
            job: integrations/mysql # must match job used in mysqld_exporter
            __path__: /var/log/mysql/*.log
      pipeline_stages:
        - regex:
              expression: '(?P<timestamp>.+) (?P<thread>[\d]+) \[(?P<label>.+?)\]( \[(?P<err_code>.+?)\] \[(?P<subsystem>.+?)\])? (?P<msg>.+)'
        - labels:
            level: label
            err_code:
            subsystem:
        - drop:
            expression: "^ *$"
            drop_counter_reason: "drop empty lines"
metrics:
  configs:
  - name: integrations
    remote_write:
    - basic_auth:
        password: <your_prom_pass>
        username: <your_prom_user>
      url: <your_prom_url>
    scrape_configs:
      # Add here any snippet that belongs to the `metrics.configs.scrape_configs` section.
      # For a correct indentation, paste snippets copied from Grafana Cloud at the beginning of the line.
  global:
    scrape_interval: 60s
  wal_directory: /tmp/grafana-agent-wal
Dashboards
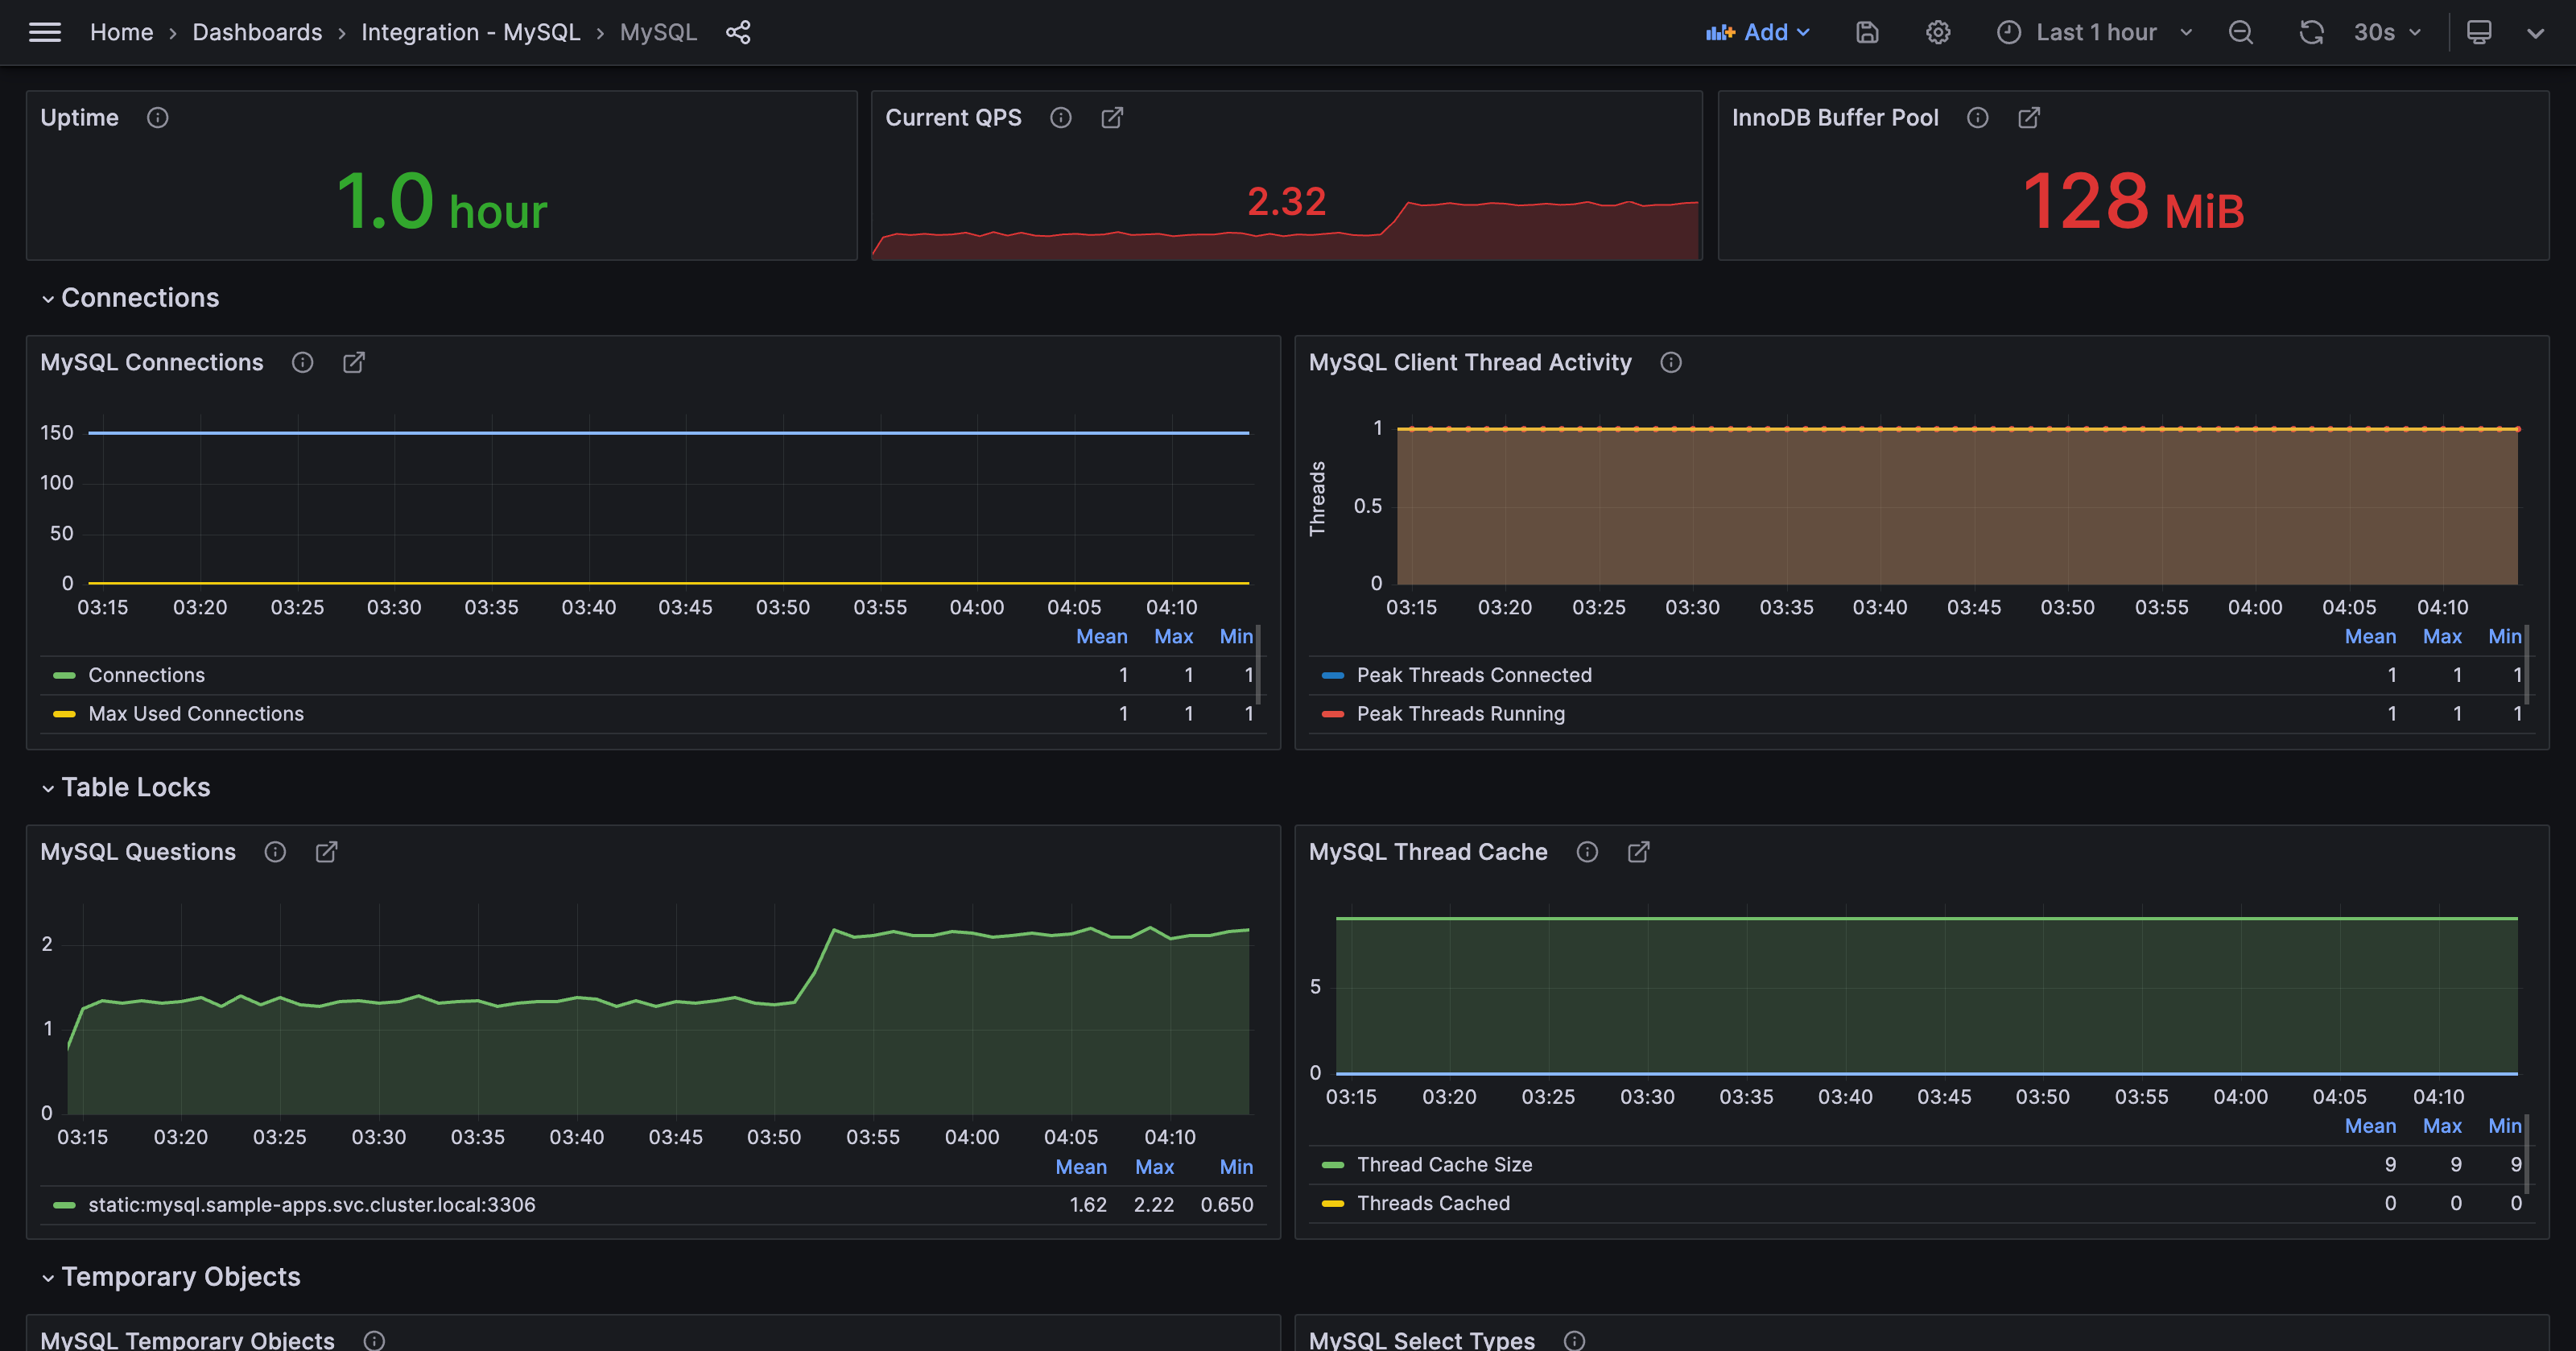
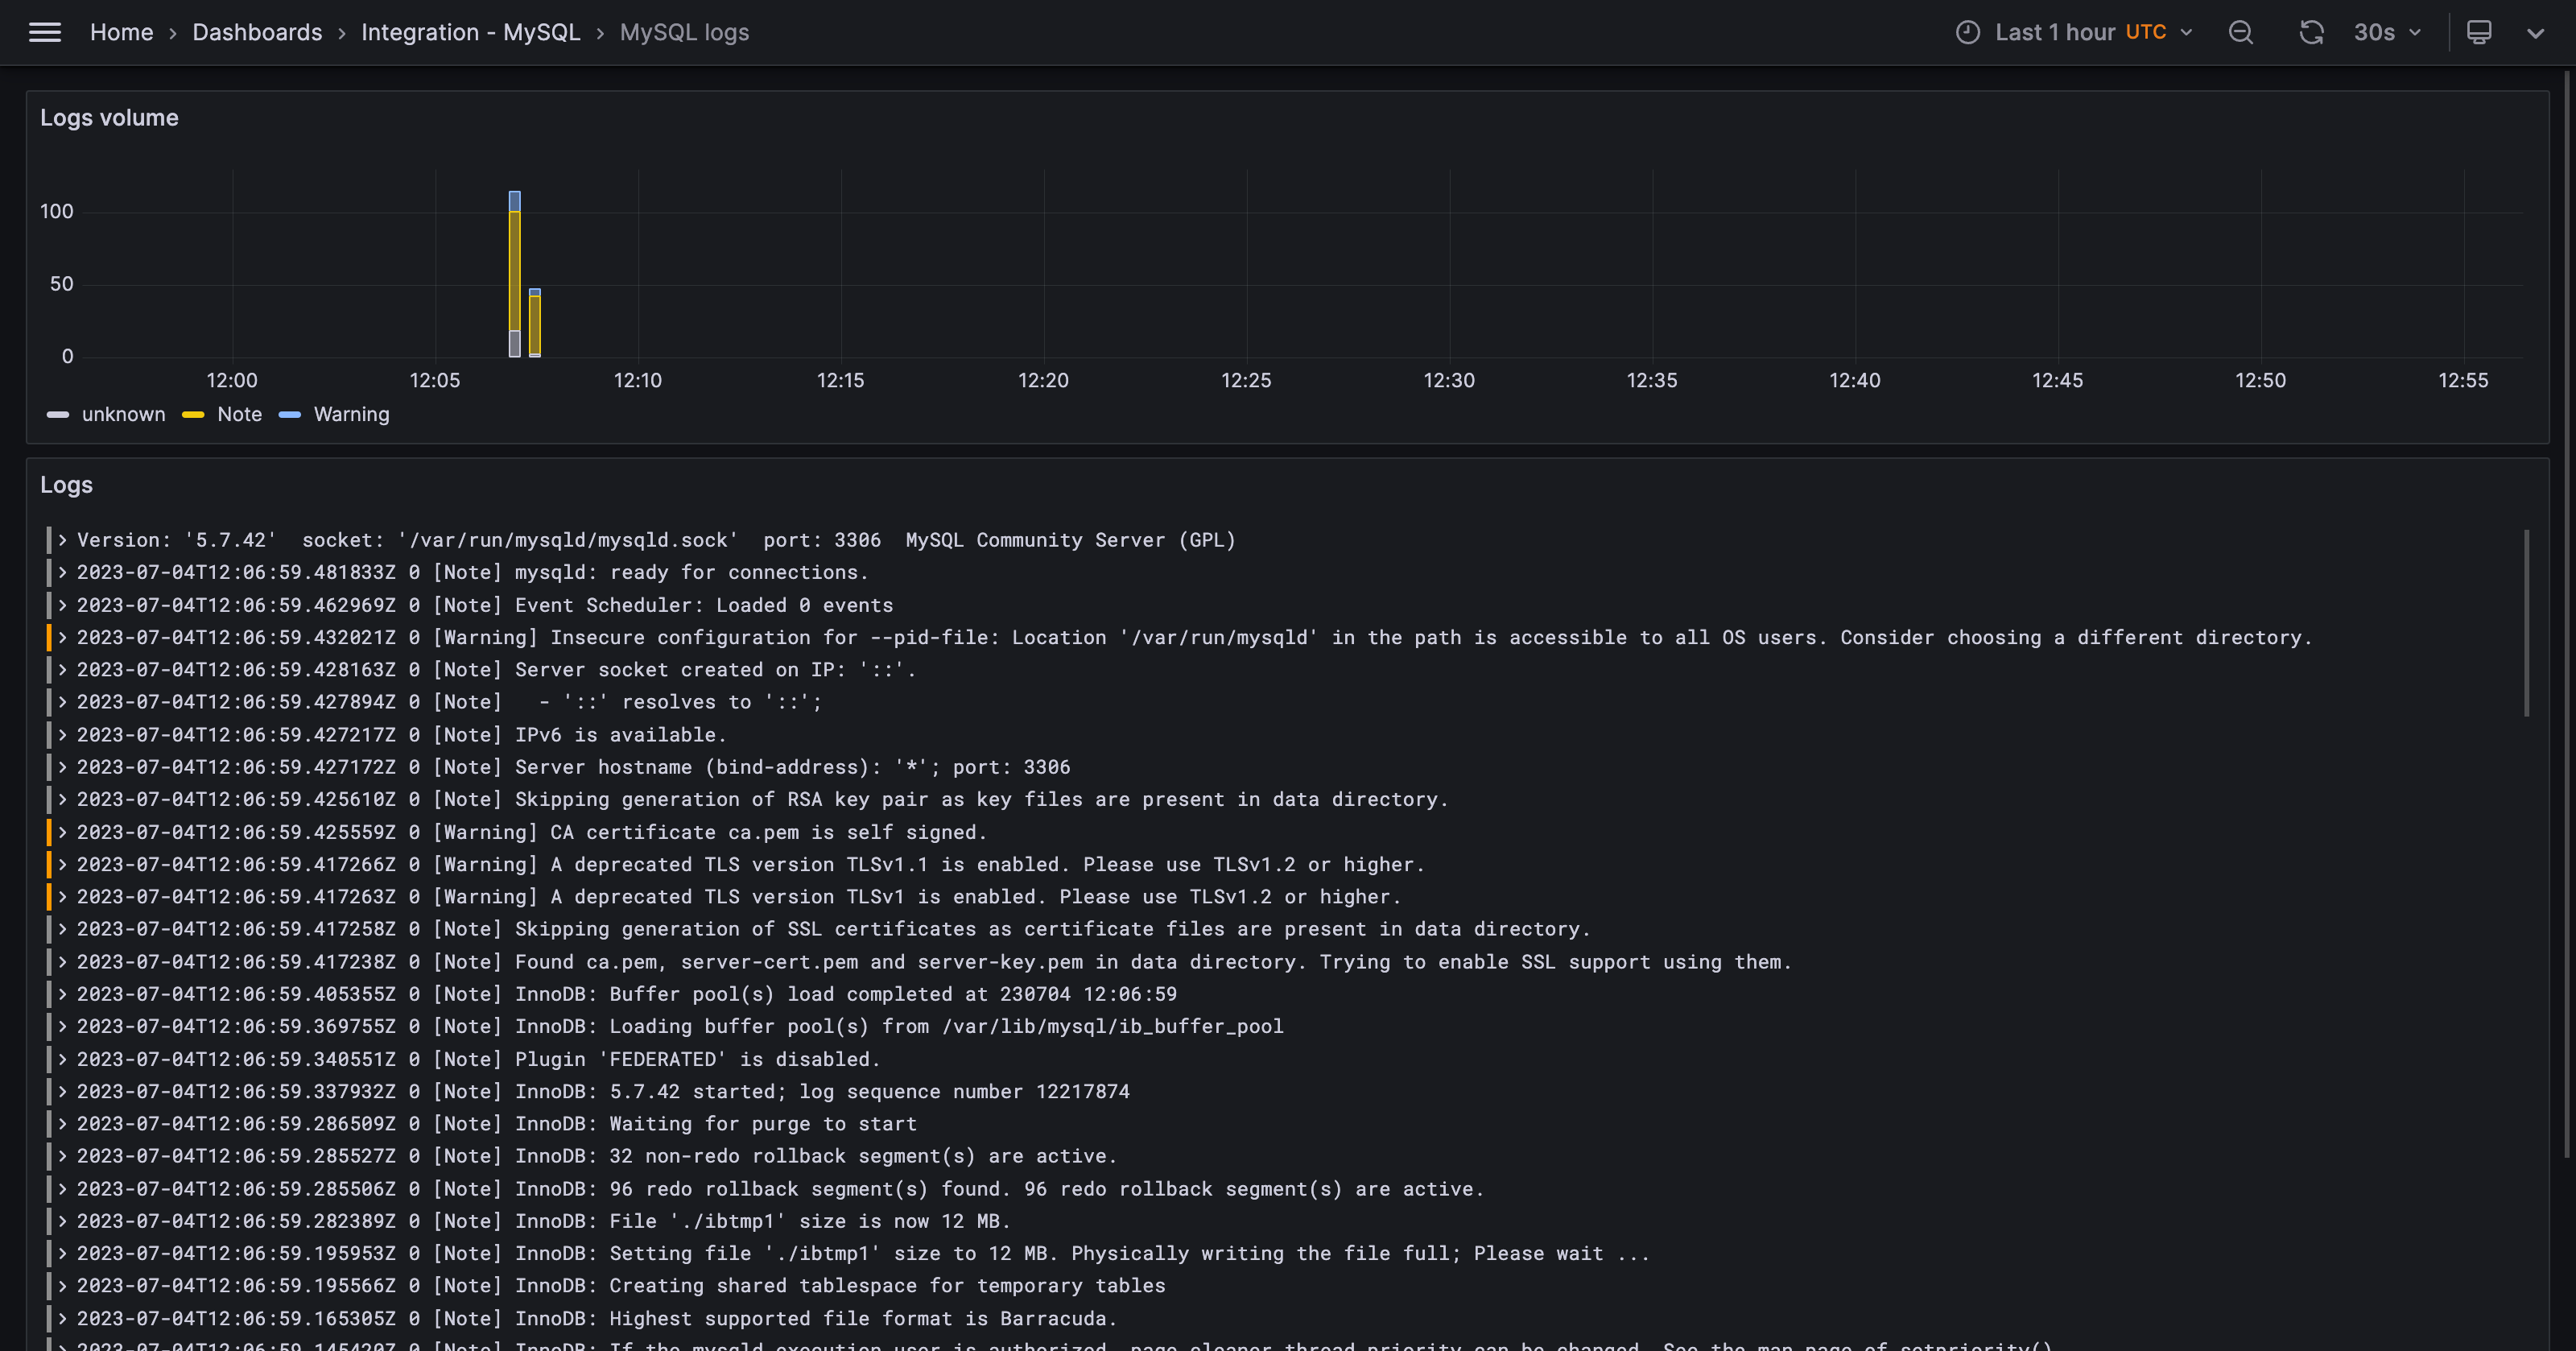
The MySQL integration installs the following dashboards in your Grafana Cloud instance to help monitor your system.
- MySQL
- MySQL logs
MySQL overview
MySQL logs
Alerts
The MySQL integration includes the following useful alerts:
MySQLdAlerts
| Alert | Description |
|---|---|
| MySQLDown | Critical: MySQL not up. |
GaleraAlerts
| Alert | Description |
|---|---|
| MySQLGaleraNotReady | Warning: Galera cluster node not ready. |
| MySQLGaleraOutOfSync | Warning: Galera cluster node out of sync. |
| MySQLGaleraDonorFallingBehind | Warning: XtraDB cluster donor node falling behind. |
| MySQLReplicationNotRunning | Critical: Replication is not running. |
| MySQLReplicationLag | Critical: MySQL slave replication is lagging. |
| MySQLHeartbeatLag | Critical: MySQL heartbeat is lagging. |
| MySQLInnoDBLogWaits | Warning: MySQL innodb log writes stalling. |
Metrics
The most important metrics provided by the MySQL integration, which are used on the pre-built dashboards and Prometheus alerts, are as follows:
- instance:mysql_heartbeat_lag_seconds
- instance:mysql_slave_lag_seconds
- mysql_global_status_aborted_clients
- mysql_global_status_aborted_connects
- mysql_global_status_buffer_pool_pages
- mysql_global_status_bytes_received
- mysql_global_status_bytes_sent
- mysql_global_status_commands_total
- mysql_global_status_created_tmp_disk_tables
- mysql_global_status_created_tmp_files
- mysql_global_status_created_tmp_tables
- mysql_global_status_handlers_total
- mysql_global_status_innodb_log_waits
- mysql_global_status_innodb_mem_adaptive_hash
- mysql_global_status_innodb_mem_dictionary
- mysql_global_status_innodb_num_open_files
- mysql_global_status_innodb_page_size
- mysql_global_status_max_used_connections
- mysql_global_status_open_files
- mysql_global_status_open_table_definitions
- mysql_global_status_open_tables
- mysql_global_status_opened_files
- mysql_global_status_opened_table_definitions
- mysql_global_status_opened_tables
- mysql_global_status_qcache_free_memory
- mysql_global_status_qcache_hits
- mysql_global_status_qcache_inserts
- mysql_global_status_qcache_lowmem_prunes
- mysql_global_status_qcache_not_cached
- mysql_global_status_qcache_queries_in_cache
- mysql_global_status_queries
- mysql_global_status_questions
- mysql_global_status_select_full_join
- mysql_global_status_select_full_range_join
- mysql_global_status_select_range
- mysql_global_status_select_range_check
- mysql_global_status_select_scan
- mysql_global_status_slow_queries
- mysql_global_status_sort_merge_passes
- mysql_global_status_sort_range
- mysql_global_status_sort_rows
- mysql_global_status_sort_scan
- mysql_global_status_table_locks_immediate
- mysql_global_status_table_locks_waited
- mysql_global_status_table_open_cache_hits
- mysql_global_status_table_open_cache_misses
- mysql_global_status_table_open_cache_overflows
- mysql_global_status_threads_cached
- mysql_global_status_threads_connected
- mysql_global_status_threads_created
- mysql_global_status_threads_running
- mysql_global_status_uptime
- mysql_global_status_wsrep_local_recv_queue
- mysql_global_status_wsrep_local_state
- mysql_global_status_wsrep_ready
- mysql_global_variables_innodb_additional_mem_pool_size
- mysql_global_variables_innodb_buffer_pool_size
- mysql_global_variables_innodb_log_buffer_size
- mysql_global_variables_key_buffer_size
- mysql_global_variables_max_connections
- mysql_global_variables_open_files_limit
- mysql_global_variables_query_cache_size
- mysql_global_variables_table_definition_cache
- mysql_global_variables_table_open_cache
- mysql_global_variables_thread_cache_size
- mysql_global_variables_tokudb_cache_size
- mysql_global_variables_wsrep_desync
- mysql_heartbeat_now_timestamp_seconds
- mysql_heartbeat_stored_timestamp_seconds
- mysql_info_schema_processlist_threads
- mysql_slave_status_seconds_behind_master
- mysql_slave_status_slave_io_running
- mysql_slave_status_slave_sql_running
- mysql_slave_status_sql_delay
- mysql_up
- up
Changelog
# 1.0.2 - January 2024

* Allow selection of "all" clusters on MySQL overview dashboard, allowing the display of metrics which do not have the cluster tag.

# 1.0.1 - August 2023

* Add regex filter for logs datasource

# 1.0.0 - August 2023

* Add Kubernetes instructions
* Switch panels to timeseries type
* Fix stat panels to use 'last' aggegation instead of 'mean'
* Chain job and instance variables

# 0.1.1 - July 2023

* New Filter Metrics option for configuring the Grafana Agent, which saves on metrics cost by dropping any metric not used by this integration. Beware that anything custom built using metrics that are not on the snippet will stop working.
* New hostname relabel option, which applies the instance name you write on the text box to the Grafana Agent configuration snippets, making it easier and less error prone to configure this mandatory label.

# 0.1.0 - July 2023

* Updated logs dashboard
* Updated alerts annotations

# 0.0.5 - November 2022

* Add integration status panel

# 0.0.4 - April 2022

* Updated documentation and agent config snippets

# 0.0.3 - February 2022

* Added logs support from Loki datasource

# 0.0.2 - October 2021

* Update all rate queries to use `$__rate_interval`

# 0.0.1 - October 2020

* Initial release
Cost
By connecting your MySQL instance to Grafana Cloud, you might incur charges. To view information on the number of active series that your Grafana Cloud account uses for metrics included in each Cloud tier, see Active series and dpm usage and Cloud tier pricing.
Was this page helpful?
Related resources from Grafana Labs


