
MongoDB integration for Grafana Cloud
MongoDB is a general purpose, document-based, distributed database built for modern application developers and for the cloud era.
This integration includes 7 useful alerts and 3 pre-built dashboards to help monitor and visualize MongoDB metrics.
Before you begin
We strongly recommend that you configure a separate user for Grafana Alloy and give it only the strictly mandatory security privileges necessary for monitoring your node.
Install MongoDB integration for Grafana Cloud
- In your Grafana Cloud stack, click Connections in the left-hand menu.
- Find MongoDB and click its tile to open the integration.
- Review the prerequisites in the Configuration Details tab and set up Grafana Agent to send MongoDB metrics to your Grafana Cloud instance.
- Click Install to add this integration’s pre-built dashboards and alerts to your Grafana Cloud instance, and you can start monitoring your MongoDB setup.
Configuration snippets for Grafana Alloy
Advanced mode
To instruct Grafana Alloy to scrape your MongoDB nodes, go though the subsequent instructions.
The snippets provide examples to guide you through the configuration process.
First, manually copy and append the following snippets into your Grafana Alloy configuration file.
Then follow the instructions below to modify the necessary variables.
Advanced integrations snippets
prometheus.exporter.mongodb "integrations_mongodb_exporter" {
    mongodb_uri    = "mongodb://username:password:<hostname>:27017"
    direct_connect = true
}
discovery.relabel "integrations_mongodb_exporter" {
    targets = prometheus.exporter.mongodb.integrations_mongodb_exporter.targets

    rule {
        target_label = "service_name"
        replacement  = "<your-service-name>"
    }

    rule {
        target_label = "mongodb_cluster"
        replacement  = "<your-cluster-name>"
    }

    rule {
        target_label = "instance"
        replacement  = "<your-instance-name>"
    }
}
prometheus.scrape "integrations_mongodb_exporter" {
    targets    = discovery.relabel.integrations_mongodb_exporter.output
    forward_to = [prometheus.remote_write.metrics_service.receiver]
    job_name   = "integrations/mongodb_exporter"
}
Add a pair of prometheus.exporter.mongodb and discovery.relabel to your Grafana Alloy configuration file for each MongoDB node you monitor, to avoid instance label conflicts.
Configure the following property within the prometheus.exporter.mongodb component:
mongodb_uri: The URI to connect to your MongoDB node.
Refer to prometheus.exporter.mongod in Grafana Alloy reference documentation for a complete description of the configuration options.
Configure the following properties within the discovery.relabel component:
<your-instance-name>: Theinstancelabel for all metrics from this MongoDB node.<your-cluster-name>: Themongodb_clusterlabel to group your Kafka nodes within a cluster. Set the same value for all nodes within your cluster.<your-service-name>: The label used to group your nodes by type, for example, “Mongos”, “ConfigServer”, “Shard”. This will be used to filter by node type on your dashboards.
Finally, reference each discovery.relabel component within the targets property of the prometheus.scrape component.
Grafana Agent static configuration (deprecated)
The following section shows configuration for running Grafana Agent in static mode which is deprecated. You should use Grafana Alloy for all new deployments.
Before you begin
This integration relies on a running MongoDB instance, with a configured user and password.
We strongly recommend that you configure a separate user for the Agent, and give it only the strictly mandatory security privileges necessary for monitoring your node, as per the official documentation.
Install MongoDB integration for Grafana Cloud
- In your Grafana Cloud stack, click Connections in the left-hand menu.
- Find MongoDB and click its tile to open the integration.
- Review the prerequisites in the Configuration Details tab and set up Grafana Agent to send MongoDB metrics to your Grafana Cloud instance.
- Click Install to add this integration’s pre-built dashboards and alerts to your Grafana Cloud instance, and you can start monitoring your MongoDB setup.
Post-install configuration for the MongoDB integration
This integration is configured to work with the mongodb_exporter, which is embedded in Grafana Agent.
Enable the integration by manually adding the provided snippet to your agent configuration file.
You must configure two custom labels for this integration:
service_name, which is how you identify this node in your cluster (example: mongodb).mongodb_cluster, which is the name of your mongodb cluster, and must be set the same value for all nodes composing the cluster (example: mongodb-cluster).
The config snippet already places the necessary relabel_configs, just replace the values according to your environment and needs.
Make sure that you change the mongodb_uri according to your environment.
For a full description of configuration options see how to configure the mongodb_exporter_config block in the agent documentation.
Configuration snippets for Grafana Agent
Below integrations, insert the following lines and change the URLs according to your environment:
  mongodb_exporter:
    enabled: true
    mongodb_uri: 'mongodb://username:password:<hostname>:27017' # replace with your connection string
    relabel_configs:
    - target_label: service_name
      replacement: 'mongodb'
    - target_label: mongodb_cluster
      replacement: 'your-cluster-name'
    - target_label: instance
      replacement: '<your-instance-name>'
Full example configuration for Grafana Agent
Refer to the following Grafana Agent configuration for a complete example that contains all the snippets used for the MongoDB integration. This example also includes metrics that are sent to monitor your Grafana Agent instance.
integrations:
  prometheus_remote_write:
  - basic_auth:
      password: <your_prom_pass>
      username: <your_prom_user>
    url: <your_prom_url>
  agent:
    enabled: true
    relabel_configs:
    - action: replace
      source_labels:
      - agent_hostname
      target_label: instance
    - action: replace
      target_label: job
      replacement: "integrations/agent-check"
    metric_relabel_configs:
    - action: keep
      regex: (prometheus_target_sync_length_seconds_sum|prometheus_target_scrapes_.*|prometheus_target_interval.*|prometheus_sd_discovered_targets|agent_build.*|agent_wal_samples_appended_total|process_start_time_seconds)
      source_labels:
      - __name__
  # Add here any snippet that belongs to the `integrations` section.
  # For a correct indentation, paste snippets copied from Grafana Cloud at the beginning of the line.
  mongodb_exporter:
    enabled: true
    mongodb_uri: 'mongodb://username:password:<hostname>:27017' # replace with your connection string
    relabel_configs:
    - target_label: service_name
      replacement: 'mongodb'
    - target_label: mongodb_cluster
      replacement: 'your-cluster-name'
    - target_label: instance
      replacement: '<your-instance-name>'
logs:
  configs:
  - clients:
    - basic_auth:
        password: <your_loki_pass>
        username: <your_loki_user>
      url: <your_loki_url>
    name: integrations
    positions:
      filename: /tmp/positions.yaml
    scrape_configs:
      # Add here any snippet that belongs to the `logs.configs.scrape_configs` section.
      # For a correct indentation, paste snippets copied from Grafana Cloud at the beginning of the line.
metrics:
  configs:
  - name: integrations
    remote_write:
    - basic_auth:
        password: <your_prom_pass>
        username: <your_prom_user>
      url: <your_prom_url>
    scrape_configs:
      # Add here any snippet that belongs to the `metrics.configs.scrape_configs` section.
      # For a correct indentation, paste snippets copied from Grafana Cloud at the beginning of the line.
  global:
    scrape_interval: 60s
  wal_directory: /tmp/grafana-agent-wal
Dashboards
The MongoDB integration installs the following dashboards in your Grafana Cloud instance to help monitor your system.
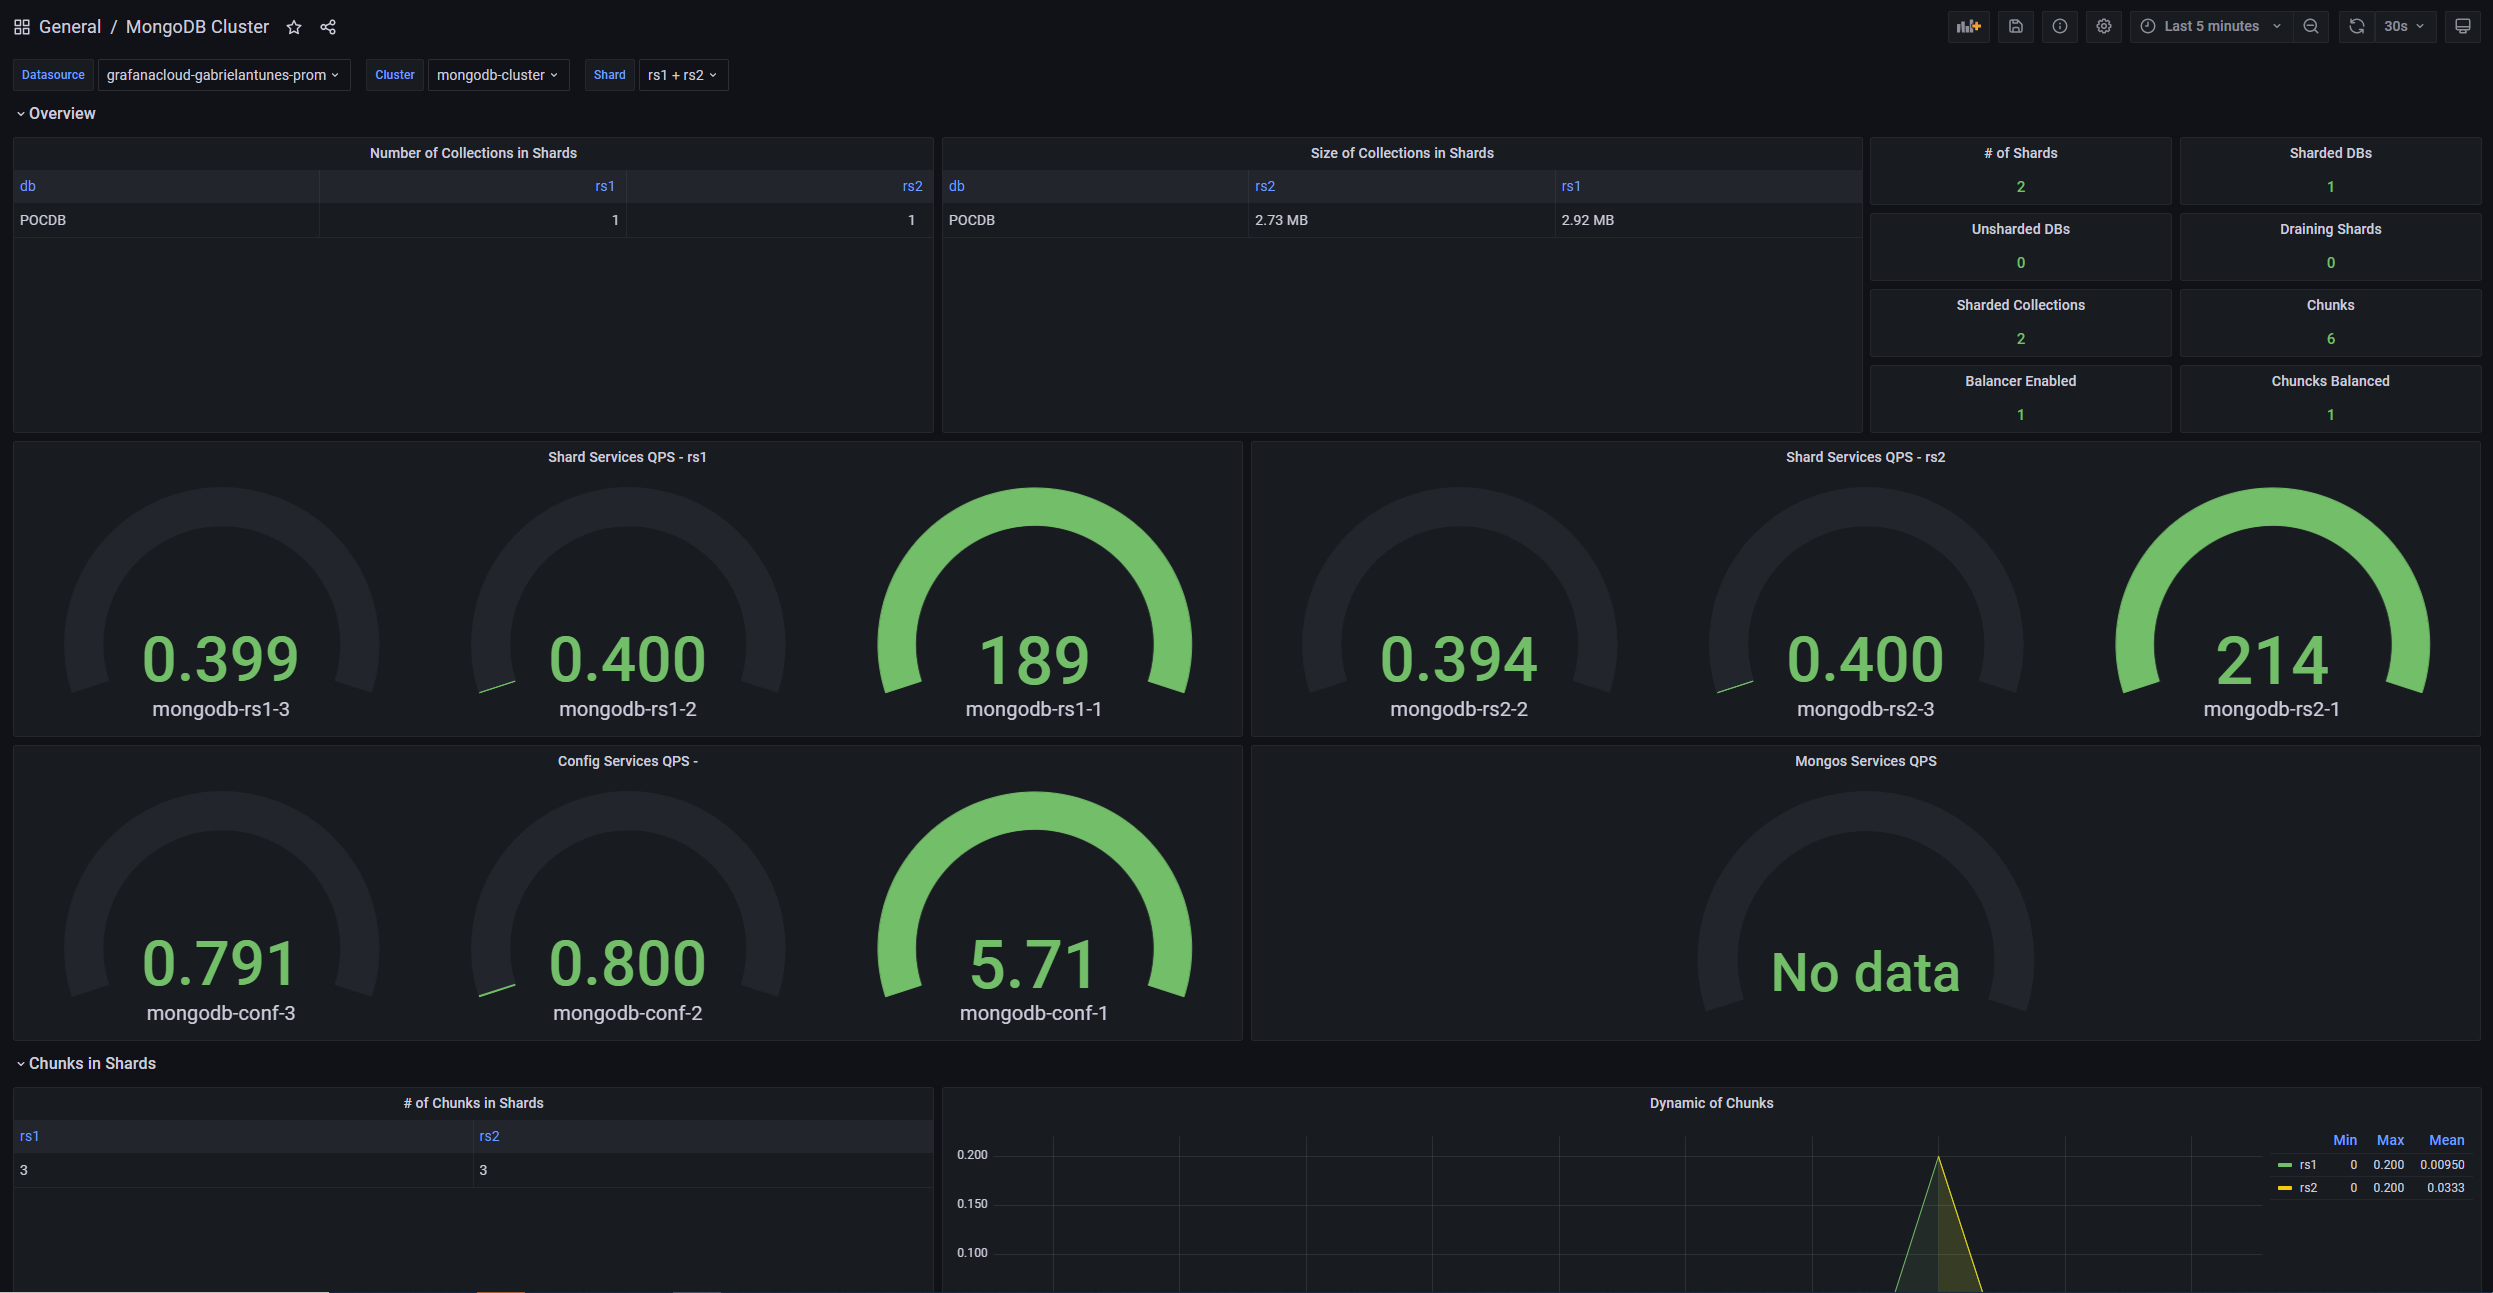
- MongoDB Cluster
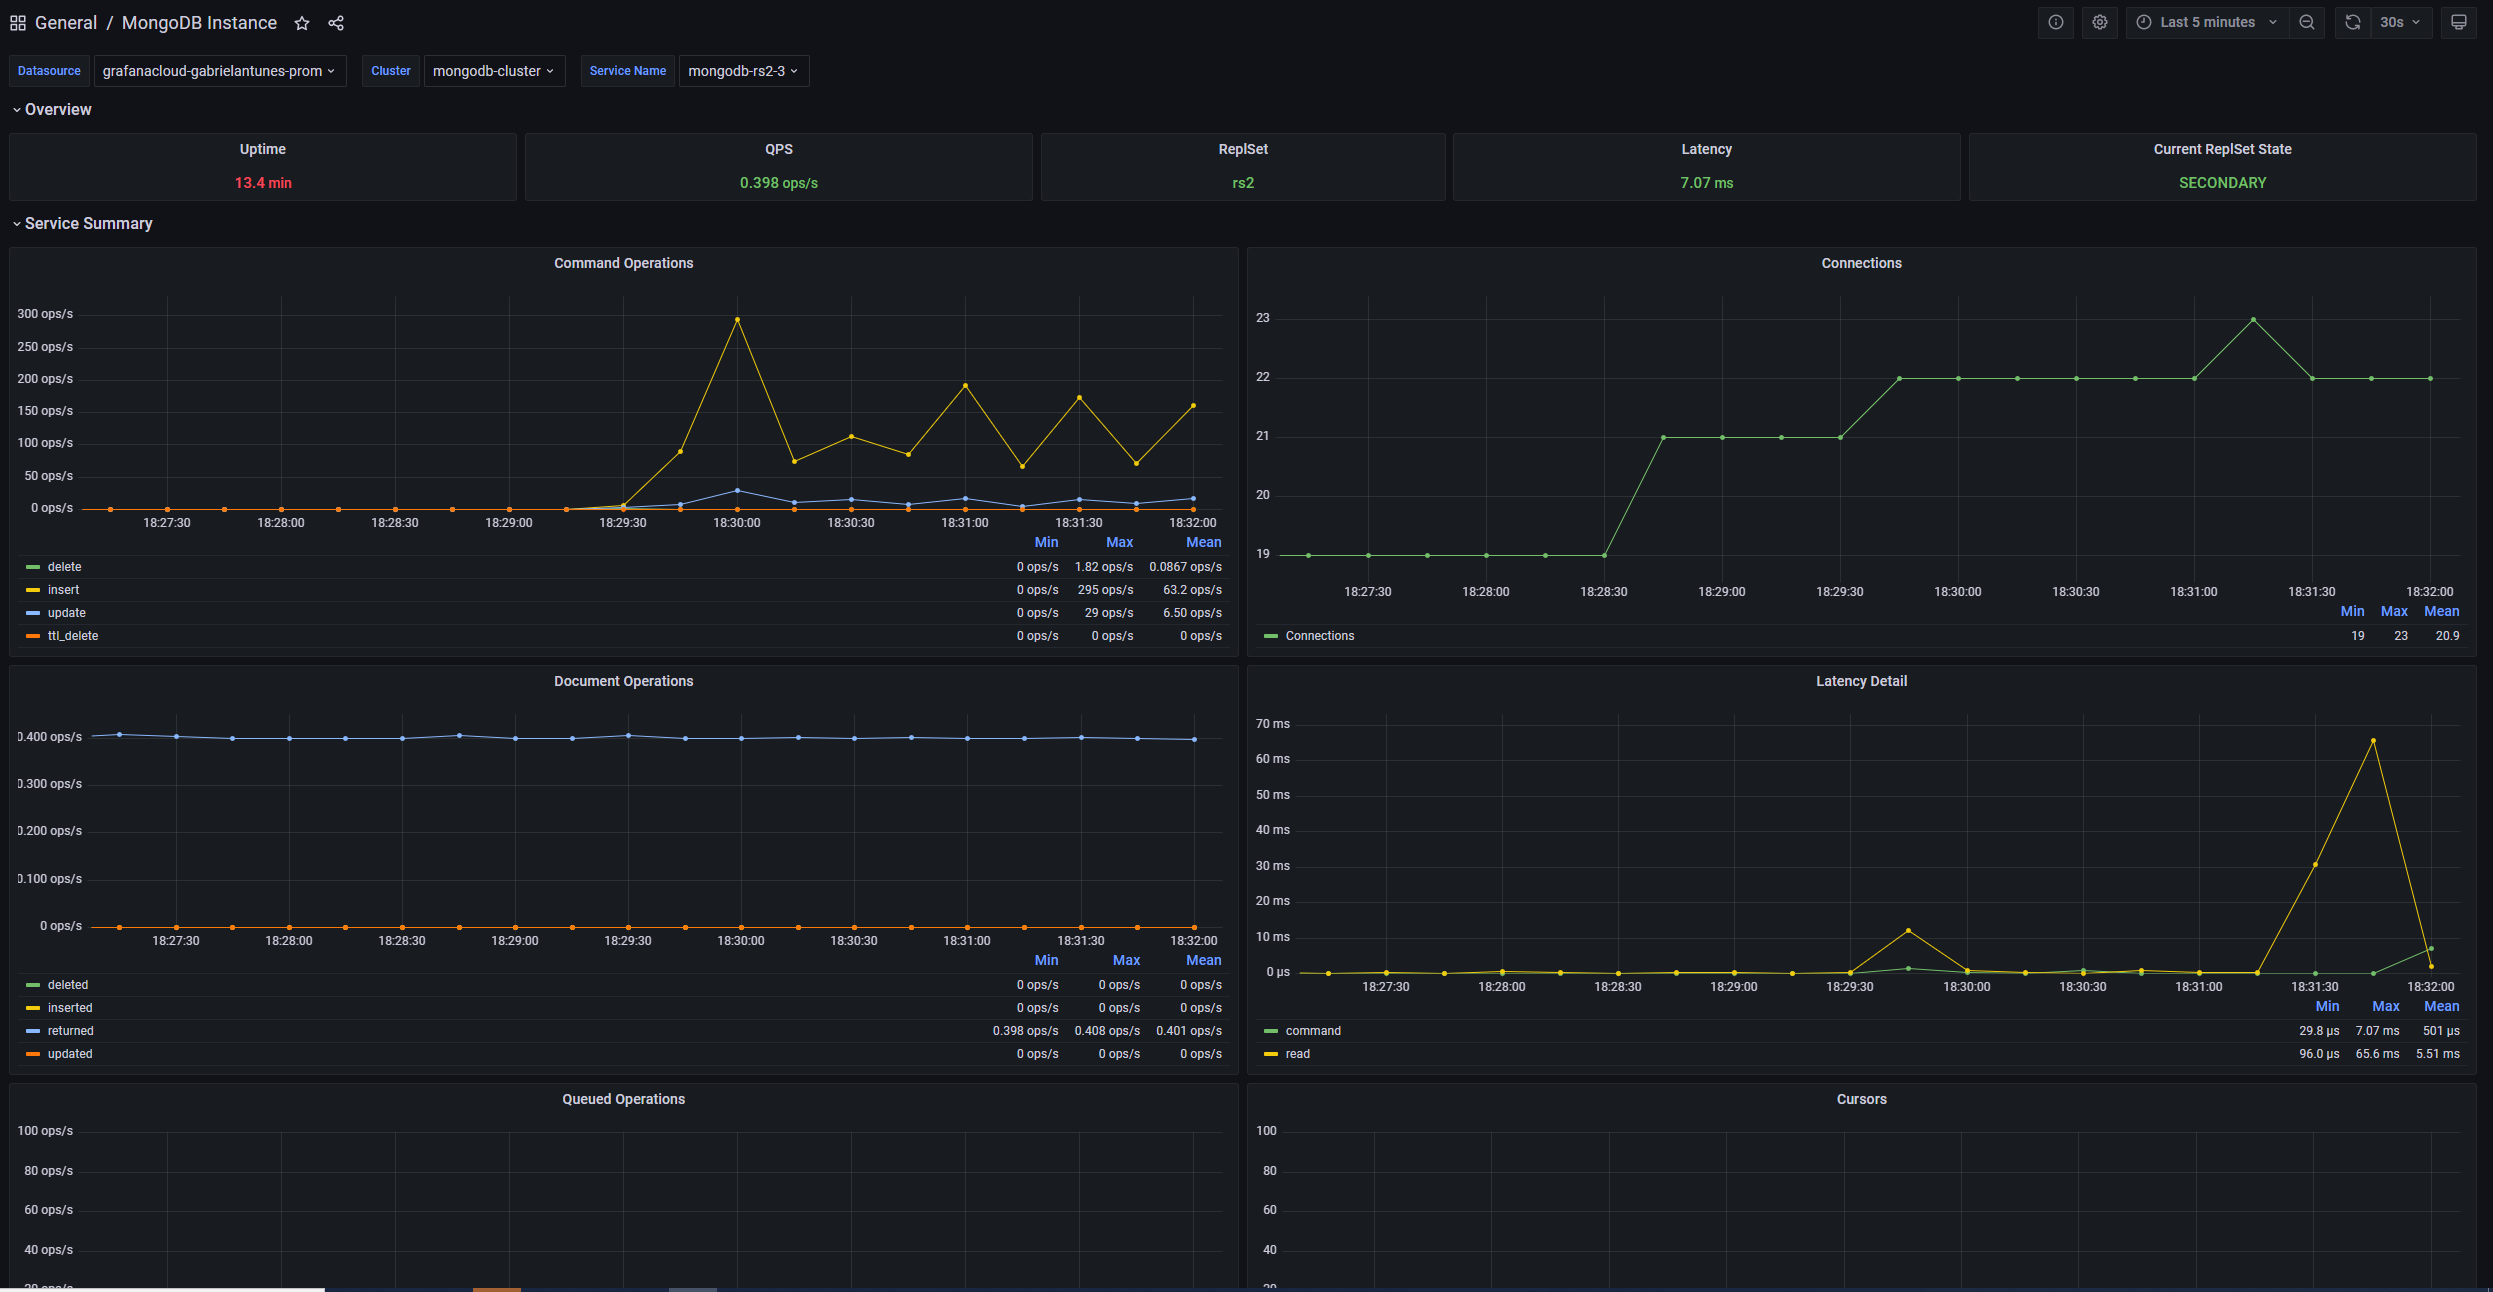
- MongoDB Instance
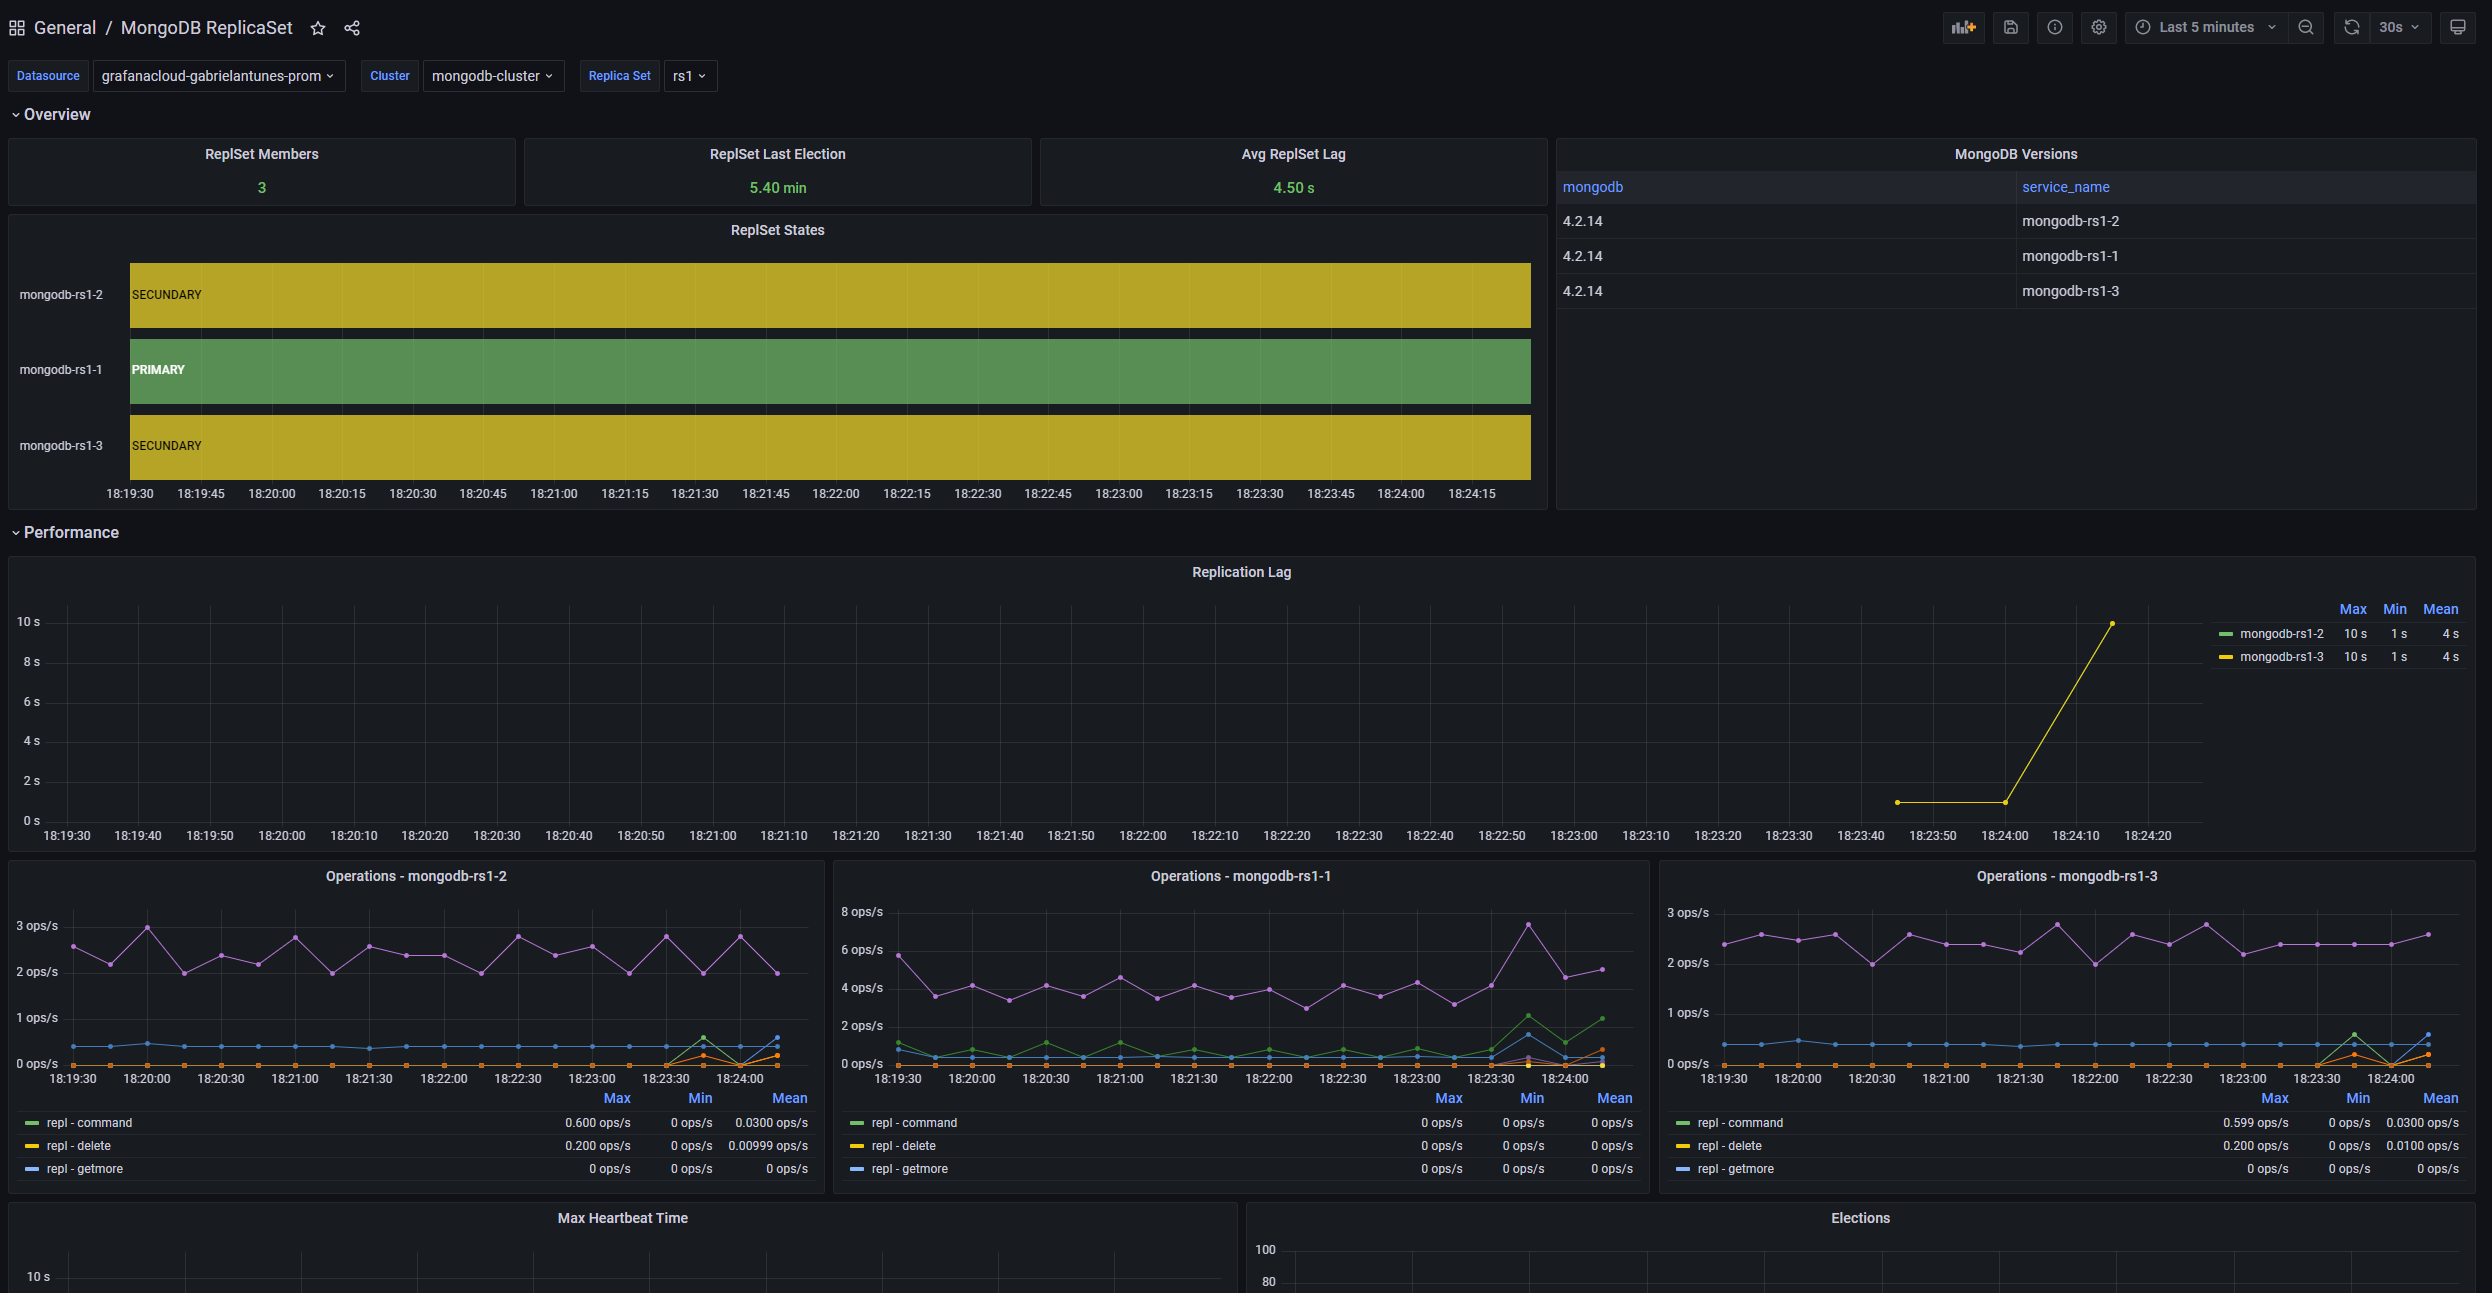
- MongoDB ReplicaSet
Cluster Overview
Instance Overview
ReplicaSet Overview
Alerts
The MongoDB integration includes the following useful alerts:
| Alert | Description |
|---|---|
| MongodbDown | Critical: MongoDB Instance is Down. |
| MongodbReplicationLag | Critical: MongoDB replication lag is exceeding the threshold. |
| MongodbReplicationHeadroom | Critical: MongoDB replication headroom is exceeding the threshold. |
| MongodbNumberCursorsOpen | Warning: MongoDB number cursors open too high. |
| MongodbCursorsTimeouts | Warning: MongoDB cursors timeouts is exceeding the threshold. |
| MongodbTooManyConnections | Warning: MongoDB too many connections. |
| MongodbVirtualMemoryUsage | Warning: MongoDB virtual memory usage is too high. |
Metrics
The most important metrics provided by the MongoDB integration, which are used on the pre-built dashboards and Prometheus alerts, are as follows:
- mongodb_asserts_total
- mongodb_connections
- mongodb_extra_info_page_faults_total
- mongodb_instance_uptime_seconds
- mongodb_memory
- mongodb_mongod_asserts_total
- mongodb_mongod_connections
- mongodb_mongod_cursors
- mongodb_mongod_extra_info_page_faults_total
- mongodb_mongod_global_lock_current_queue
- mongodb_mongod_metrics_cursor_open
- mongodb_mongod_metrics_cursor_timed_out_total
- mongodb_mongod_metrics_document_total
- mongodb_mongod_metrics_get_last_error_wtime_num_total
- mongodb_mongod_metrics_get_last_error_wtime_total_milliseconds
- mongodb_mongod_metrics_get_last_error_wtimeouts_total
- mongodb_mongod_metrics_query_executor_total
- mongodb_mongod_metrics_record_moves_total
- mongodb_mongod_metrics_repl_apply_batches_total_milliseconds
- mongodb_mongod_metrics_repl_apply_ops_total
- mongodb_mongod_metrics_repl_buffer_count
- mongodb_mongod_metrics_repl_network_getmores_total_milliseconds
- mongodb_mongod_metrics_repl_preload_docs_num_total
- mongodb_mongod_metrics_repl_preload_docs_total_milliseconds
- mongodb_mongod_metrics_repl_preload_indexes_num_total
- mongodb_mongod_metrics_repl_preload_indexes_total_milliseconds
- mongodb_mongod_metrics_ttl_deleted_documents_total
- mongodb_mongod_op_counters_repl_total
- mongodb_mongod_op_counters_total
- mongodb_mongod_op_latencies_latency_total
- mongodb_mongod_op_latencies_ops_total
- mongodb_mongod_replset_member_election_date
- mongodb_mongod_replset_member_last_heartbeat
- mongodb_mongod_replset_member_optime_date
- mongodb_mongod_replset_member_ping_ms
- mongodb_mongod_replset_member_replication_lag
- mongodb_mongod_replset_my_name
- mongodb_mongod_replset_my_state
- mongodb_mongod_replset_number_of_members
- mongodb_mongod_replset_oplog_head_timestamp
- mongodb_mongod_replset_oplog_tail_timestamp
- mongodb_mongos_asserts_total
- mongodb_mongos_connections
- mongodb_mongos_cursors
- mongodb_mongos_db_collections_total
- mongodb_mongos_db_data_size_bytes
- mongodb_mongos_db_index_size_bytes
- mongodb_mongos_db_indexes_total
- mongodb_mongos_extra_info_page_faults_total
- mongodb_mongos_metrics_cursor_open
- mongodb_mongos_metrics_get_last_error_wtime_num_total
- mongodb_mongos_metrics_get_last_error_wtime_total_milliseconds
- mongodb_mongos_metrics_get_last_error_wtimeouts_total
- mongodb_mongos_metrics_ttl_deleted_documents_total
- mongodb_mongos_op_counters_repl_total
- mongodb_mongos_op_counters_total
- mongodb_mongos_sharding_balancer_enabled
- mongodb_mongos_sharding_changelog_10min_total
- mongodb_mongos_sharding_chunks_is_balanced
- mongodb_mongos_sharding_chunks_total
- mongodb_mongos_sharding_collections_total
- mongodb_mongos_sharding_databases_total
- mongodb_mongos_sharding_shard_chunks_total
- mongodb_mongos_sharding_shards_draining_total
- mongodb_mongos_sharding_shards_total
- mongodb_op_counters_repl_total
- mongodb_op_counters_total
- mongodb_rs_members_pingMs
- mongodb_up
- mongodb_version_info
- up
Changelog
# 0.0.6 - July 2023

* New Filter Metrics option for configuring the Grafana Agent, which saves on metrics cost by dropping any metric not used by this integration. Beware that anything custom built using metrics that are not on the snippet will stop working.
* New hostname relabel option, which applies the instance name you write on the text box to the Grafana Agent configuration snippets, making it easier and less error prone to configure this mandatory label.

# 0.0.5 - October 2022

* Update mixin to latest version:
  - Fix missing job label on all the dashboards
  - Adding screenshots

# 0.0.4 - October 2022

* Update mixin to latest version:
  - Fix missing cluster label on ReplicaSet and Instance dashboards

# 0.0.3 - September 2022

* Update mixin to latest version:
  - Fix queryType and datasources

# 0.0.2 - June 2022

* Fixing missing datasource variable on Instance dashboard

# 0.0.1 - October 2021

* Initial release
Cost
By connecting your MongoDB instance to Grafana Cloud, you might incur charges. To view information on the number of active series that your Grafana Cloud account uses for metrics included in each Cloud tier, see Active series and dpm usage and Cloud tier pricing.
Was this page helpful?
Related resources from Grafana Labs


