
MongoDB Atlas integration for Grafana Cloud
MongoDB Atlas is a fully managed cloud database service that provides a scalable, secure, and flexible platform for hosting and managing MongoDB databases. This integration for Grafana Cloud allows users to collect metrics for monitoring a MongoDB Atlas project containing any number of clustered database deployments.
Metrics include connections, operations, deadlocks, memory usage, election counts, sharding statistics, and network metrics. These are used to provide valuable visualizations for clusters, replica sets, and individual nodes.
This integration supports MongoDB 4.4+ and MongoDB Atlas cluster levels M10+.
This integration includes 12 useful alerts and 4 pre-built dashboards to help monitor and visualize MongoDB Atlas metrics.
Before you begin
In order for this integration to work, you must configure your MongoDB Atlas project to use the provided Prometheus integration. Please note that only MongoDB Atlas M10 and above clusters have access to the Prometheus integration.
Begin by following the steps found here to activate the Prometheus integration. Follow this guide until you have made basic auth credentials for the Prometheus integration and the MongoDB Atlas UI has generated a scrape config for Prometheus. Make note of the username and password you created, and navigate to your MongoDB Atlas project’s settings page and record the project ID.
Please note that while following the steps to activate the Prometheus integration, you only need to worry about the basic auth credentials that get made. The rest of the configuration for the Prometheus integration can be disregarded.
After making the basic auth credentials, navigate to your MongoDB Atlas project settings page and record the project ID.
Next navigate to the “Network Access” section of the MongoDB Atlas project you are targeting. Add the agent bound outbound IP address of the machine running the agent to list of whitelisted IPs.
Install MongoDB Atlas integration for Grafana Cloud
- In your Grafana Cloud stack, click Connections in the left-hand menu.
- Find MongoDB Atlas and click its tile to open the integration.
- Review the prerequisites in the Configuration Details tab and set up Grafana Agent to send MongoDB Atlas metrics to your Grafana Cloud instance.
- Click Install to add this integration’s pre-built dashboards and alerts to your Grafana Cloud instance, and you can start monitoring your MongoDB Atlas setup.
Configuration snippets for Grafana Alloy
Advanced mode
The following snippets provide examples to guide you through the configuration process.
To instruct Grafana Alloy to scrape your MongoDB Atlas instances, manually copy and append the snippets to your alloy configuration file, then follow subsequent instructions.
Advanced metrics snippets
discovery.http "metrics_integrations_integrations_mongodb_atlas" {
	basic_auth {
		username = "<prom_username>"
		password = "<prom_password>"
	}
	follow_redirects = true
	enable_http2     = true
	refresh_interval = "1m0s"
	url              = "https://cloud.mongodb.com/prometheus/v1.0/groups/<group_id>/discovery"
}

prometheus.scrape "metrics_integrations_integrations_mongodb_atlas" {
	targets         = discovery.http.metrics_integrations_integrations_mongodb_atlas.targets
	forward_to      = [prometheus.remote_write.metrics_service.receiver]
	job_name        = "integrations/mongodb-atlas"
	scrape_interval = "10s"
	scheme          = "https"

	basic_auth {
		username = "<prom_username>"
		password = "<prom_password>"
	}
}
To monitor your MongoDB Atlas server, you must use a discovery.http component to discover your MongoDB Atlas Prometheus endpoint and apply appropriate labels, followed by a prometheus.scrape component to scrape it.
Configure the following properties within each discovery.http component:
<prom_username>and<prom_password>: change these arguments to match the username and password created when activating the Prometheus integration.url: The address to your MongoDB Atlas Prometheus metrics endpoint.<group_id>: change the<group_id>placeholder within theurlargument to match the project id for the project the Prometheus integration was activated for.
If you have multiple MongoDB Atlas servers to scrape, configure one discovery.http for each and scrape them by including each under targets within the prometheus.scrape component.
Grafana Agent static configuration (deprecated)
The following section shows configuration for running Grafana Agent in static mode which is deprecated. You should use Grafana Alloy for all new deployments.
Before you begin
In order for this integration to work, you must configure your MongoDB Atlas project to use the provided Prometheus integration. Please note that only MongoDB Atlas M10 and above clusters have access to the Prometheus integration.
Begin by following the steps found here to activate the Prometheus integration. Follow this guide until you have made basic auth credentials for the Prometheus integration and the MongoDB Atlas UI has generated a scrape config for Prometheus. Make note of the username and password you created, and navigate to your MongoDB Atlas project’s settings page and record the project ID.
Please note that while following the steps to activate the Prometheus integration, you only need to worry about the basic auth credentials that get made. The rest of the configuration for the Prometheus integration can be disregarded.
After making the basic auth credentials, navigate to your MongoDB Atlas project settings page and record the project ID.
Next navigate to the “Network Access” section of the MongoDB Atlas project you are targeting. Add the agent bound outbound IP address of the machine running the agent to list of whitelisted IPs.
Install MongoDB Atlas integration for Grafana Cloud
- In your Grafana Cloud stack, click Connections in the left-hand menu.
- Find MongoDB Atlas and click its tile to open the integration.
- Review the prerequisites in the Configuration Details tab and set up Grafana Agent to send MongoDB Atlas metrics to your Grafana Cloud instance.
- Click Install to add this integration’s pre-built dashboards and alerts to your Grafana Cloud instance, and you can start monitoring your MongoDB Atlas setup.
Post-install configuration for the MongoDB Atlas integration
After enabling MongoDB Atlas’ prometheus integration, instruct the Grafana Agent to scrape your Atlas project clusters.
Change the <prom_username> and <prom_password> fields to match the username and password created when activating the Prometheus integration.
Change the <group_id> in the http_sd_configs.url field to match the project id for the project the Prometheus integration was activated for.
Configuration snippets for Grafana Agent
Below metrics.configs.scrape_configs, insert the following lines and change the URLs according to your environment:
    - job_name: integrations/mongodb-atlas
      scrape_interval: 10s
      metrics_path: /metrics
      scheme: https
      basic_auth:
        username: <prom_username>
        password: <prom_password>
      http_sd_configs:
        - url: https://cloud.mongodb.com/prometheus/v1.0/groups/<group_id>/discovery
          refresh_interval: 60s
          basic_auth:
            username: <prom_username>
            password: <prom_password>
Full example configuration for Grafana Agent
Refer to the following Grafana Agent configuration for a complete example that contains all the snippets used for the MongoDB Atlas integration. This example also includes metrics that are sent to monitor your Grafana Agent instance.
integrations:
  prometheus_remote_write:
  - basic_auth:
      password: <your_prom_pass>
      username: <your_prom_user>
    url: <your_prom_url>
  agent:
    enabled: true
    relabel_configs:
    - action: replace
      source_labels:
      - agent_hostname
      target_label: instance
    - action: replace
      target_label: job
      replacement: "integrations/agent-check"
    metric_relabel_configs:
    - action: keep
      regex: (prometheus_target_sync_length_seconds_sum|prometheus_target_scrapes_.*|prometheus_target_interval.*|prometheus_sd_discovered_targets|agent_build.*|agent_wal_samples_appended_total|process_start_time_seconds)
      source_labels:
      - __name__
  # Add here any snippet that belongs to the `integrations` section.
  # For a correct indentation, paste snippets copied from Grafana Cloud at the beginning of the line.
logs:
  configs:
  - clients:
    - basic_auth:
        password: <your_loki_pass>
        username: <your_loki_user>
      url: <your_loki_url>
    name: integrations
    positions:
      filename: /tmp/positions.yaml
    scrape_configs:
      # Add here any snippet that belongs to the `logs.configs.scrape_configs` section.
      # For a correct indentation, paste snippets copied from Grafana Cloud at the beginning of the line.
metrics:
  configs:
  - name: integrations
    remote_write:
    - basic_auth:
        password: <your_prom_pass>
        username: <your_prom_user>
      url: <your_prom_url>
    scrape_configs:
      # Add here any snippet that belongs to the `metrics.configs.scrape_configs` section.
      # For a correct indentation, paste snippets copied from Grafana Cloud at the beginning of the line.
    - job_name: integrations/mongodb-atlas
      scrape_interval: 10s
      metrics_path: /metrics
      scheme: https
      basic_auth:
        username: <prom_username>
        password: <prom_password>
      http_sd_configs:
        - url: https://cloud.mongodb.com/prometheus/v1.0/groups/<group_id>/discovery
          refresh_interval: 60s
          basic_auth:
            username: <prom_username>
            password: <prom_password>
  global:
    scrape_interval: 60s
  wal_directory: /tmp/grafana-agent-wal
Dashboards
The MongoDB Atlas integration installs the following dashboards in your Grafana Cloud instance to help monitor your system.
- MongoDB Atlas cluster overview
- MongoDB Atlas election overview
- MongoDB Atlas operations overview
- MongoDB Atlas performance overview
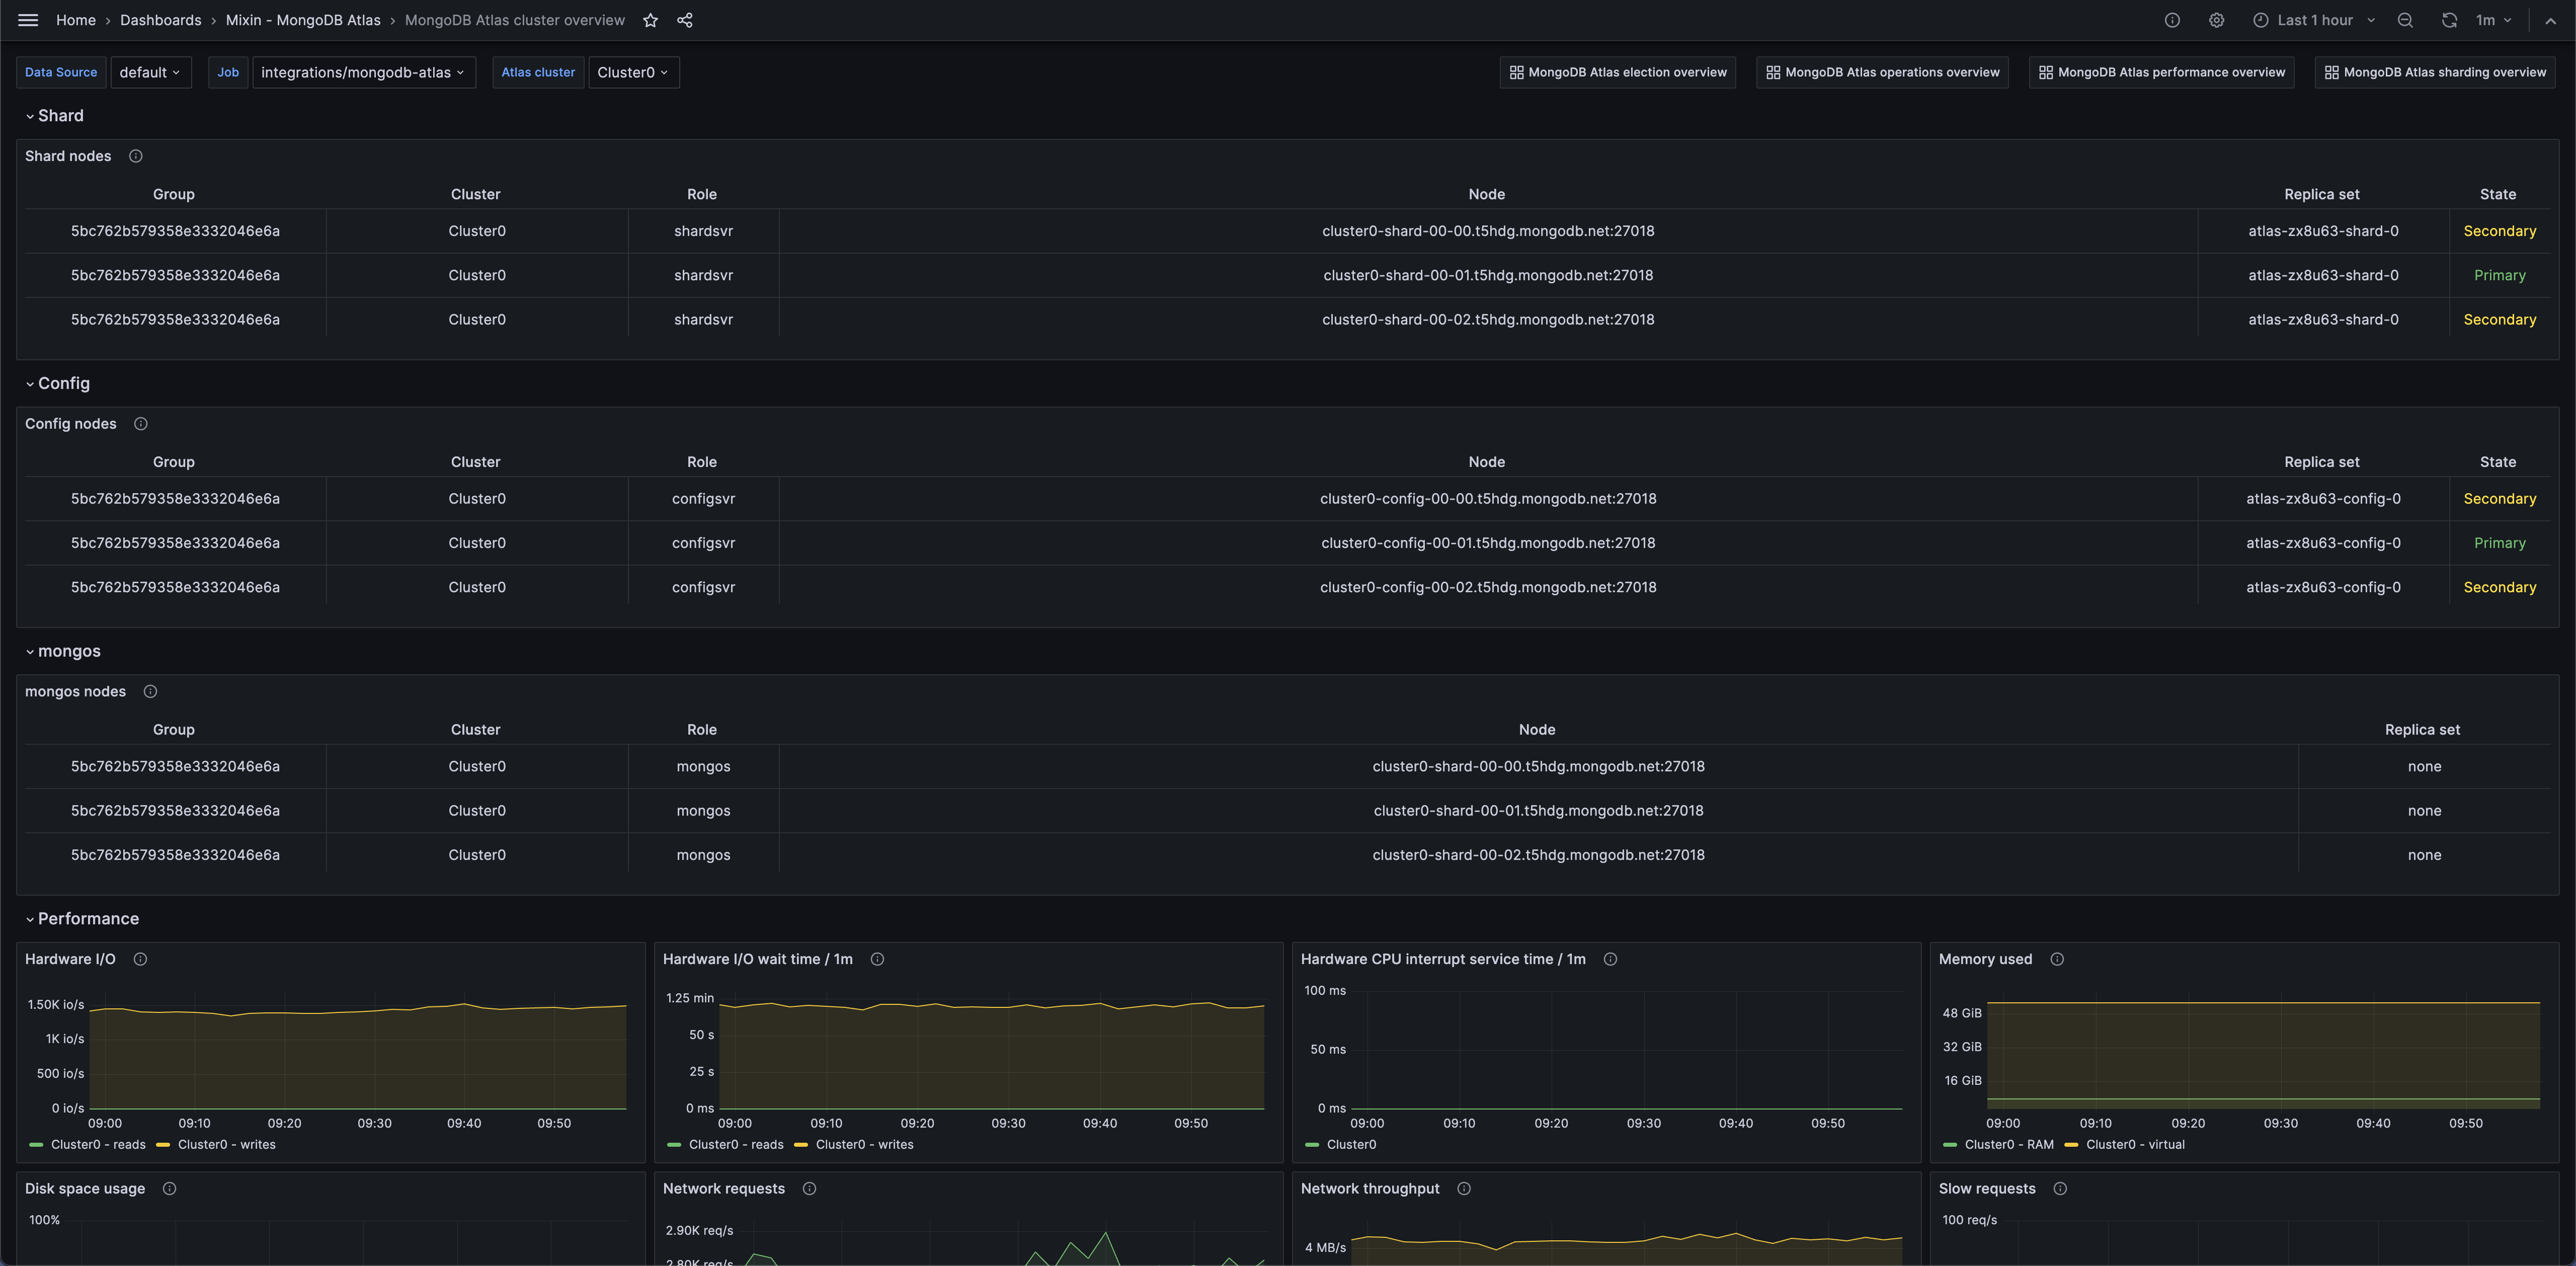
MongoDB Atlas cluster overview 1 (tables)
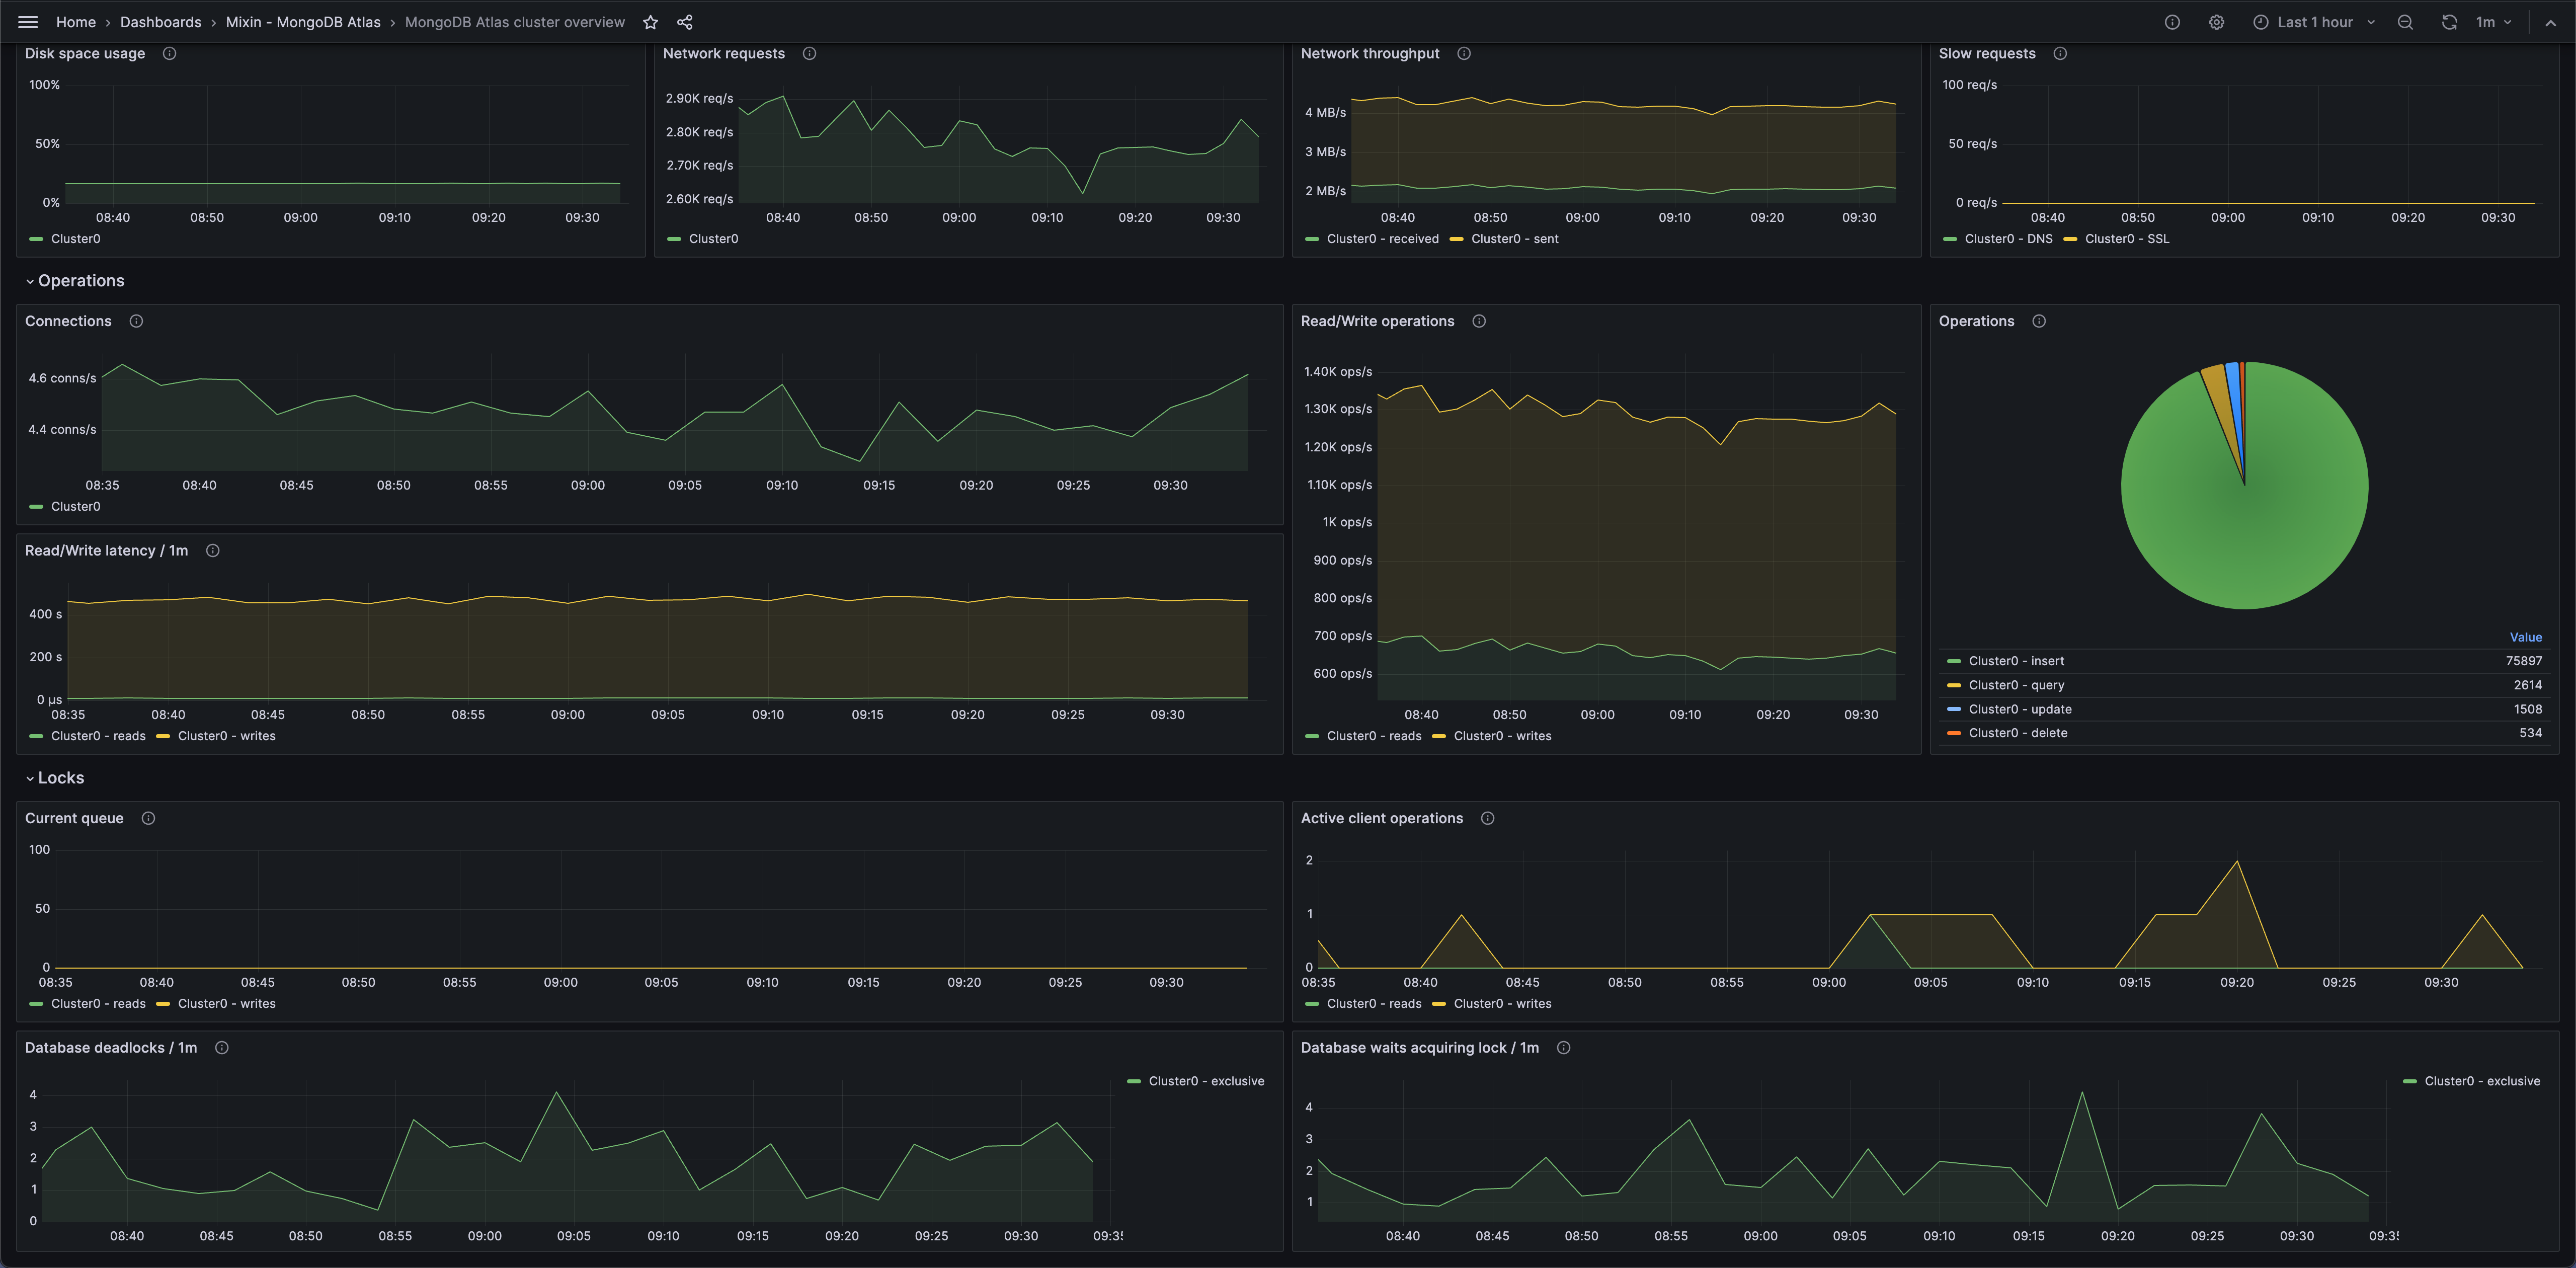
MongoDB Atlas cluster overview 2 (operations)
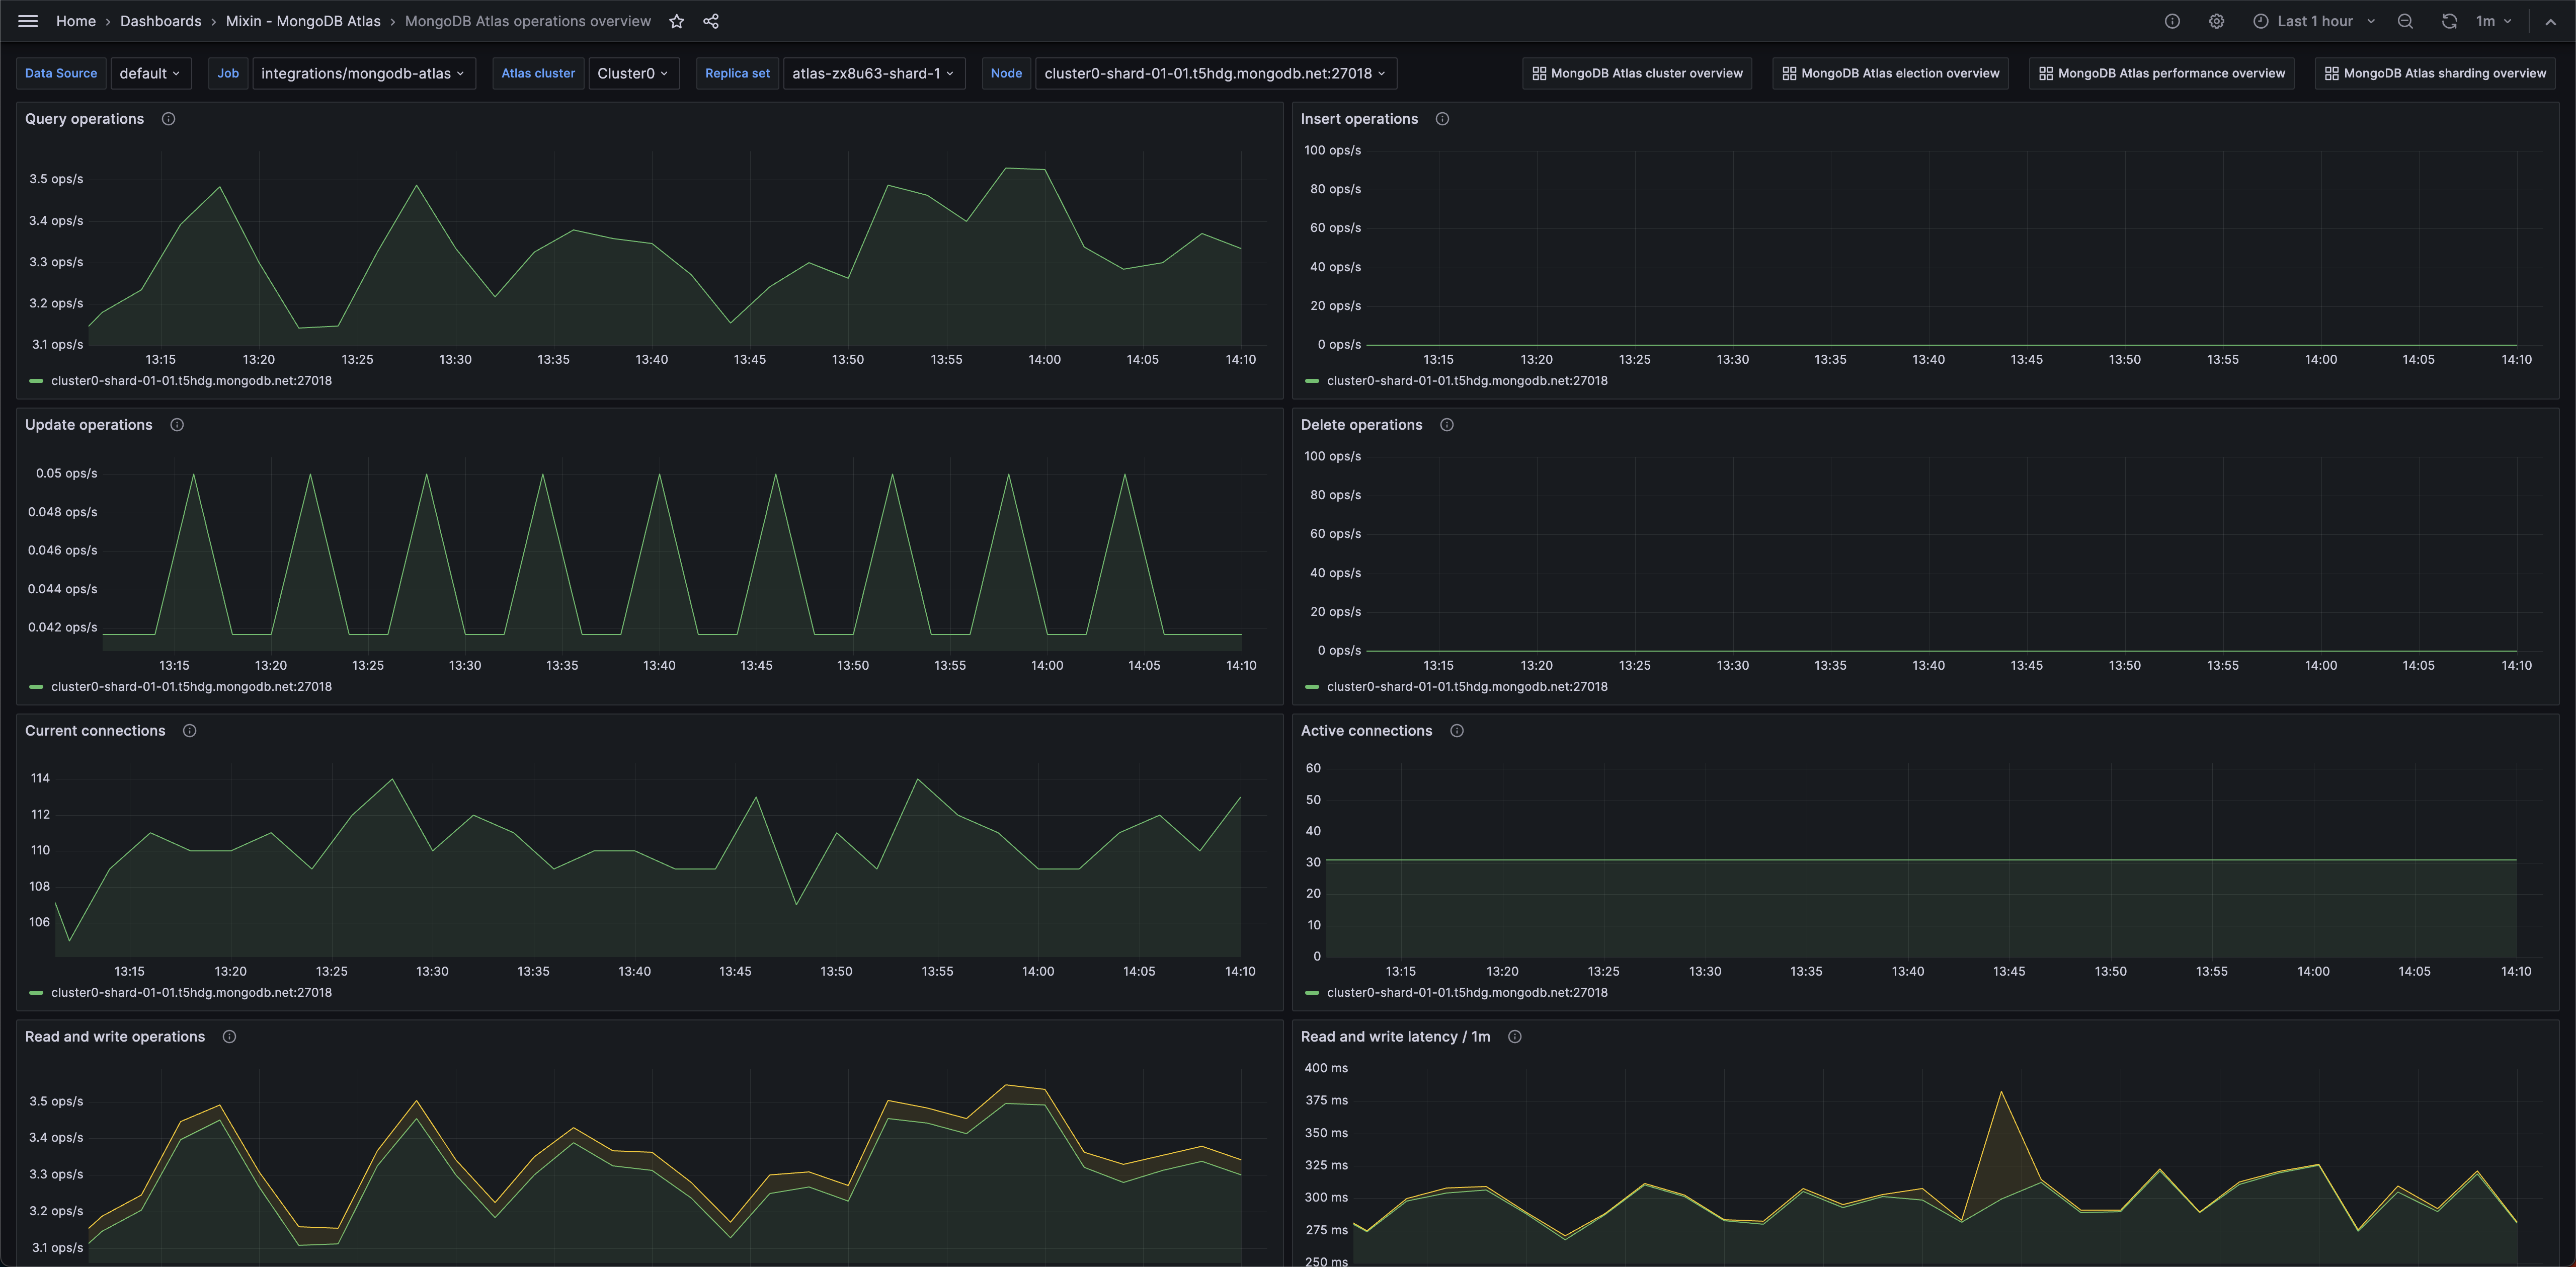
MongoDB Atlas operations overview 1 (operations)
Alerts
The MongoDB Atlas integration includes the following useful alerts:
| Alert | Description |
|---|---|
| MongoDBAtlasHighNumberOfCollectionExclusiveDeadlocks | Warning: There is a high number of collection exclusive deadlocks occurring. |
| MongoDBAtlasHighNumberOfCollectionIntentExclusiveDeadlocks | Warning: There is a high number of collection intent-exclusive deadlocks occurring. |
| MongoDBAtlasHighNumberOfCollectionSharedDeadlocks | Warning: There is a high number of collection shared deadlocks occurring. |
| MongoDBAtlasHighNumberOfCollectionIntentSharedDeadlocks | Warning: There is a high number of collection intent-shared deadlocks occurring. |
| MongoDBAtlasHighNumberOfDatabaseExclusiveDeadlocks | Warning: There is a high number of database exclusive deadlocks occurring. |
| MongoDBAtlasHighNumberOfDatabaseIntentExclusiveDeadlocks | Warning: There is a high number of database intent-exclusive deadlocks occurring. |
| MongoDBAtlasHighNumberOfDatabaseSharedDeadlocks | Warning: There is a high number of database shared deadlocks occurring. |
| MongoDBAtlasHighNumberOfDatabaseIntentSharedDeadlocks | Warning: There is a high number of database intent-shared deadlocks occurring. |
| MongoDBAtlasHighNumberOfSlowNetworkRequests | Warning: There is a high number of slow network requests. |
| MongoDBAtlasDiskSpaceLow | Warning: Hardware is running out of disk space. |
| MongoDBAtlasSlowHardwareIO | Warning: Read and write I/Os are taking too long to complete. |
| MongoDBAtlasHighNumberOfTimeoutElections | Warning: There is a high number of elections being called due to the primary node timing out. |
Metrics
The most important metrics provided by the MongoDB Atlas integration, which are used on the pre-built dashboards and Prometheus alerts, are as follows:
- hardware_disk_metrics_disk_space_free_bytes
- hardware_disk_metrics_disk_space_used_bytes
- hardware_disk_metrics_read_count
- hardware_disk_metrics_read_time_milliseconds
- hardware_disk_metrics_write_count
- hardware_disk_metrics_write_time_milliseconds
- hardware_system_cpu_irq_milliseconds
- mongodb_connections_active
- mongodb_connections_current
- mongodb_connections_totalCreated
- mongodb_electionMetrics_averageCatchUpOps
- mongodb_electionMetrics_catchUpTakeover_called
- mongodb_electionMetrics_catchUpTakeover_successful
- mongodb_electionMetrics_electionTimeout_called
- mongodb_electionMetrics_electionTimeout_successful
- mongodb_electionMetrics_numCatchUps
- mongodb_electionMetrics_numCatchUpsFailedWithError
- mongodb_electionMetrics_numCatchUpsSkipped
- mongodb_electionMetrics_numCatchUpsSucceeded
- mongodb_electionMetrics_numCatchUpsTimedOut
- mongodb_electionMetrics_priorityTakeover_called
- mongodb_electionMetrics_priorityTakeover_successful
- mongodb_electionMetrics_stepUpCmd_called
- mongodb_electionMetrics_stepUpCmd_successful
- mongodb_globalLock_activeClients_readers
- mongodb_globalLock_activeClients_writers
- mongodb_globalLock_currentQueue_readers
- mongodb_globalLock_currentQueue_writers
- mongodb_locks_Collection_acquireWaitCount_R
- mongodb_locks_Collection_acquireWaitCount_W
- mongodb_locks_Collection_acquireWaitCount_r
- mongodb_locks_Collection_acquireWaitCount_w
- mongodb_locks_Collection_deadlockCount_R
- mongodb_locks_Collection_deadlockCount_W
- mongodb_locks_Collection_deadlockCount_r
- mongodb_locks_Collection_deadlockCount_w
- mongodb_locks_Collection_timeAcquiringMicros_R
- mongodb_locks_Collection_timeAcquiringMicros_W
- mongodb_locks_Collection_timeAcquiringMicros_r
- mongodb_locks_Collection_timeAcquiringMicros_w
- mongodb_locks_Database_acquireWaitCount_R
- mongodb_locks_Database_acquireWaitCount_W
- mongodb_locks_Database_acquireWaitCount_r
- mongodb_locks_Database_acquireWaitCount_w
- mongodb_locks_Database_deadlockCount_R
- mongodb_locks_Database_deadlockCount_W
- mongodb_locks_Database_deadlockCount_r
- mongodb_locks_Database_deadlockCount_w
- mongodb_locks_Database_timeAcquiringMicros_R
- mongodb_locks_Database_timeAcquiringMicros_W
- mongodb_locks_Database_timeAcquiringMicros_r
- mongodb_locks_Database_timeAcquiringMicros_w
- mongodb_mem_resident
- mongodb_mem_virtual
- mongodb_network_bytesIn
- mongodb_network_bytesOut
- mongodb_network_numRequests
- mongodb_network_numSlowDNSOperations
- mongodb_network_numSlowSSLOperations
- mongodb_opLatencies_reads_latency
- mongodb_opLatencies_reads_ops
- mongodb_opLatencies_writes_latency
- mongodb_opLatencies_writes_ops
- mongodb_opcounters_delete
- mongodb_opcounters_insert
- mongodb_opcounters_query
- mongodb_opcounters_update
- up
Changelog
# 0.0.1 - September 2023

* Initial release
Cost
By connecting your MongoDB Atlas instance to Grafana Cloud, you might incur charges. To view information on the number of active series that your Grafana Cloud account uses for metrics included in each Cloud tier, see Active series and dpm usage and Cloud tier pricing.
Was this page helpful?
Related resources from Grafana Labs


