Istio integration for Grafana Cloud
Istio is an open-source service mesh platform designed to enhance the management, security, and observability of microservices in distributed applications. By providing a dedicated layer for handling communication between services, Istio facilitates features such as traffic management, security policies, and telemetry, making it easier for developers to implement and maintain complex microservices architectures typically across Kubernetes environments.
This integration supports Istio 1.20.0+
This integration includes 7 useful alerts and 4 pre-built dashboards to help monitor and visualize Istio metrics and logs.
Before you begin
1. Check pre-requisites specific to the Istio integration
Metrics
Metrics
Istio exposes a Prometheus metrics endpoint, /stats/prometheus, on all istio-proxy containers by default.
You can verify that this endpoint is enabled by running the following command on an Istio pod’s istio-proxy container:
kubectl exec -it <pod-name> -n <namespace> -c istio-proxy -- sh -c 'curl http://localhost:15020/stats/prometheus'Istio also exposes a Prometheus metrics endpoint, /metrics, on the discovery container of the istiod pod.
You can verify that this endpoint is enabled by running the following command on this container:
kubectl exec -it istiod -n <namespace> -c discovery -- sh -c 'curl http://localhost:15014/metrics'Logs
By default, Istio proxies send system logs to stdout.
In order to enable envoy proxy access logs as well, you can use an IstioOperator CR by adding the following field to your configuration:
spec:
  meshConfig:
    accessLogFile: /dev/stdout
Alternatively you can use the Telemetry API to enable access logs:
apiVersion: telemetry.istio.io/v1alpha1
kind: Telemetry
metadata:
  name: mesh-default
  namespace: istio-system
spec:
  accessLogging:
    - providers:
      - name: envoy
For up-to-date information on envoy proxy logging for Istio, refer to (this documentation)[https://istio.io/latest/docs/tasks/observability/logs/access-log/#enable-envoys-access-logging].
2. Configuration & Installation
Kubernetes Monitoring Helm chart configuration
To use this integration, modify your Kubernetes Monitoring Helm chart deployment with these configuration snippets. Metrics snippet
Copy the following and add to the .extraConfig value of the Kubernetes Monitoring Helm chart.
// Replace all values between the angle brackets '<>', with your desired configuration
discovery.relabel "istio_proxy_metrics" {
    targets = discovery.kubernetes.pods.targets

    rule {
        action        = "keep"
        source_labels = ["__meta_kubernetes_pod_container_name"]
        regex         = "istio-proxy.*"
    }
    rule {
        source_labels = ["__meta_kubernetes_pod_annotation_prometheus_io_port", "__meta_kubernetes_pod_ip"]
        regex         = "(\\d+);(([A-Fa-f0-9]{1,4}::?){1,7}[A-Fa-f0-9]{1,4})"
        target_label  = "__address__"
        replacement   = "[$2]:$1"
    }
    rule {
        source_labels = ["__meta_kubernetes_pod_annotation_prometheus_io_port", "__meta_kubernetes_pod_ip"]
        regex         = "(\\d+);((([0-9]+?)(\\.|$)){4})"
        target_label  = "__address__"
        replacement   = "$2:$1"
    }
    rule {
        target_label = "job"
        replacement  = "integrations/istio"
    }
    rule {
        target_label  = "instance"
        source_labels = ["__meta_kubernetes_namespace", "__meta_kubernetes_pod_name"]
        separator     = "-"
    }
    rule {
        target_label  = "pod"
        action        = "replace"
        source_labels = ["__meta_kubernetes_pod_name"]
    }
}

prometheus.scrape "istio_proxy_metrics" {
    targets      = discovery.relabel.istio_proxy_metrics.output
    forward_to   = [prometheus.relabel.metrics_service.receiver]
    metrics_path = "/stats/prometheus"
}

discovery.relabel "istio_istiod_metrics" {
    targets = discovery.kubernetes.endpoints.targets

    rule {
        action        = "keep"
        source_labels = ["__meta_kubernetes_service_name", "__meta_kubernetes_endpoint_port_name"]
        regex         = "istiod;http-monitoring"
    }
    rule {
        source_labels = ["__meta_kubernetes_pod_annotation_prometheus_io_port", "__meta_kubernetes_pod_ip"]
        regex         = "(\\d+);(([A-Fa-f0-9]{1,4}::?){1,7}[A-Fa-f0-9]{1,4})"
        target_label  = "__address__"
        replacement   = "[$2]:$1"
    }
    rule {
        source_labels = ["__meta_kubernetes_pod_annotation_prometheus_io_port", "__meta_kubernetes_pod_ip"]
        regex         = "(\\d+);((([0-9]+?)(\\.|$)){4})"
        target_label  = "__address__"
        replacement   = "$2:$1"
    }
    rule {
        target_label = "job"
        replacement  = "integrations/istio"
    }
    rule {
        target_label  = "instance"
        source_labels = ["__meta_kubernetes_namespace", "__meta_kubernetes_pod_name"]
        separator     = "-"
    }
    rule {
        target_label  = "pod"
        action        = "replace"
        source_labels = ["__meta_kubernetes_pod_name"]
    }
}

prometheus.scrape "istio_istiod_metrics" {
    targets    = discovery.relabel.istio_istiod_metrics.output
    forward_to = [prometheus.relabel.metrics_service.receiver]
}
Logs snippet
Copy the following and add to the .logs.extraConfig value of the Kubernetes Monitoring Helm chart.
// Replace all values between the angle brackets '<>', with your desired configuration
discovery.relabel "istio_proxy_logs" {
    targets = discovery.kubernetes.pods.targets

    rule {
        action        = "keep"
        source_labels = ["__meta_kubernetes_pod_container_name"]
        regex         = "istio-proxy.*"
    }
    rule {
        target_label = "job"
        replacement  = "integrations/istio"
    }
    rule {
        target_label  = "instance"
        source_labels = ["__meta_kubernetes_namespace", "__meta_kubernetes_pod_name"]
        separator     = "-"
    }
    rule {
        target_label  = "pod"
        action        = "replace"
        source_labels = ["__meta_kubernetes_pod_name"]
    }
}

loki.source.kubernetes "istio_proxy_logs" {
    targets    = discovery.relabel.istio_proxy_logs.output
    forward_to = [loki.process.istio_proxy_system_logs.receiver, loki.process.istio_proxy_access_logs.receiver]
}

loki.process "istio_proxy_system_logs" {
    forward_to = [loki.process.logs_service.receiver]

    stage.drop {
        expression = "^\\[.*"
    }
    stage.multiline {
        firstline = "^\\d{4}-\\d{2}-\\d{2}T\\d{2}:\\d{2}:\\d{2}"
    }
    stage.regex {
        expression = "\\d{4}-\\d{2}-\\d{2}T\\d{2}:\\d{2}:\\d{2}\\.\\d{6}Z\\t(?P<level>\\S+)\\t.+"
    }
    stage.labels {
        values = {
            level  = "",
        }
    }
    stage.static_labels {
        values = {
            log_type = "system",
        }
    }
}

loki.process "istio_proxy_access_logs" {
    forward_to = [loki.process.logs_service.receiver]

    stage.drop {
        expression = "^[^\\[].*"
    }
    stage.regex {
        expression = "\\[\\d{4}-\\d{2}-\\d{2}T\\d{2}:\\d{2}:\\d{2}\\.\\d{3}Z\\] \"(?P<request_method>\\w+) \\S+ (?P<protocol>\\S+)\" (?P<response_code>\\d+) .+"
    }
    stage.labels {
        values = {
            request_method = "",
            protocol       = "",
            response_code  = "",
        }
    }
    stage.static_labels {
        values = {
            log_type = "access",
        }
    }
}
For more information about how to set values for .extraConfig or .logs.extraConfig, see the (Helm chart documentation)[https://github.com/grafana/k8s-monitoring-helm/blob/main/charts/k8s-monitoring/docs/UsingExtraConfig.md].
Dashboards
The Istio integration installs the following dashboards in your Grafana Cloud instance to help monitor your system.
- Istio logs
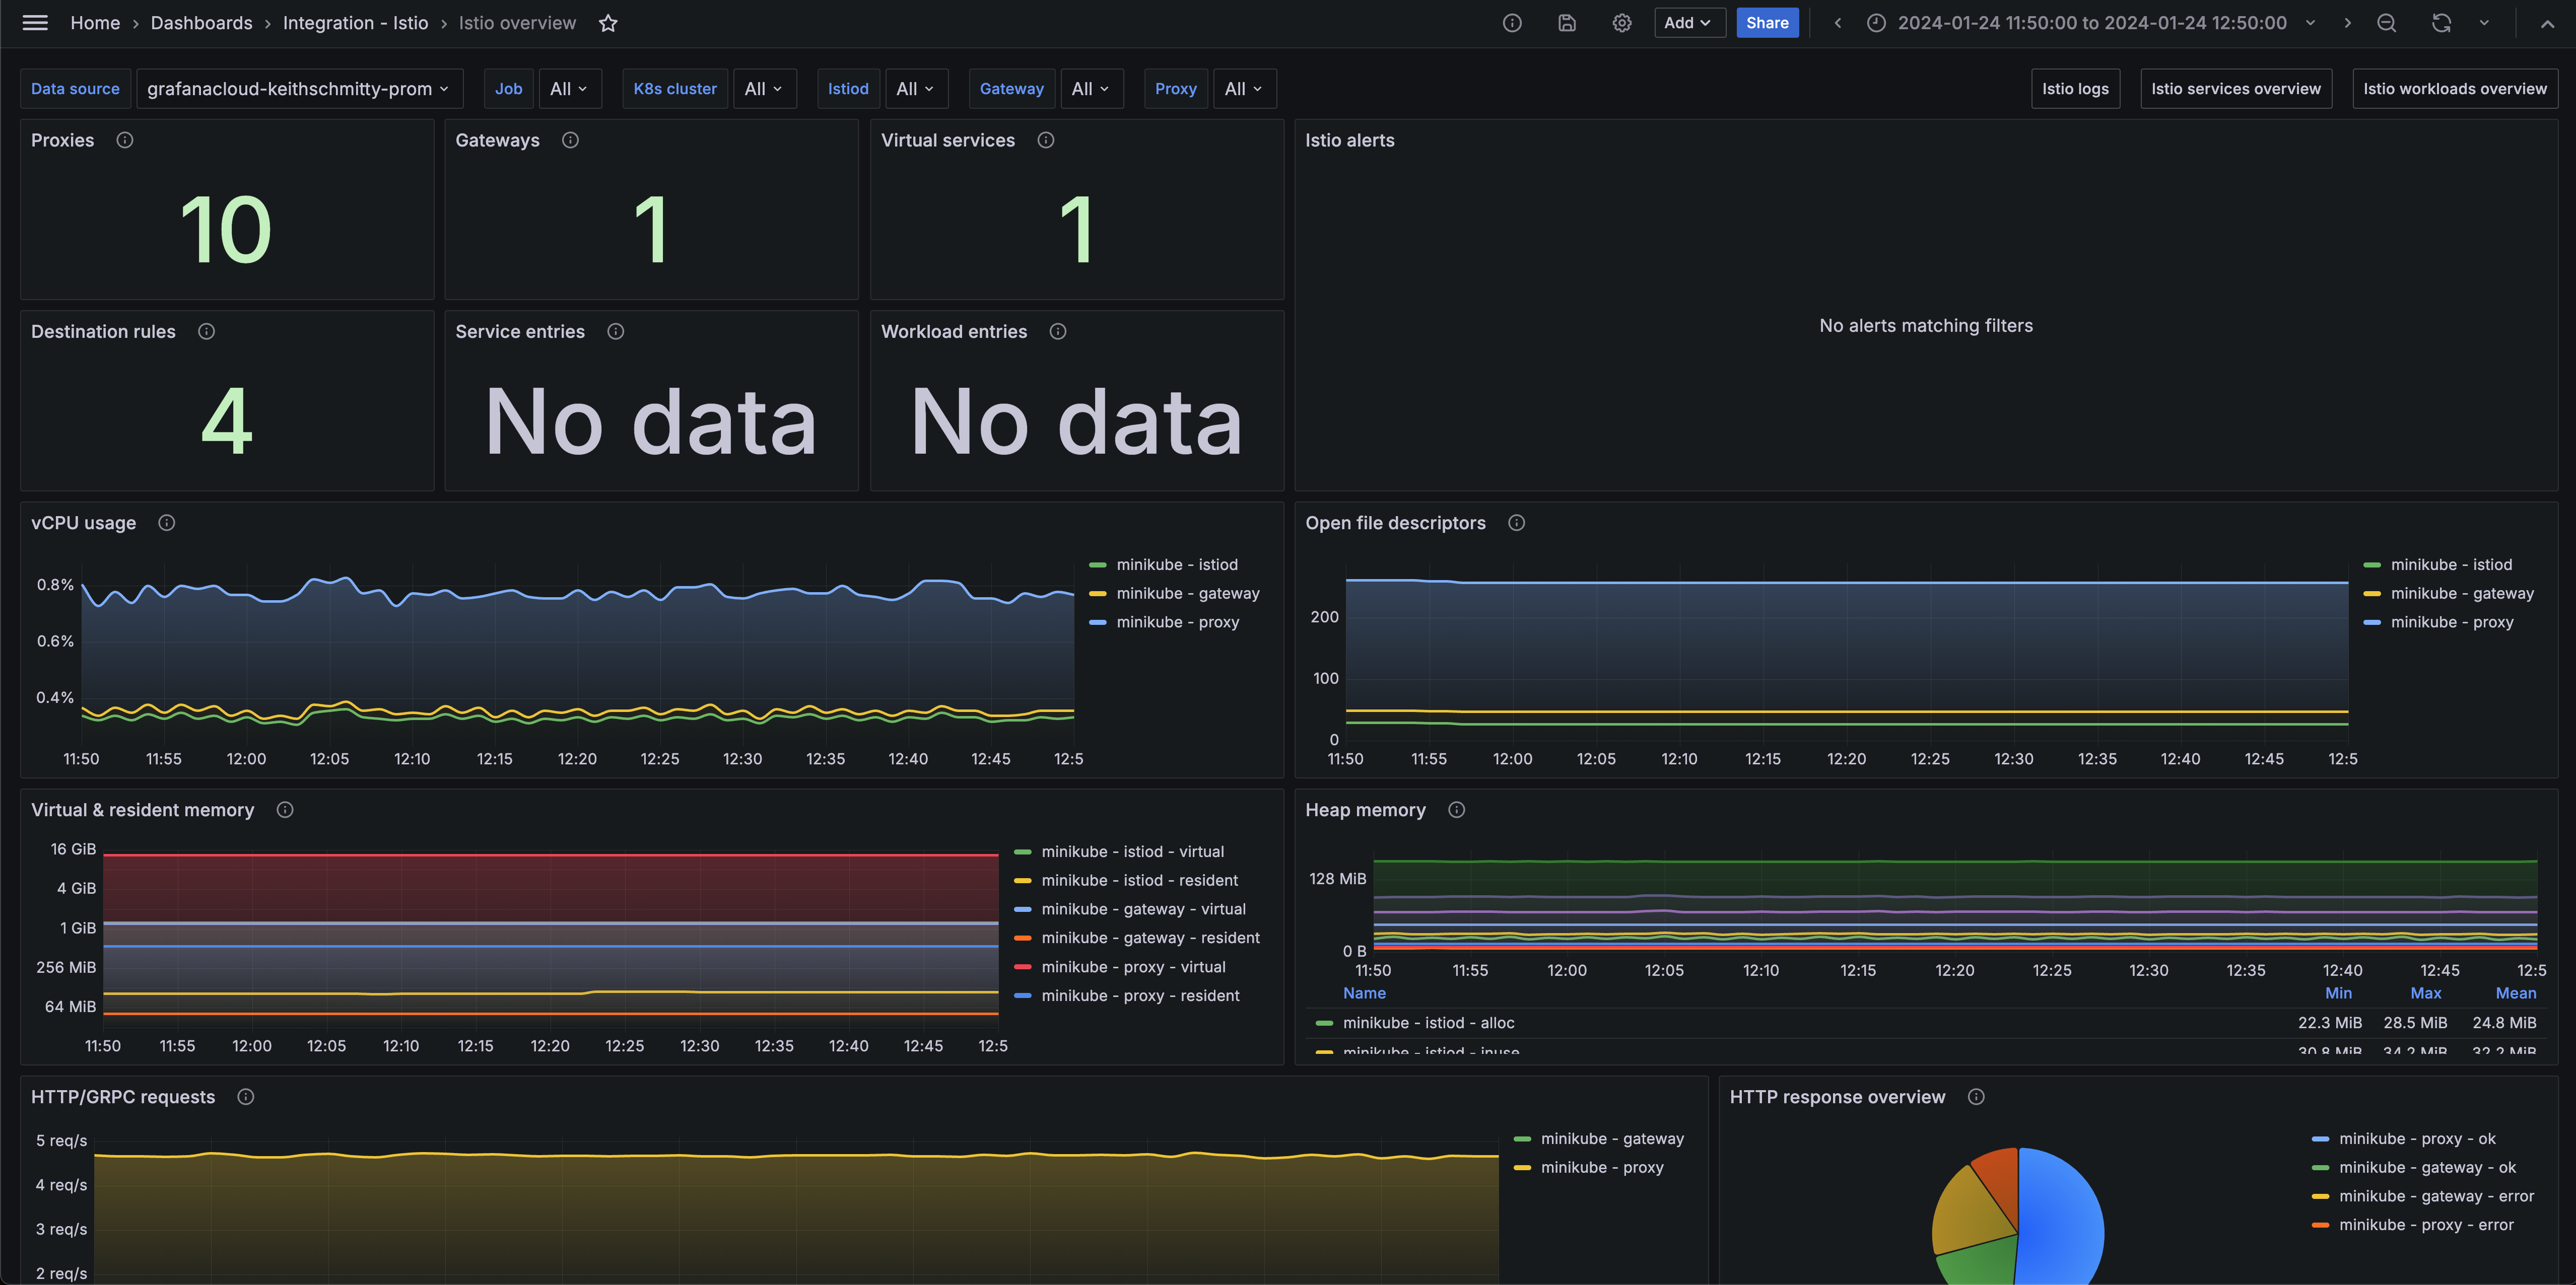
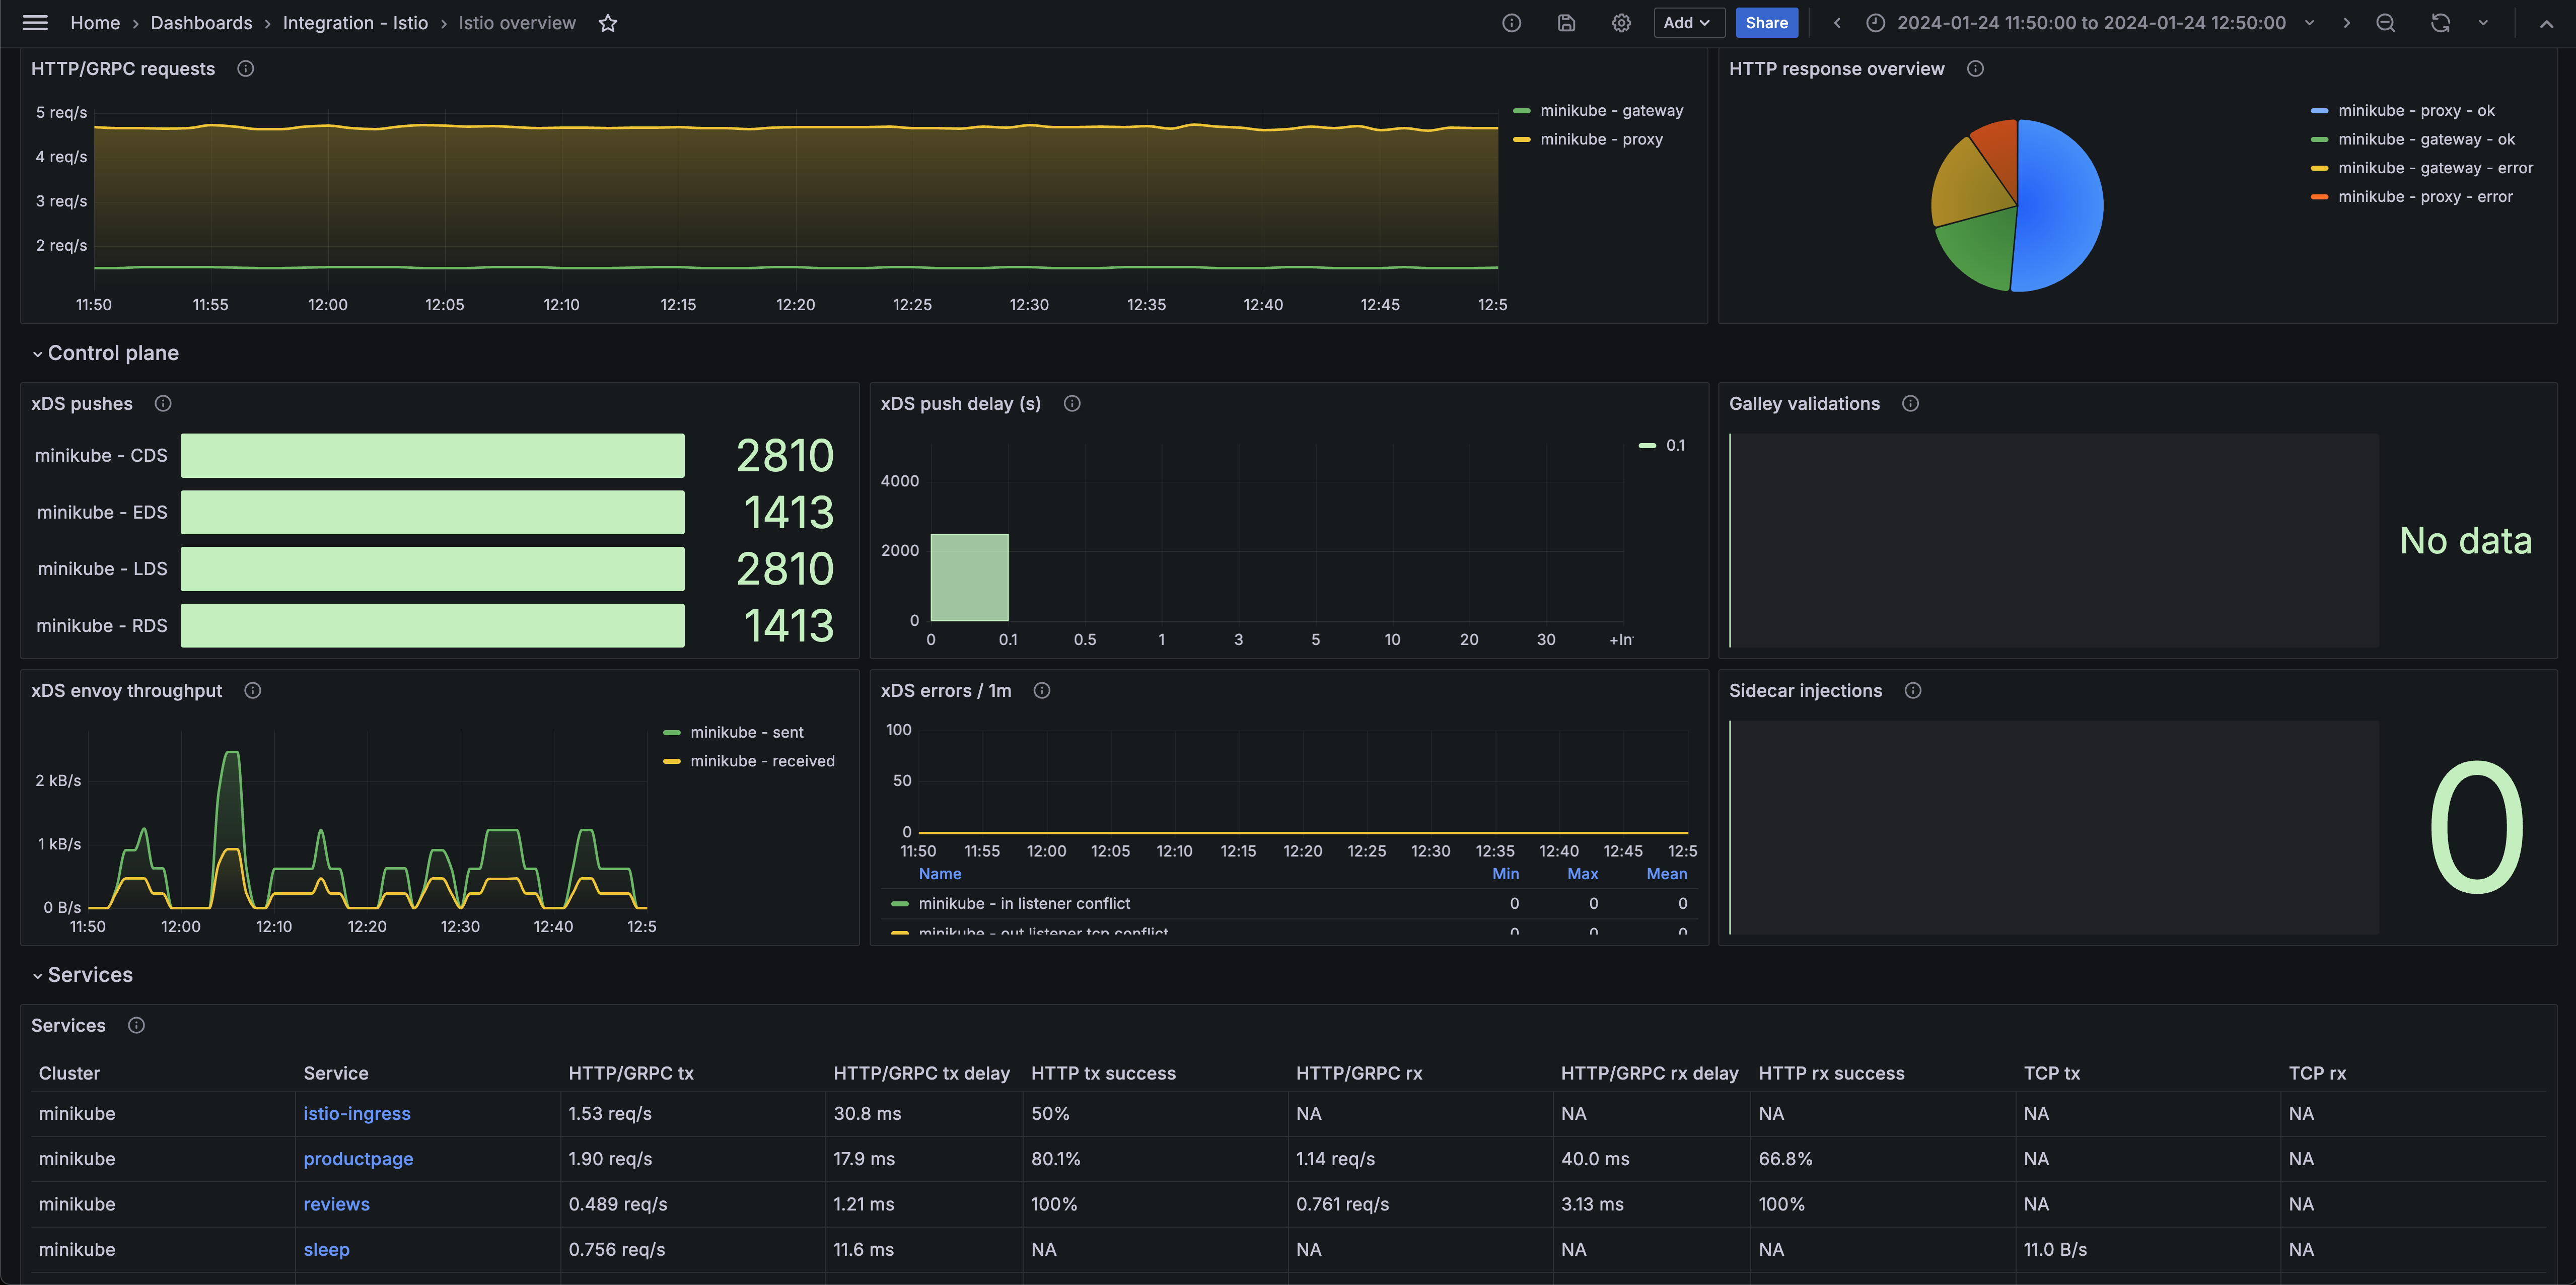
- Istio overview
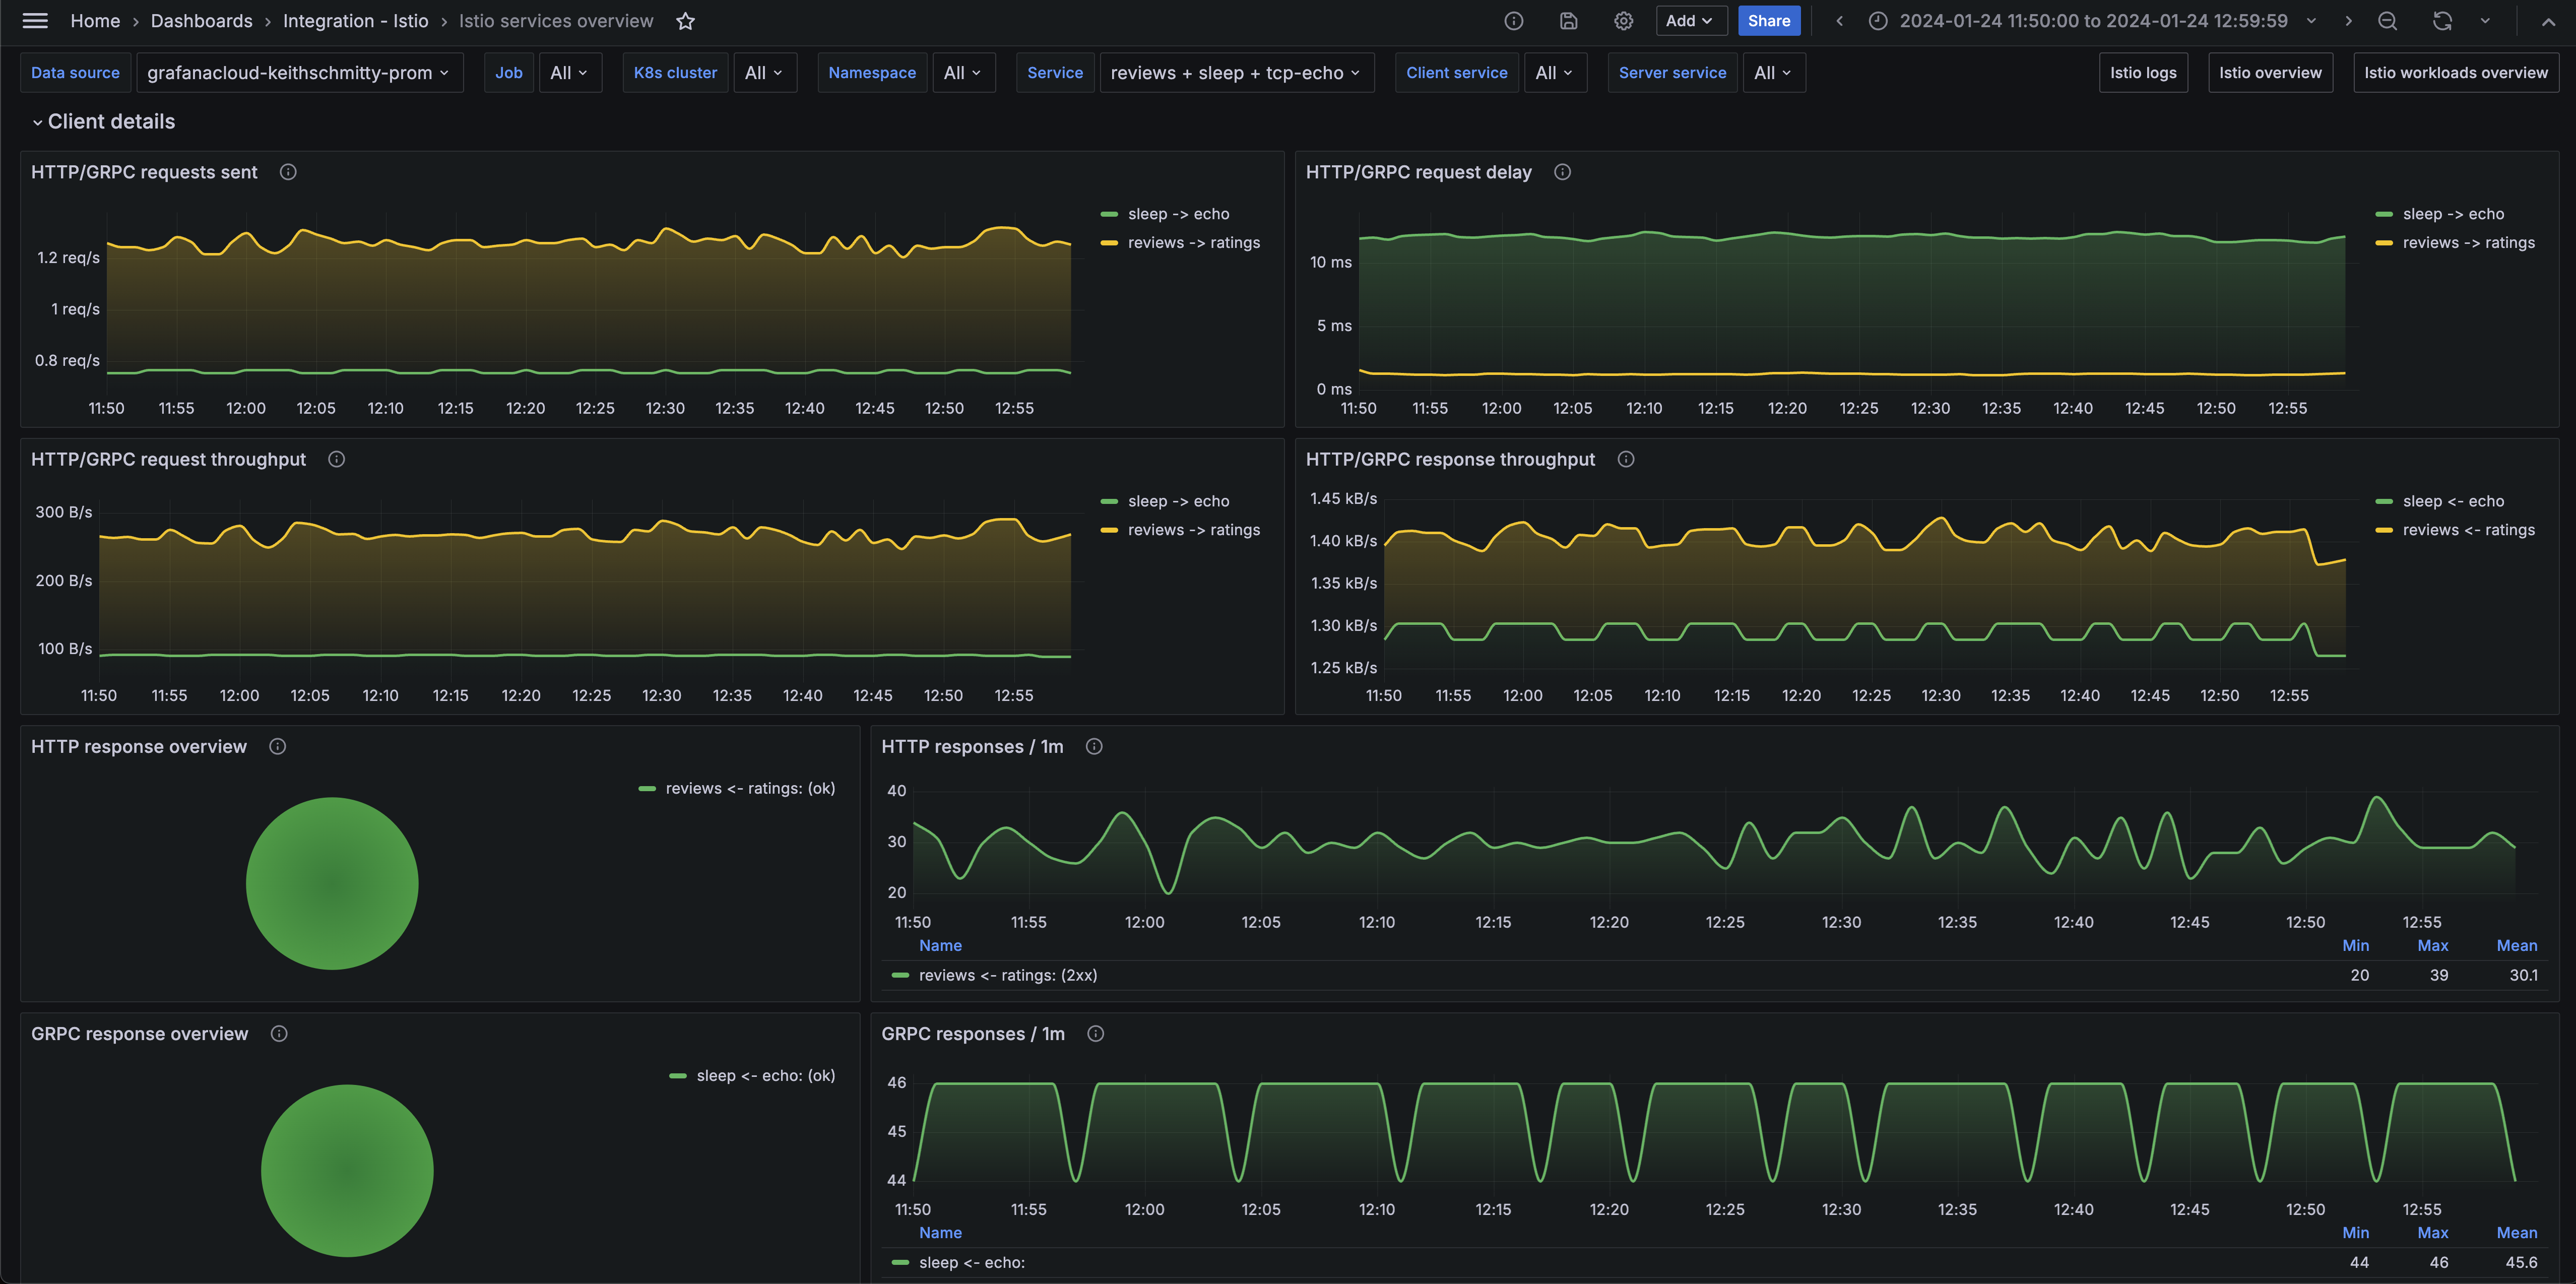
- Istio services overview
- Istio workloads overview
Istio overview (system)

Istio overview (control plane)

Istio services overview (client)

Alerts
The Istio integration includes the following useful alerts:
| Alert | Description |
|---|---|
| IstioHighRequestLatencyWarning | Warning: High request latency between pods can indicate that there are performance issues within the k8s environment. |
| IstioGalleyValidationFailuresWarning | Warning: Istio Galley is reporting failures for a number of configurations. |
| IstioListenerConfigConflictsCritical | Critical: Istio Pilot is seeing a number of inbound and or outbound listener conflicts by envoy proxies. |
| IstioXDSConfigRejectionsWarning | Warning: Istio Pilot is seeing a number of xDS rejections from envoy proxies. |
| IstioHighHTTPRequestErrorsCritical | Critical: There are a high number of HTTP request errors in the Istio system. |
| IstioHighGRPCRequestErrorsCritical | Critical: There are a high number of GRPC request errors in the Istio system. |
| IstioMetricsDown | Critical: Istio metrics are down. |
Metrics
The most important metrics provided by the Istio integration, which are used on the pre-built dashboards and Prometheus alerts, are as follows:
- envoy_cluster_upstream_cx_rx_bytes_total
- envoy_cluster_upstream_cx_tx_bytes_total
- galley_validation_failed
- galley_validation_passed
- go_memstats_heap_alloc_bytes
- go_memstats_heap_inuse_bytes
- go_memstats_heap_sys_bytes
- istio_agent_go_memstats_heap_alloc_bytes
- istio_agent_go_memstats_heap_inuse_bytes
- istio_agent_go_memstats_heap_sys_bytes
- istio_agent_process_cpu_seconds_total
- istio_agent_process_open_fds
- istio_agent_process_resident_memory_bytes
- istio_agent_process_virtual_memory_bytes
- istio_build
- istio_request_bytes_sum
- istio_request_duration_milliseconds_count
- istio_request_duration_milliseconds_sum
- istio_requests_total
- istio_response_bytes_sum
- istio_tcp_received_bytes_total
- istio_tcp_sent_bytes_total
- istiod_uptime_seconds
- pilot_conflict_inbound_listener
- pilot_conflict_outbound_listener_tcp_over_current_tcp
- pilot_info
- pilot_k8s_cfg_events
- pilot_total_xds_internal_errors
- pilot_total_xds_rejects
- pilot_xds_cds_reject
- pilot_xds_eds_reject
- pilot_xds_lds_reject
- pilot_xds_pushes
- pilot_xds_rds_reject
- pilot_xds_write_timeout
- process_cpu_seconds_total
- process_open_fds
- process_resident_memory_bytes
- process_virtual_memory_bytes
- sidecar_injection_failure_total
- sidecar_injection_success_total
- up
Changelog
# 1.0.1 - April 2024

- Update to support installation via Kubernetes Monitoring App

# 1.0.0 - March 2024

- Initial release
Cost
By connecting your Istio instance to Grafana Cloud, you might incur charges. To view information on the number of active series that your Grafana Cloud account uses for metrics included in each Cloud tier, see Active series and dpm usage and Cloud tier pricing.
Was this page helpful?
Related resources from Grafana Labs


