
InfluxDB integration for Grafana Cloud
InfluxDB is a high-performance, open-source, time-series database system designed for handling, analyzing, and visualizing time-series data in real time. InfluxDB is commonly used in various industries, including DevOps and infrastructure monitoring, IoT applications, real-time analytics, and more.
This integration supports InfluxDB OSS 2.7.1+
This integration includes 6 useful alerts and 3 pre-built dashboards to help monitor and visualize InfluxDB metrics and logs.
Before you begin
Metrics
InfluxDB exposes a Prometheus metrics endpoint, /metrics, that is enabled by default.
To verify that this endpoint is enabled by running the following command on an InfluxDB node:
curl <your-hostname>:<your-influxdb-port>/metricsLogs
By default, InfluxDB logs to STDOUT. For Kubernetes and Docker, no additional configuration is required. To monitor InfluxDB logs on Linux, Darwin, or Windows platforms, configure logging to a file.
First, create a log file with proper permissions:
touch /path/to/influxdb.log
chown influxdb /path/to/influxdb.log
When starting InfluxDB using the influxd daemon or a script, redirect STDOUT to a file on startup:
influxd 1> /path/to/influxdb.logWhen running InfluxDB using the service manager on Linux, modify the first line of the startup script at /usr/lib/influxdb/scripts/influxd-systemd-start.sh to look like this:
/usr/bin/influxd 1> /path/to/influxdb.log &For up-to-date information on logging to a file in InfluxDB, refer to this documentation.
Install InfluxDB integration for Grafana Cloud
- In your Grafana Cloud stack, click Connections in the left-hand menu.
- Find InfluxDB and click its tile to open the integration.
- Review the prerequisites in the Configuration Details tab and set up Grafana Agent to send InfluxDB metrics and logs to your Grafana Cloud instance.
- Click Install to add this integration’s pre-built dashboards and alerts to your Grafana Cloud instance, and you can start monitoring your InfluxDB setup.
Configuration snippets for Grafana Alloy
Advanced mode
The following snippets provide examples to guide you through the configuration process.
To instruct Grafana Alloy to scrape your InfluxDB instances, manually copy and append the snippets to your alloy configuration file, then follow subsequent instructions.
Advanced metrics snippets
prometheus.scrape "metrics_integrations_integrations_influxdb" {
	targets = [{
		__address__      = "constants.hostname:<port>",
		influxdb_cluster = "<your-cluster-name>",
		instance         = constants.hostname,
	}]
	forward_to = [prometheus.remote_write.metrics_service.receiver]
	job_name   = "integrations/influxdb"
}
To monitor your InfluxDB instance, you must use a discovery.relabel component to discover your InfluxDB Prometheus endpoint and apply appropriate labels, followed by a prometheus.scrape component to scrape it.
Configure the following properties within each discovery.relabel component:
__address__: The address to your InfluxDB Prometheus metrics endpoint.instancelabel:constants.hostnamesets theinstancelabel to your Grafana Alloy server hostname. If that is not suitable, change it to a value uniquely identifies this InfluxDB instance. Make sure this label value is the same for all telemetry data collected for this instance.influxdb_clusterlabel must be set to a value that identifies your InfluxDB cluster.
If you have multiple InfluxDB servers to scrape, configure one discovery.relabel for each and scrape them by including each under targets within the prometheus.scrape component.
Advanced logs snippets
darwin
local.file_match "logs_integrations_integrations_influxdb" {
	path_targets = [{
		__address__      = "<hostname>",
		__path__         = "/var/log/influxdb/influxdb.log",
		influxdb_cluster = "<your-cluster-name>",
		instance         = constants.hostname,
		job              = "integrations/influxdb",
	}]
}

loki.process "logs_integrations_integrations_influxdb" {
	forward_to = [loki.write.grafana_cloud_loki.receiver]

	stage.multiline {
		firstline     = "ts=\\d{4}"
		max_lines     = 0
		max_wait_time = "3s"
	}

	stage.regex {
		expression = "ts=(\\S+) lvl=(?P<level>\\w+) msg=.* log_id=(\\S+) (service=\"{0,1}(?P<service>\\S+) ){0,1}(engine=(?P<engine>\\S*) ){0,1}.*$"
	}

	stage.labels {
		values = {
			engine  = null,
			level   = null,
			service = null,
		}
	}
}

loki.source.file "logs_integrations_integrations_influxdb" {
	targets    = local.file_match.logs_integrations_integrations_influxdb.targets
	forward_to = [loki.process.logs_integrations_integrations_influxdb.receiver]
}
To monitor your InfluxDB instance logs, you will use a combination of the following components:
local.file_match defines where to find the log file to be scraped. Change the following properties according to your environment:
__address__: The InfluxDB instance address__path__: The path to the log file.instancelabel:constants.hostnamesets theinstancelabel to your Grafana Alloy server hostname. If that is not suitable, change it to a value uniquely identifies this InfluxDB instance. Make sure this label value is the same for all telemetry data collected for this instance.influxdb_clusterlabel must be set to a value that identifies your InfluxDB cluster.
loki.process defines how to process logs before sending it to Loki.
loki.source.file sends logs to Loki.
linux
local.file_match "logs_integrations_integrations_influxdb" {
	path_targets = [{
		__address__      = "<hostname>",
		__path__         = "/var/log/influxdb/influxdb.log",
		influxdb_cluster = "<your-cluster-name>",
		instance         = constants.hostname,
		job              = "integrations/influxdb",
	}]
}

loki.process "logs_integrations_integrations_influxdb" {
	forward_to = [loki.write.grafana_cloud_loki.receiver]

	stage.multiline {
		firstline     = "ts=\\d{4}"
		max_lines     = 0
		max_wait_time = "3s"
	}

	stage.regex {
		expression = "ts=(\\S+) lvl=(?P<level>\\w+) msg=.* log_id=(\\S+) (service=\"{0,1}(?P<service>\\S+) ){0,1}(engine=(?P<engine>\\S*) ){0,1}.*$"
	}

	stage.labels {
		values = {
			engine  = null,
			level   = null,
			service = null,
		}
	}
}

loki.source.file "logs_integrations_integrations_influxdb" {
	targets    = local.file_match.logs_integrations_integrations_influxdb.targets
	forward_to = [loki.process.logs_integrations_integrations_influxdb.receiver]
}
To monitor your InfluxDB instance logs, you will use a combination of the following components:
local.file_match defines where to find the log file to be scraped. Change the following properties according to your environment:
__address__: The InfluxDB instance address__path__: The path to the log file.instancelabel:constants.hostnamesets theinstancelabel to your Grafana Alloy server hostname. If that is not suitable, change it to a value uniquely identifies this InfluxDB instance. Make sure this label value is the same for all telemetry data collected for this instance.influxdb_clusterlabel must be set to a value that identifies your InfluxDB cluster.
loki.process defines how to process logs before sending it to Loki.
loki.source.file sends logs to Loki.
windows
local.file_match "logs_integrations_integrations_influxdb" {
	path_targets = [{
		__address__      = "<hostname>",
		__path__         = "/var/log/influxdb/influxdb.log",
		influxdb_cluster = "<your-cluster-name>",
		instance         = constants.hostname,
		job              = "integrations/influxdb",
	}]
}

loki.process "logs_integrations_integrations_influxdb" {
	forward_to = [loki.write.grafana_cloud_loki.receiver]

	stage.multiline {
		firstline     = "ts=\\d{4}"
		max_lines     = 0
		max_wait_time = "3s"
	}

	stage.regex {
		expression = "ts=(\\S+) lvl=(?P<level>\\w+) msg=.* log_id=(\\S+) (service=\"{0,1}(?P<service>\\S+) ){0,1}(engine=(?P<engine>\\S*) ){0,1}.*$"
	}

	stage.labels {
		values = {
			engine  = null,
			level   = null,
			service = null,
		}
	}
}

loki.source.file "logs_integrations_integrations_influxdb" {
	targets    = local.file_match.logs_integrations_integrations_influxdb.targets
	forward_to = [loki.process.logs_integrations_integrations_influxdb.receiver]
}
To monitor your InfluxDB instance logs, you will use a combination of the following components:
local.file_match defines where to find the log file to be scraped. Change the following properties according to your environment:
__address__: The InfluxDB instance address__path__: The path to the log file.instancelabel:constants.hostnamesets theinstancelabel to your Grafana Alloy server hostname. If that is not suitable, change it to a value uniquely identifies this InfluxDB instance. Make sure this label value is the same for all telemetry data collected for this instance.influxdb_clusterlabel must be set to a value that identifies your InfluxDB cluster.
loki.process defines how to process logs before sending it to Loki.
loki.source.file sends logs to Loki.
Grafana Agent static configuration (deprecated)
The following section shows configuration for running Grafana Agent in static mode which is deprecated. You should use Grafana Alloy for all new deployments.
Before you begin
Metrics
InfluxDB exposes a Prometheus metrics endpoint, /metrics, that is enabled by default.
To verify that this endpoint is enabled by running the following command on an InfluxDB node:
curl <your-hostname>:<your-influxdb-port>/metricsLogs
By default, InfluxDB logs to STDOUT. For Kubernetes and Docker, no additional configuration is required. To monitor InfluxDB logs on Linux, Darwin, or Windows platforms, configure logging to a file.
First, create a log file with proper permissions:
touch /path/to/influxdb.log
chown influxdb /path/to/influxdb.log
When starting InfluxDB using the influxd daemon or a script, redirect STDOUT to a file on startup:
influxd 1> /path/to/influxdb.logWhen running InfluxDB using the service manager on Linux, modify the first line of the startup script at /usr/lib/influxdb/scripts/influxd-systemd-start.sh to look like this:
/usr/bin/influxd 1> /path/to/influxdb.log &For up-to-date information on logging to a file in InfluxDB, refer to this documentation.
Install InfluxDB integration for Grafana Cloud
- In your Grafana Cloud stack, click Connections in the left-hand menu.
- Find InfluxDB and click its tile to open the integration.
- Review the prerequisites in the Configuration Details tab and set up Grafana Agent to send InfluxDB metrics and logs to your Grafana Cloud instance.
- Click Install to add this integration’s pre-built dashboards and alerts to your Grafana Cloud instance, and you can start monitoring your InfluxDB setup.
Post-install configuration for the InfluxDB integration
To show logs and metrics signals correlated in your dashboards, as a single pane of glass, ensure the following:
job,influxdb_cluster, andinstancelabel values must match for metrics and logs scrape config in your agent configuration file.joblabel must be set tointegrations/influxdb(already configured in the snippets).influxdb_clusterlabel must be set to a value that identifies your InfluxDB cluster.instancelabel must be set to a value that uniquely identifies your InfluxDB node. Please replace the default hostname value according to your environment - it must be set manually.
Configuration snippets for Grafana Agent
Below metrics.configs.scrape_configs, insert the following lines and change the URLs according to your environment:
    - job_name: integrations/influxdb
      metrics_path: /metrics
      static_configs:
        - targets: ["<hostname>:<port>"]
          labels:
            influxdb_cluster: <your-cluster-name>
            instance: <your-instance-name>
Below logs.configs.scrape_configs, insert the following lines according to your environment.
    - job_name: integrations/influxdb
      static_configs:
        - targets:
            - <hostname>
          labels:
            job: integrations/influxdb
            influxdb_cluster: <your-cluster-name>
            instance: <your-instance-name>
            __path__: /var/log/influxdb/influxdb.log
      pipeline_stages:
        - multiline:
            firstline: 'ts=\d{4}'
        - regex:
            expression: 'ts=(\S+) lvl=(?P<level>\w+) msg=.* log_id=(\S+) (service="{0,1}(?P<service>\S+) ){0,1}(engine=(?P<engine>\S*) ){0,1}.*$'
        - labels:
            level:
            service:
            engine:
Full example configuration for Grafana Agent
Refer to the following Grafana Agent configuration for a complete example that contains all the snippets used for the InfluxDB integration. This example also includes metrics that are sent to monitor your Grafana Agent instance.
integrations:
  prometheus_remote_write:
  - basic_auth:
      password: <your_prom_pass>
      username: <your_prom_user>
    url: <your_prom_url>
  agent:
    enabled: true
    relabel_configs:
    - action: replace
      source_labels:
      - agent_hostname
      target_label: instance
    - action: replace
      target_label: job
      replacement: "integrations/agent-check"
    metric_relabel_configs:
    - action: keep
      regex: (prometheus_target_sync_length_seconds_sum|prometheus_target_scrapes_.*|prometheus_target_interval.*|prometheus_sd_discovered_targets|agent_build.*|agent_wal_samples_appended_total|process_start_time_seconds)
      source_labels:
      - __name__
  # Add here any snippet that belongs to the `integrations` section.
  # For a correct indentation, paste snippets copied from Grafana Cloud at the beginning of the line.
logs:
  configs:
  - clients:
    - basic_auth:
        password: <your_loki_pass>
        username: <your_loki_user>
      url: <your_loki_url>
    name: integrations
    positions:
      filename: /tmp/positions.yaml
    scrape_configs:
      # Add here any snippet that belongs to the `logs.configs.scrape_configs` section.
      # For a correct indentation, paste snippets copied from Grafana Cloud at the beginning of the line.
    - job_name: integrations/influxdb
      static_configs:
        - targets:
            - <hostname>
          labels:
            job: integrations/influxdb
            influxdb_cluster: <your-cluster-name>
            instance: <your-instance-name>
            __path__: /var/log/influxdb/influxdb.log
      pipeline_stages:
        - multiline:
            firstline: 'ts=\d{4}'
        - regex:
            expression: 'ts=(\S+) lvl=(?P<level>\w+) msg=.* log_id=(\S+) (service="{0,1}(?P<service>\S+) ){0,1}(engine=(?P<engine>\S*) ){0,1}.*$'
        - labels:
            level:
            service:
            engine:
metrics:
  configs:
  - name: integrations
    remote_write:
    - basic_auth:
        password: <your_prom_pass>
        username: <your_prom_user>
      url: <your_prom_url>
    scrape_configs:
      # Add here any snippet that belongs to the `metrics.configs.scrape_configs` section.
      # For a correct indentation, paste snippets copied from Grafana Cloud at the beginning of the line.
    - job_name: integrations/influxdb
      metrics_path: /metrics
      static_configs:
        - targets: ["<hostname>:<port>"]
          labels:
            influxdb_cluster: <your-cluster-name>
            instance: <your-instance-name>
  global:
    scrape_interval: 60s
  wal_directory: /tmp/grafana-agent-wal
Dashboards
The InfluxDB integration installs the following dashboards in your Grafana Cloud instance to help monitor your system.
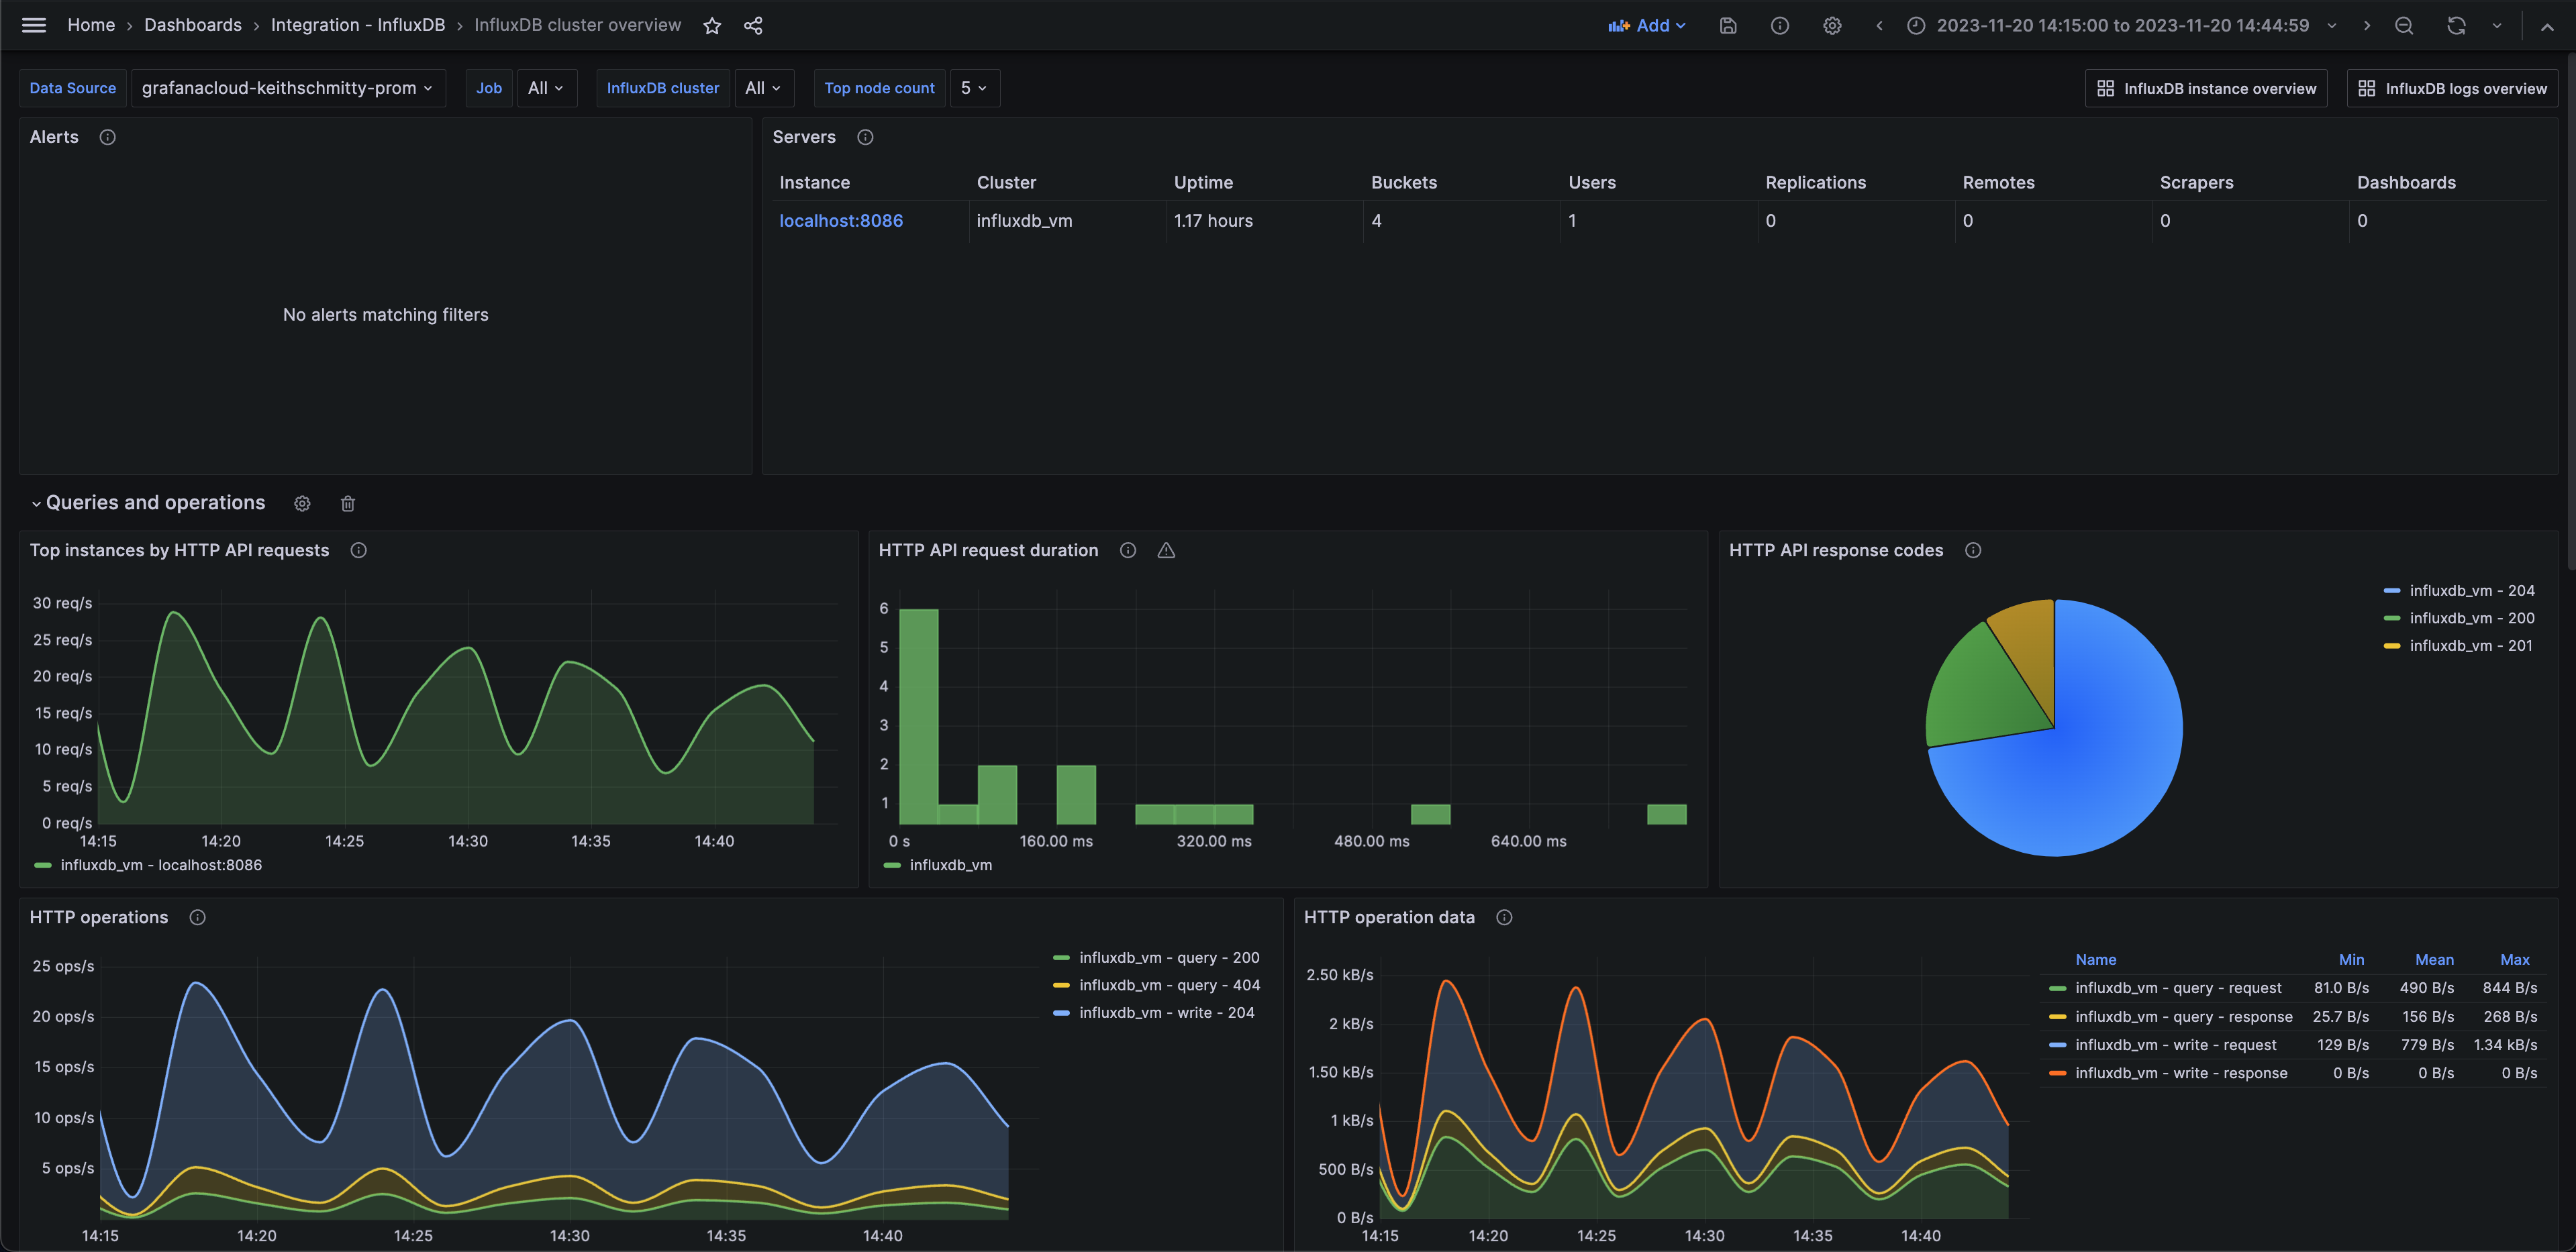
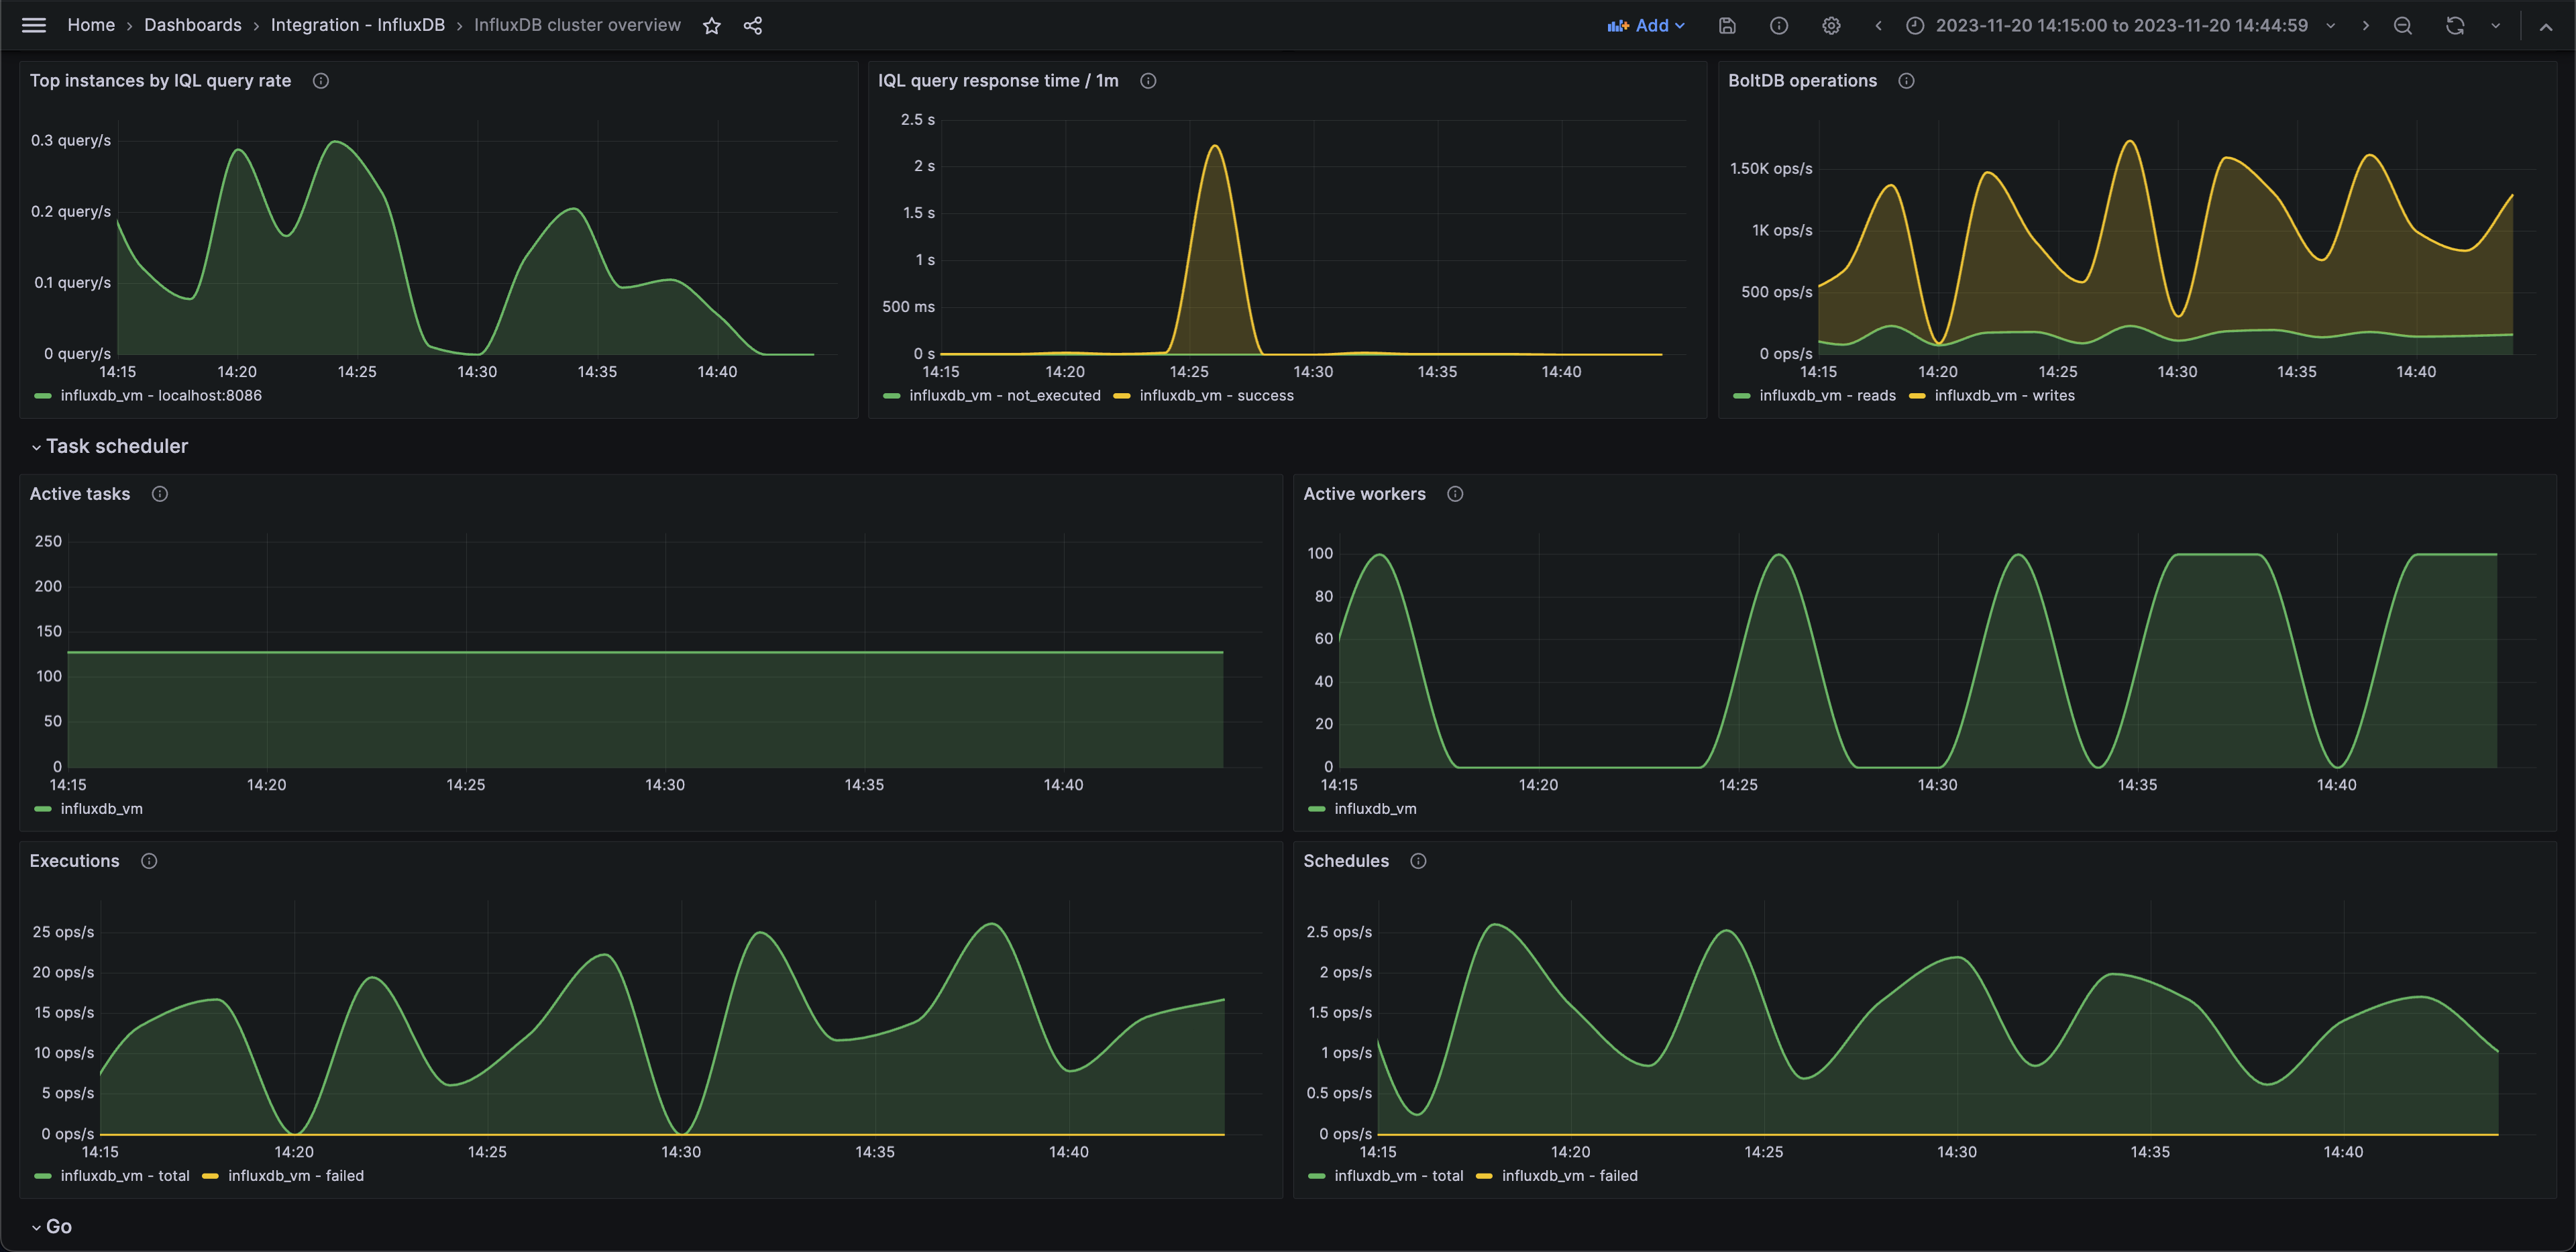
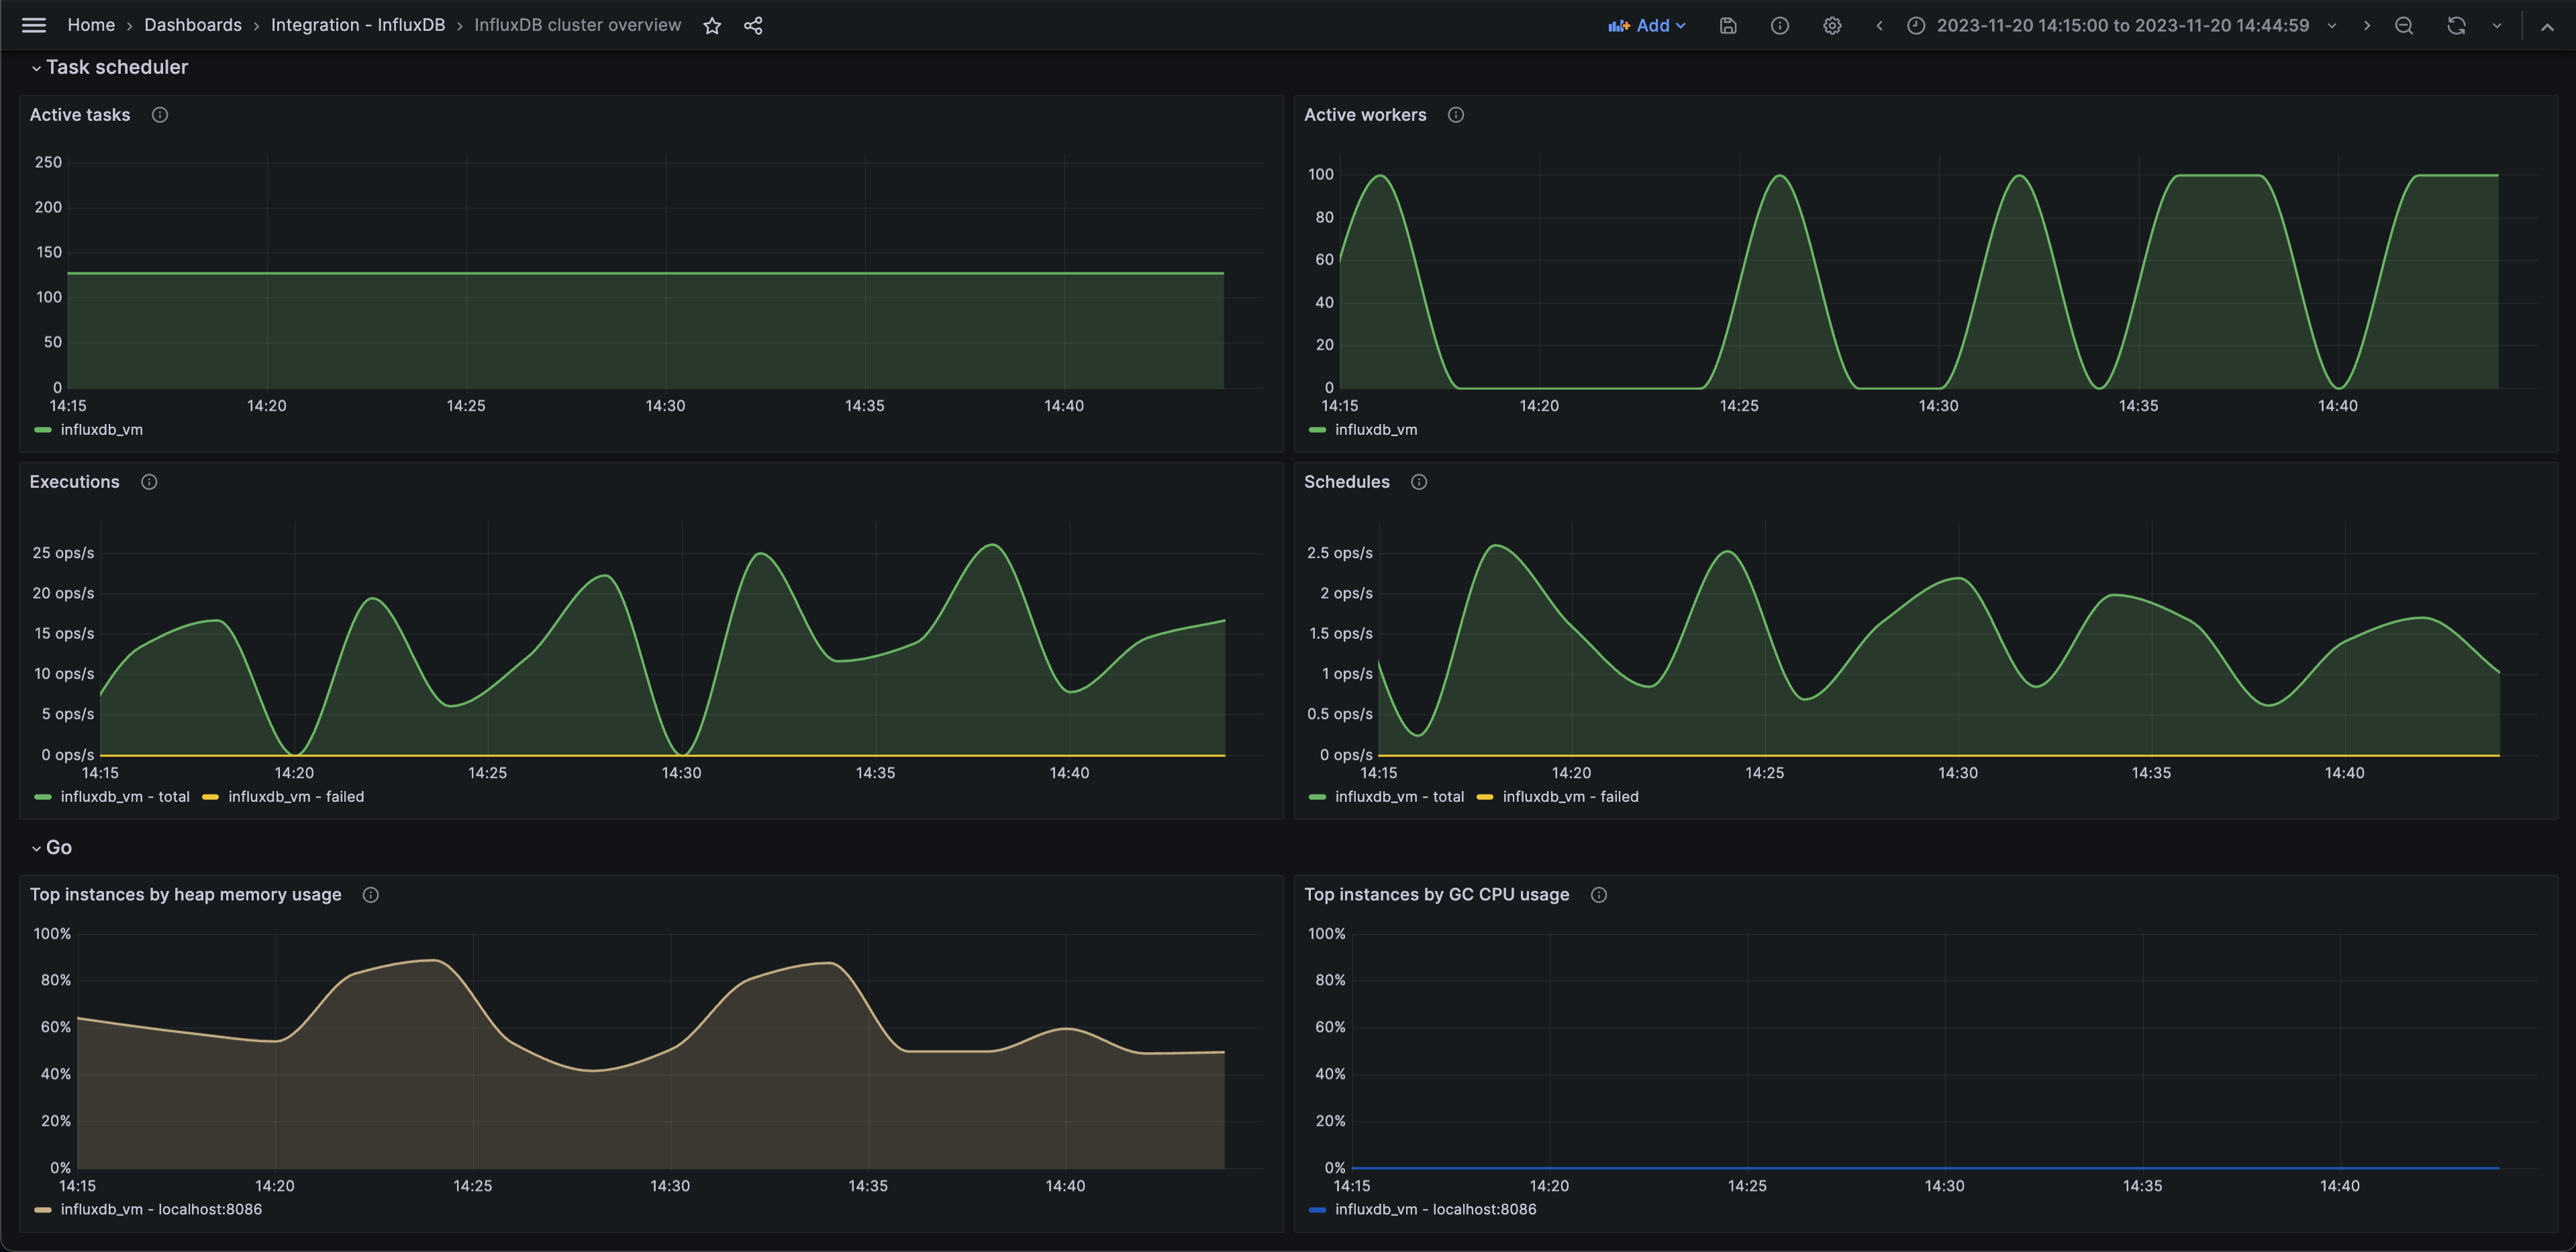
- InfluxDB cluster overview
- InfluxDB instance overview
- InfluxDB logs overview
InfluxDB cluster overview (queries)
InfluxDB cluster overview (tasks)
InfluxDB cluster overview (Go)
Alerts
The InfluxDB integration includes the following useful alerts:
| Alert | Description |
|---|---|
| InfluxDBWarningTaskSchedulerHighFailureRate | Warning: Automated data processing tasks are failing at a high rate. |
| InfluxDBCriticalTaskSchedulerHighFailureRate | Critical: Automated data processing tasks are failing at a critical rate. |
| InfluxDBHighBusyWorkerPercentage | Critical: There is a high percentage of busy workers. |
| InfluxDBHighHeapMemoryUsage | Critical: There is a high amount of heap memory being used. |
| InfluxDBHighAverageAPIRequestLatency | Critical: Average API request latency is too high. High latency will negatively affect system performance, degrading data availability and precision. |
| InfluxDBSlowAverageIQLExecutionTime | Warning: InfluxQL execution times are too slow. Slow query execution times will negatively affect system performance, degrading data availability and precision. |
Metrics
The most important metrics provided by the InfluxDB integration, which are used on the pre-built dashboards and Prometheus alerts, are as follows:
- boltdb_reads_total
- boltdb_writes_total
- go_gc_duration_seconds_sum
- go_memstats_gc_cpu_fraction
- go_memstats_heap_alloc_bytes
- go_memstats_heap_idle_bytes
- go_memstats_last_gc_time_seconds
- go_threads
- http_api_request_duration_seconds_sum
- http_api_requests_total
- http_query_request_bytes
- http_query_request_count
- http_query_response_bytes
- http_write_request_bytes
- http_write_request_count
- http_write_response_bytes
- influxdb_buckets_total
- influxdb_dashboards_total
- influxdb_remotes_total
- influxdb_replications_total
- influxdb_scrapers_total
- influxdb_uptime_seconds
- influxdb_users_total
- influxql_service_executing_duration_seconds_sum
- influxql_service_requests_total
- qc_compiling_active
- qc_executing_active
- qc_queueing_active
- task_executor_total_runs_active
- task_executor_workers_busy
- task_scheduler_current_execution
- task_scheduler_total_execute_failure
- task_scheduler_total_execution_calls
- task_scheduler_total_schedule_calls
- task_scheduler_total_schedule_fails
- up
Changelog
# 1.0.0 - January 2023

- Initial release
Cost
By connecting your InfluxDB instance to Grafana Cloud, you might incur charges. To view information on the number of active series that your Grafana Cloud account uses for metrics included in each Cloud tier, see Active series and dpm usage and Cloud tier pricing.
Was this page helpful?
Related resources from Grafana Labs


