
GitLab integration for Grafana Cloud
GitLab is an open-source DevOps platform for software development. The GitLab integration uses the Grafana agent to collect metrics for monitoring a GitLab EE (Enterprise Edition) instance, including aspects such as HTTP request rates, HTTP request latencies, and CI pipeline creation rates. The integration also supports the rails error logs being scraped by the agent using Promtail. An accompanying dashboard is provided to visualize these metrics and logs.
This integration supports GitLab EE 15.3.3+.
This integration includes 4 useful alerts and 1 pre-built dashboard to help monitor and visualize GitLab metrics and logs.
Before you begin
In order for the integration to work, you must configure your GitLab EE instance to expose its metrics through it’s built in prometheus metrics server.
It is required to first enable the prometheus metrics as described in the GitLab documentation.
In order to collect metrics using the agent, the local IP must be added to the monitoring whitelist in /etc/gitlab/gitlab.rb:
gitlab_rails['monitoring_whitelist'] = ['127.0.0.0/8']Then, GitLab must be restarted for the above change to take effect:
sudo gitlab-ctl restartInstall GitLab integration for Grafana Cloud
- In your Grafana Cloud stack, click Connections in the left-hand menu.
- Find GitLab and click its tile to open the integration.
- Review the prerequisites in the Configuration Details tab and set up Grafana Agent to send GitLab metrics and logs to your Grafana Cloud instance.
- Click Install to add this integration’s pre-built dashboard and alerts to your Grafana Cloud instance, and you can start monitoring your GitLab setup.
Configuration snippets for Grafana Alloy
Simple mode
These snippets are configured to scrape a single GitLab instance running locally with default ports.
First, manually copy and append the following snippets into your alloy configuration file.
Metrics snippets
discovery.relabel "metrics_integrations_integrations_gitlab" {
	targets = [{
		__address__ = "localhost:80",
	}]

	rule {
		target_label = "instance"
		replacement  = constants.hostname
	}
}

prometheus.scrape "metrics_integrations_integrations_gitlab" {
	targets      = discovery.relabel.metrics_integrations_integrations_gitlab.output
	forward_to   = [prometheus.remote_write.metrics_service.receiver]
	job_name     = "integrations/gitlab"
	metrics_path = "/-/metrics"
}
Logs snippets
linux
local.file_match "logs_integrations_integrations_gitlab" {
	path_targets = [{
		__address__ = "localhost",
		__path__    = "/var/log/gitlab/gitlab-rails/exceptions_json.log",
		instance    = constants.hostname,
		job         = "integrations/gitlab",
	}]
}

loki.process "logs_integrations_integrations_gitlab" {
	forward_to = [loki.write.grafana_cloud_loki.receiver]

	stage.match {
		selector            = "{job=\"integrations/gitlab\"} |~ \"^#\""
		action              = "drop"
		drop_counter_reason = "gitlab_comment_line"
	}
}

loki.source.file "logs_integrations_integrations_gitlab" {
	targets    = local.file_match.logs_integrations_integrations_gitlab.targets
	forward_to = [loki.process.logs_integrations_integrations_gitlab.receiver]
}
Advanced mode
The following snippets provide examples to guide you through the configuration process.
To instruct Grafana Alloy to scrape your GitLab instances, manually copy and append the snippets to your alloy configuration file, then follow subsequent instructions.
Advanced metrics snippets
discovery.relabel "metrics_integrations_integrations_gitlab" {
	targets = [{
		__address__ = "localhost:80",
	}]

	rule {
		target_label = "instance"
		replacement  = constants.hostname
	}
}

prometheus.scrape "metrics_integrations_integrations_gitlab" {
	targets      = discovery.relabel.metrics_integrations_integrations_gitlab.output
	forward_to   = [prometheus.remote_write.metrics_service.receiver]
	job_name     = "integrations/gitlab"
	metrics_path = "/-/metrics"
}
To monitor your GitLab instance, you must use a discovery.relabel component to discover your GitLab Prometheus endpoint and apply appropriate labels, followed by a prometheus.scrape component to scrape it.
Configure the following properties within each discovery.relabel component:
__address__: The address to your GitLab Prometheus metrics endpoint.instancelabel:constants.hostnamesets theinstancelabel to your Grafana Alloy server hostname. If that is not suitable, change it to a value uniquely identifies this GitLab instance. Make sure this label value is the same for all telemetry data collected for this instance.
If you have multiple GitLab servers to scrape, configure one discovery.relabel for each and scrape them by including each under targets within the prometheus.scrape component.
Advanced logs snippets
linux
local.file_match "logs_integrations_integrations_gitlab" {
	path_targets = [{
		__address__ = "localhost",
		__path__    = "/var/log/gitlab/gitlab-rails/exceptions_json.log",
		instance    = constants.hostname,
		job         = "integrations/gitlab",
	}]
}

loki.process "logs_integrations_integrations_gitlab" {
	forward_to = [loki.write.grafana_cloud_loki.receiver]

	stage.match {
		selector            = "{job=\"integrations/gitlab\"} |~ \"^#\""
		action              = "drop"
		drop_counter_reason = "gitlab_comment_line"
	}
}

loki.source.file "logs_integrations_integrations_gitlab" {
	targets    = local.file_match.logs_integrations_integrations_gitlab.targets
	forward_to = [loki.process.logs_integrations_integrations_gitlab.receiver]
}
To monitor your GitLab instance logs, you will use a combination of the following components:
local.file_match defines where to find the log file to be scraped. Change the following properties according to your environment:
__address__: The GitLab instance address__path__: The path to the log file.instancelabel:constants.hostnamesets theinstancelabel to your Grafana Alloy server hostname. If that is not suitable, change it to a value uniquely identifies this GitLab instance. Make sure this label value is the same for all telemetry data collected for this instance.
loki.process defines how to process logs before sending it to Loki.
loki.source.file sends logs to Loki.
Grafana Agent static configuration (deprecated)
The following section shows configuration for running Grafana Agent in static mode which is deprecated. You should use Grafana Alloy for all new deployments.
Before you begin
In order for the integration to work, you must configure your GitLab EE instance to expose its metrics through it’s built in prometheus metrics server.
It is required to first enable the prometheus metrics as described in the GitLab documentation.
In order to collect metrics using the agent, the local IP must be added to the monitoring whitelist in /etc/gitlab/gitlab.rb:
gitlab_rails['monitoring_whitelist'] = ['127.0.0.0/8']Then, GitLab must be restarted for the above change to take effect:
sudo gitlab-ctl restartInstall GitLab integration for Grafana Cloud
- In your Grafana Cloud stack, click Connections in the left-hand menu.
- Find GitLab and click its tile to open the integration.
- Review the prerequisites in the Configuration Details tab and set up Grafana Agent to send GitLab metrics and logs to your Grafana Cloud instance.
- Click Install to add this integration’s pre-built dashboard and alerts to your Grafana Cloud instance, and you can start monitoring your GitLab setup.
Post-install configuration for the GitLab integration
This integration supports metrics and logs from a GitLab Enterprise Edition instance.
Enable the integration by adding the provided snippets to your agent configuration file.
If you want to show logs and metrics signals correlated in your dashboards, as a single pane of glass, ensure the following:
job and instance label values must match for metrics and logs scrape configs in your agent configuration file.
job label must be set to integrations/gitlab (already configured in the snippets).
instance label must be set to a value that uniquely identifies your GitLab node. Please replace the default hostname value according to your environment - it should be set manually. Note that if you use localhost for multiple nodes, the dashboards will not be able to filter correctly by instance.
By default, the agent scrapes the rails error logs at this path: /var/log/gitlab/gitlab-rails/exceptions_json.log.
Configuration snippets for Grafana Agent
Below metrics.configs.scrape_configs, insert the following lines and change the URLs according to your environment:
    - job_name: integrations/gitlab
      metrics_path: "/-/metrics"
      relabel_configs:
        - replacement: '<your-instance-name>'
          target_label: instance
      static_configs:
        - targets: ['localhost:80']
Below logs.configs.scrape_configs, insert the following lines according to your environment.
    - job_name: integrations/gitlab
      static_configs:
        - targets:
          - localhost
          labels:
            instance: '<your-instance-name>'
            job: integrations/gitlab
            __path__: /var/log/gitlab/gitlab-rails/exceptions_json.log
      pipeline_stages:
        - match:
            selector: '{job="integrations/gitlab"} |~ "^#"'
            action: drop
            drop_counter_reason: gitlab_comment_line
Full example configuration for Grafana Agent
Refer to the following Grafana Agent configuration for a complete example that contains all the snippets used for the GitLab integration. This example also includes metrics that are sent to monitor your Grafana Agent instance.
integrations:
  prometheus_remote_write:
  - basic_auth:
      password: <your_prom_pass>
      username: <your_prom_user>
    url: <your_prom_url>
  agent:
    enabled: true
    relabel_configs:
    - action: replace
      source_labels:
      - agent_hostname
      target_label: instance
    - action: replace
      target_label: job
      replacement: "integrations/agent-check"
    metric_relabel_configs:
    - action: keep
      regex: (prometheus_target_sync_length_seconds_sum|prometheus_target_scrapes_.*|prometheus_target_interval.*|prometheus_sd_discovered_targets|agent_build.*|agent_wal_samples_appended_total|process_start_time_seconds)
      source_labels:
      - __name__
  # Add here any snippet that belongs to the `integrations` section.
  # For a correct indentation, paste snippets copied from Grafana Cloud at the beginning of the line.
logs:
  configs:
  - clients:
    - basic_auth:
        password: <your_loki_pass>
        username: <your_loki_user>
      url: <your_loki_url>
    name: integrations
    positions:
      filename: /tmp/positions.yaml
    scrape_configs:
      # Add here any snippet that belongs to the `logs.configs.scrape_configs` section.
      # For a correct indentation, paste snippets copied from Grafana Cloud at the beginning of the line.
    - job_name: integrations/gitlab
      static_configs:
        - targets:
          - localhost
          labels:
            instance: '<your-instance-name>'
            job: integrations/gitlab
            __path__: /var/log/gitlab/gitlab-rails/exceptions_json.log
      pipeline_stages:
        - match:
            selector: '{job="integrations/gitlab"} |~ "^#"'
            action: drop
            drop_counter_reason: gitlab_comment_line
metrics:
  configs:
  - name: integrations
    remote_write:
    - basic_auth:
        password: <your_prom_pass>
        username: <your_prom_user>
      url: <your_prom_url>
    scrape_configs:
      # Add here any snippet that belongs to the `metrics.configs.scrape_configs` section.
      # For a correct indentation, paste snippets copied from Grafana Cloud at the beginning of the line.
    - job_name: integrations/gitlab
      metrics_path: "/-/metrics"
      relabel_configs:
        - replacement: '<your-instance-name>'
          target_label: instance
      static_configs:
        - targets: ['localhost:80']
  global:
    scrape_interval: 60s
  wal_directory: /tmp/grafana-agent-wal
Dashboards
The GitLab integration installs the following dashboards in your Grafana Cloud instance to help monitor your system.
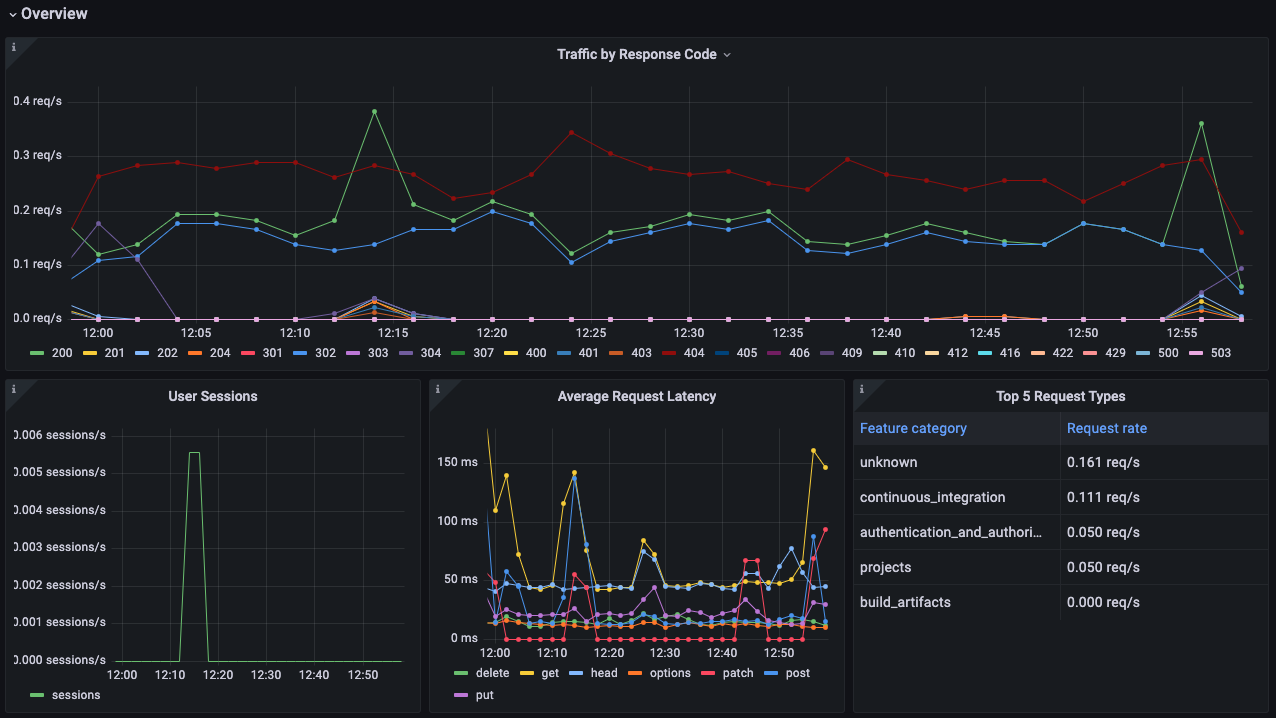
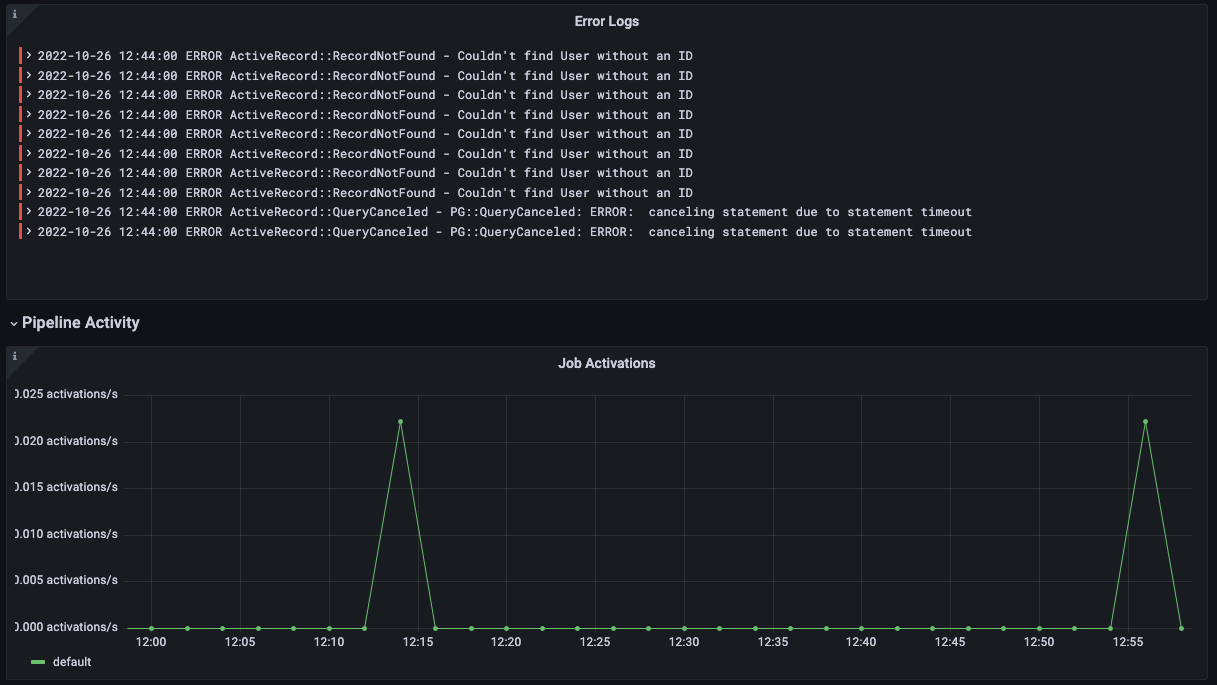
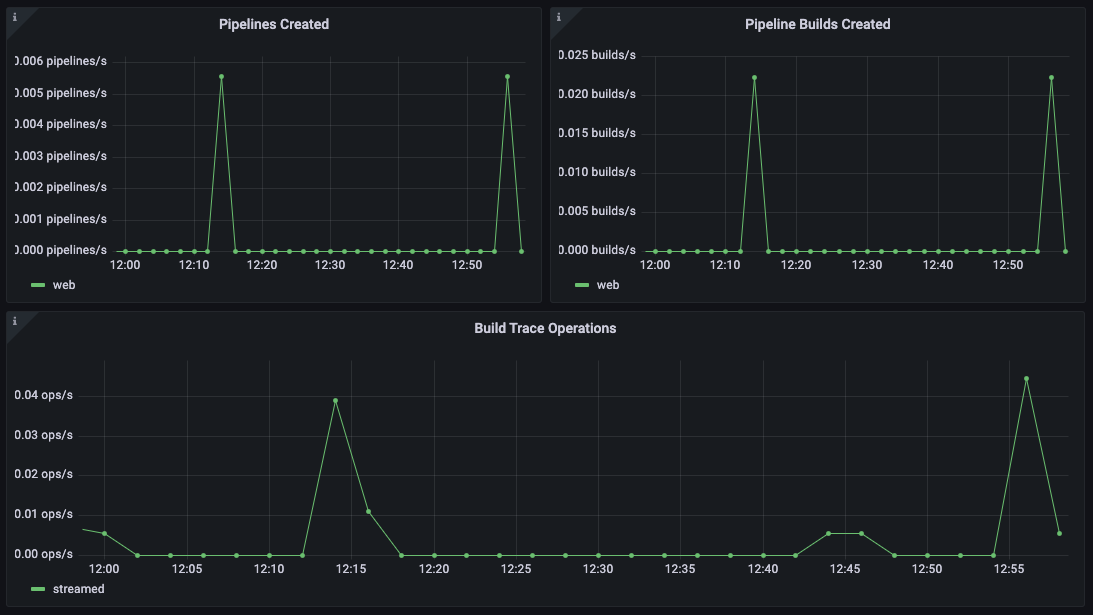
- GitLab Overview
GitLab overview dashboard 1
GitLab overview dashboard 2
GitLab overview dashboard 3
Alerts
The GitLab integration includes the following useful alerts:
| Alert | Description |
|---|---|
| GitLabHighJobRegistrationFailures | Warning: Large percentage of failed attempts to register a job. |
| GitLabHighRunnerAuthFailure | Warning: Large percentage of runner authentication failures. |
| GitLabHigh5xxResponses | Critical: Large rate of HTTP 5XX errors. |
| GitLabHigh4xxResponses | Warning: Large rate of HTTP 4XX errors. |
Metrics
The most important metrics provided by the GitLab integration, which are used on the pre-built dashboard and Prometheus alerts, are as follows:
- gitlab_ci_active_jobs_sum
- gitlab_ci_pipeline_size_builds_sum
- gitlab_ci_runner_authentication_failure_total
- gitlab_ci_runner_authentication_success_total
- gitlab_ci_trace_operations_total
- gitlab_rails_boot_time_seconds
- http_request_duration_seconds_count
- http_request_duration_seconds_sum
- http_requests_total
- job_register_attempts_failed_total
- job_register_attempts_total
- pipelines_created_total
- up
- user_session_logins_total
Changelog
# 1.0.0 - October 2023

* Added Grafana Agent Operator configuration snippet to support Gitlab in kubernetes cluster
* Added cluster selector to dashboard for kubernetes support

# 0.0.3 - September 2023

* New Filter Metrics option for configuring the Grafana Agent, which saves on metrics cost by dropping any metric not used by this integration. Beware that anything custom built using metrics that are not on the snippet will stop working.
* New hostname relabel option, which applies the instance name you write on the text box to the Grafana Agent configuration snippets, making it easier and less error prone to configure this mandatory label.

# 0.0.2 - August 2023

* Add regex filter for logs datasource

# 0.0.1 - November 2022

* Initial Release
Cost
By connecting your GitLab instance to Grafana Cloud, you might incur charges. To view information on the number of active series that your Grafana Cloud account uses for metrics included in each Cloud tier, see Active series and dpm usage and Cloud tier pricing.
Was this page helpful?
Related resources from Grafana Labs


