
Discourse integration for Grafana Cloud
Discourse is an application that is used to host a discussion platform. The Discourse integration uses the Grafana Agent to collect metrics from a Discourse instance like HTTP traffic, request rates, latency, sidekiq jobs, and browser heap usage.
This integration supports Discourse 2.8+
This integration includes 2 useful alerts and 2 pre-built dashboards to help monitor and visualize Discourse metrics.
Before you begin
This integration monitors a Discourse instance that is exposing Prometheus metrics via the official exporter plugin. Refer to the following official Discourse documentation for instructions on how to install plugins in Discourse.
In order for the plugin to work, add the plugin’s repository URL to the app.yml file, which is usually present in /var/discourse/containers.
hooks:
  after_code:
    - exec:
        cd: $home/plugins
        cmd:
          - sudo -E -u discourse git clone https://github.com/discourse/discourse-prometheus.git
Then rebuild the container:
cd /var/discourse
./launcher rebuild app
For more information on how to first install Discourse, please refer to their installation documentation.
The configuration of DISCOURSE_PROMETHEUS_TRUSTED_IP_ALLOWLIST_REGEX may also need to be configured for Grafana Alloy to be trusted to scrape the metrics.
Install Discourse integration for Grafana Cloud
- In your Grafana Cloud stack, click Connections in the left-hand menu.
- Find Discourse and click its tile to open the integration.
- Review the prerequisites in the Configuration Details tab and set up Grafana Agent to send Discourse metrics to your Grafana Cloud instance.
- Click Install to add this integration’s pre-built dashboards and alerts to your Grafana Cloud instance, and you can start monitoring your Discourse setup.
Configuration snippets for Grafana Alloy
Simple mode
These snippets are configured to scrape a single Discourse instance running locally with default ports.
First, manually copy and append the following snippets into your alloy configuration file.
Metrics snippets
discovery.relabel "metrics_integrations_integrations_discourse" {
	targets = [{
		__address__ = "localhost:80",
	}]

	rule {
		target_label = "instance"
		replacement  = constants.hostname
	}
}

prometheus.scrape "metrics_integrations_integrations_discourse" {
	targets    = discovery.relabel.metrics_integrations_integrations_discourse.output
	forward_to = [prometheus.remote_write.metrics_service.receiver]
	job_name   = "integrations/discourse"
}
Advanced mode
The following snippets provide examples to guide you through the configuration process.
To instruct Grafana Alloy to scrape your Discourse instances, manually copy and append the snippets to your alloy configuration file, then follow subsequent instructions.
Advanced metrics snippets
discovery.relabel "metrics_integrations_integrations_discourse" {
	targets = [{
		__address__ = "localhost:80",
	}]

	rule {
		target_label = "instance"
		replacement  = constants.hostname
	}
}

prometheus.scrape "metrics_integrations_integrations_discourse" {
	targets    = discovery.relabel.metrics_integrations_integrations_discourse.output
	forward_to = [prometheus.remote_write.metrics_service.receiver]
	job_name   = "integrations/discourse"
}
To monitor your Discourse instance, you must use a discovery.relabel component to discover your Discourse Prometheus endpoint and apply appropriate labels, followed by a prometheus.scrape component to scrape it.
Configure the following properties within each discovery.relabel component:
__address__: The address to your Discourse Prometheus metrics endpoint.instancelabel:constants.hostnamesets theinstancelabel to your Grafana Alloy server hostname. If that is not suitable, change it to a value uniquely identifies this Discourse instance.
If you have multiple Discourse servers to scrape, configure one discovery.relabel for each and scrape them by including each under targets within the prometheus.scrape component.
Grafana Agent static configuration (deprecated)
The following section shows configuration for running Grafana Agent in static mode which is deprecated. You should use Grafana Alloy for all new deployments.
Before you begin
This integration monitors a Discourse instance that is exposing Prometheus metrics via the official exporter plugin. Refer to the following official Discourse documentation for instructions on how to install plugins in Discourse.
In order for the plugin to work, add the plugin’s repository URL to the app.yml file, which is usually present in /var/discourse/containers.
hooks:
  after_code:
    - exec:
        cd: $home/plugins
        cmd:
          - sudo -E -u discourse git clone https://github.com/discourse/discourse-prometheus.git
Then rebuild the container:
cd /var/discourse
./launcher rebuild app
For more information on how to first install Discourse, please refer to their installation documentation.
The configuration of DISCOURSE_PROMETHEUS_TRUSTED_IP_ALLOWLIST_REGEX may also need to be configured for the Grafana Agent to be trusted to scrape the metrics.
Install Discourse integration for Grafana Cloud
- In your Grafana Cloud stack, click Connections in the left-hand menu.
- Find Discourse and click its tile to open the integration.
- Review the prerequisites in the Configuration Details tab and set up Grafana Agent to send Discourse metrics to your Grafana Cloud instance.
- Click Install to add this integration’s pre-built dashboards and alerts to your Grafana Cloud instance, and you can start monitoring your Discourse setup.
Post-install configuration for the Discourse integration
After enabling the Prometheus plugin, you should configure Grafana Agent to scrape your Discourse nodes.
Discourse exposes a /metrics endpoint. To scrape it, add the provided snippet to your agent configuration file.
Make sure to change targets in the snippet according to your environment.
Configuration snippets for Grafana Agent
Below metrics.configs.scrape_configs, insert the following lines and change the URLs according to your environment:
    - job_name: integrations/discourse
      metrics_path: "/metrics"
      relabel_configs:
        - replacement: '<your-instance-name>'
          target_label: instance
      static_configs:
        - targets:
          - localhost:80
Full example configuration for Grafana Agent
Refer to the following Grafana Agent configuration for a complete example that contains all the snippets used for the Discourse integration. This example also includes metrics that are sent to monitor your Grafana Agent instance.
integrations:
  prometheus_remote_write:
  - basic_auth:
      password: <your_prom_pass>
      username: <your_prom_user>
    url: <your_prom_url>
  agent:
    enabled: true
    relabel_configs:
    - action: replace
      source_labels:
      - agent_hostname
      target_label: instance
    - action: replace
      target_label: job
      replacement: "integrations/agent-check"
    metric_relabel_configs:
    - action: keep
      regex: (prometheus_target_sync_length_seconds_sum|prometheus_target_scrapes_.*|prometheus_target_interval.*|prometheus_sd_discovered_targets|agent_build.*|agent_wal_samples_appended_total|process_start_time_seconds)
      source_labels:
      - __name__
  # Add here any snippet that belongs to the `integrations` section.
  # For a correct indentation, paste snippets copied from Grafana Cloud at the beginning of the line.
logs:
  configs:
  - clients:
    - basic_auth:
        password: <your_loki_pass>
        username: <your_loki_user>
      url: <your_loki_url>
    name: integrations
    positions:
      filename: /tmp/positions.yaml
    scrape_configs:
      # Add here any snippet that belongs to the `logs.configs.scrape_configs` section.
      # For a correct indentation, paste snippets copied from Grafana Cloud at the beginning of the line.
metrics:
  configs:
  - name: integrations
    remote_write:
    - basic_auth:
        password: <your_prom_pass>
        username: <your_prom_user>
      url: <your_prom_url>
    scrape_configs:
      # Add here any snippet that belongs to the `metrics.configs.scrape_configs` section.
      # For a correct indentation, paste snippets copied from Grafana Cloud at the beginning of the line.
    - job_name: integrations/discourse
      metrics_path: "/metrics"
      relabel_configs:
        - replacement: '<your-instance-name>'
          target_label: instance
      static_configs:
        - targets:
          - localhost:80
  global:
    scrape_interval: 60s
  wal_directory: /tmp/grafana-agent-wal
Dashboards
The Discourse integration installs the following dashboards in your Grafana Cloud instance to help monitor your system.
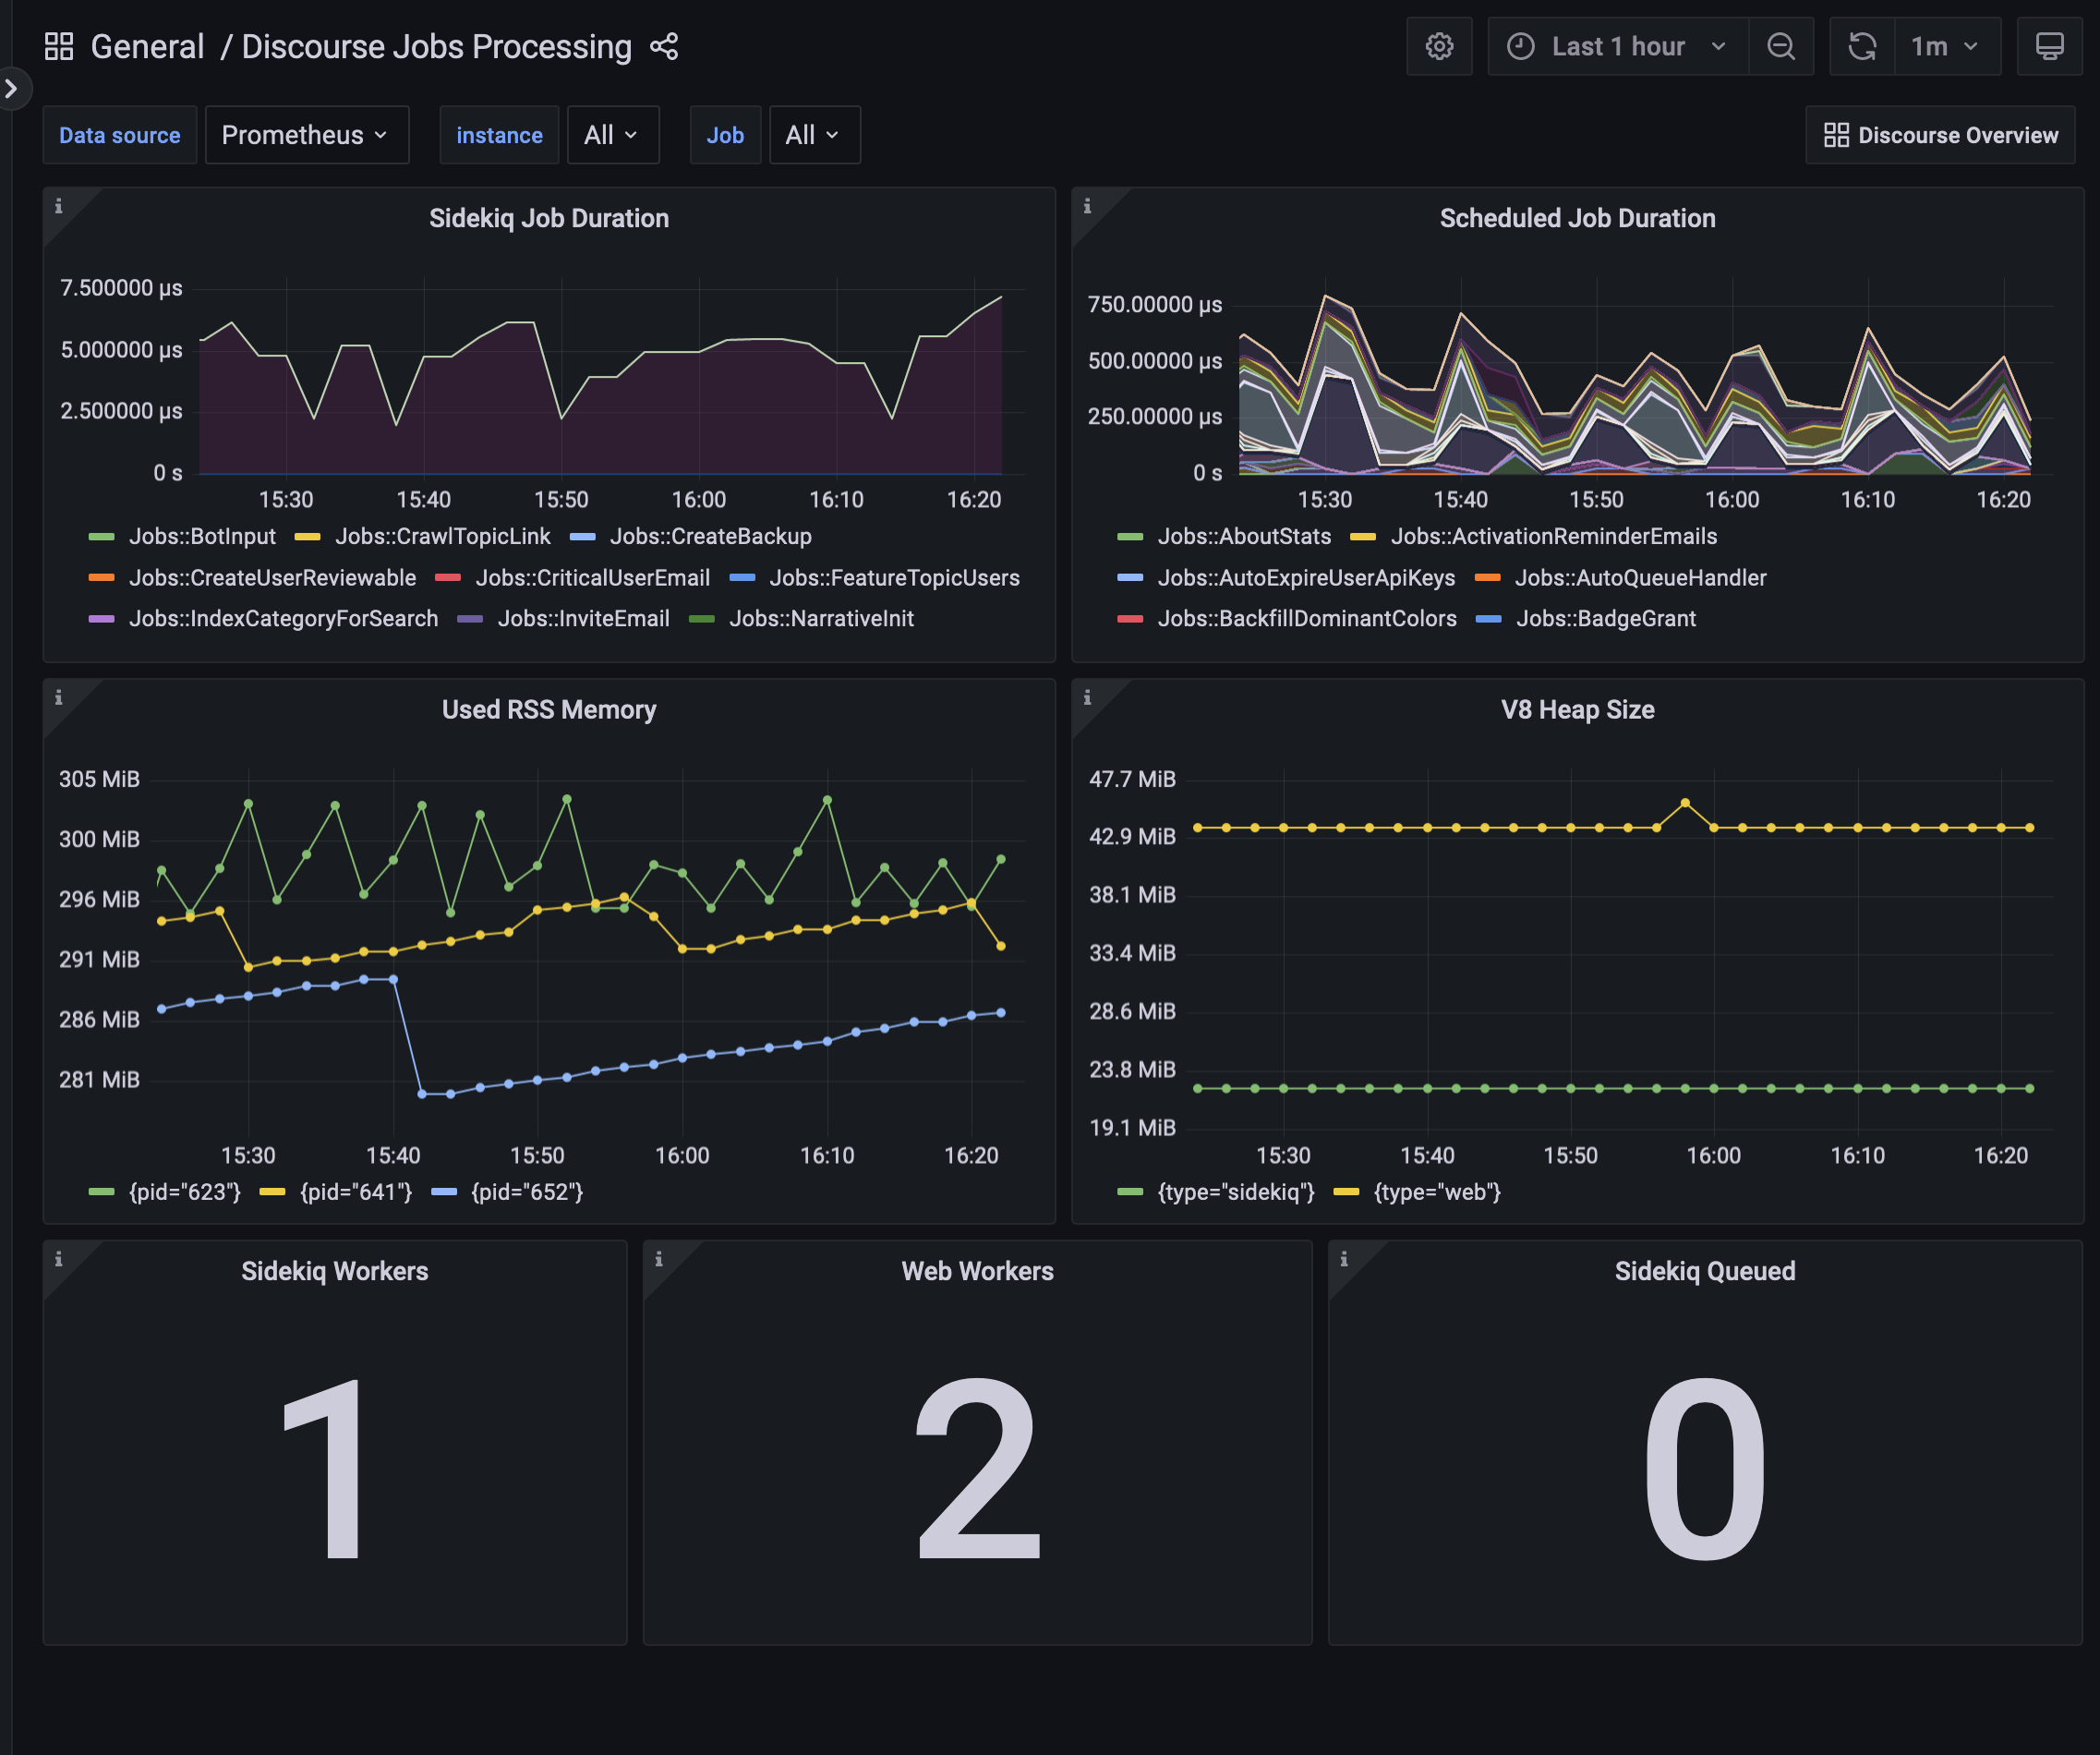
- Discourse Jobs Processing
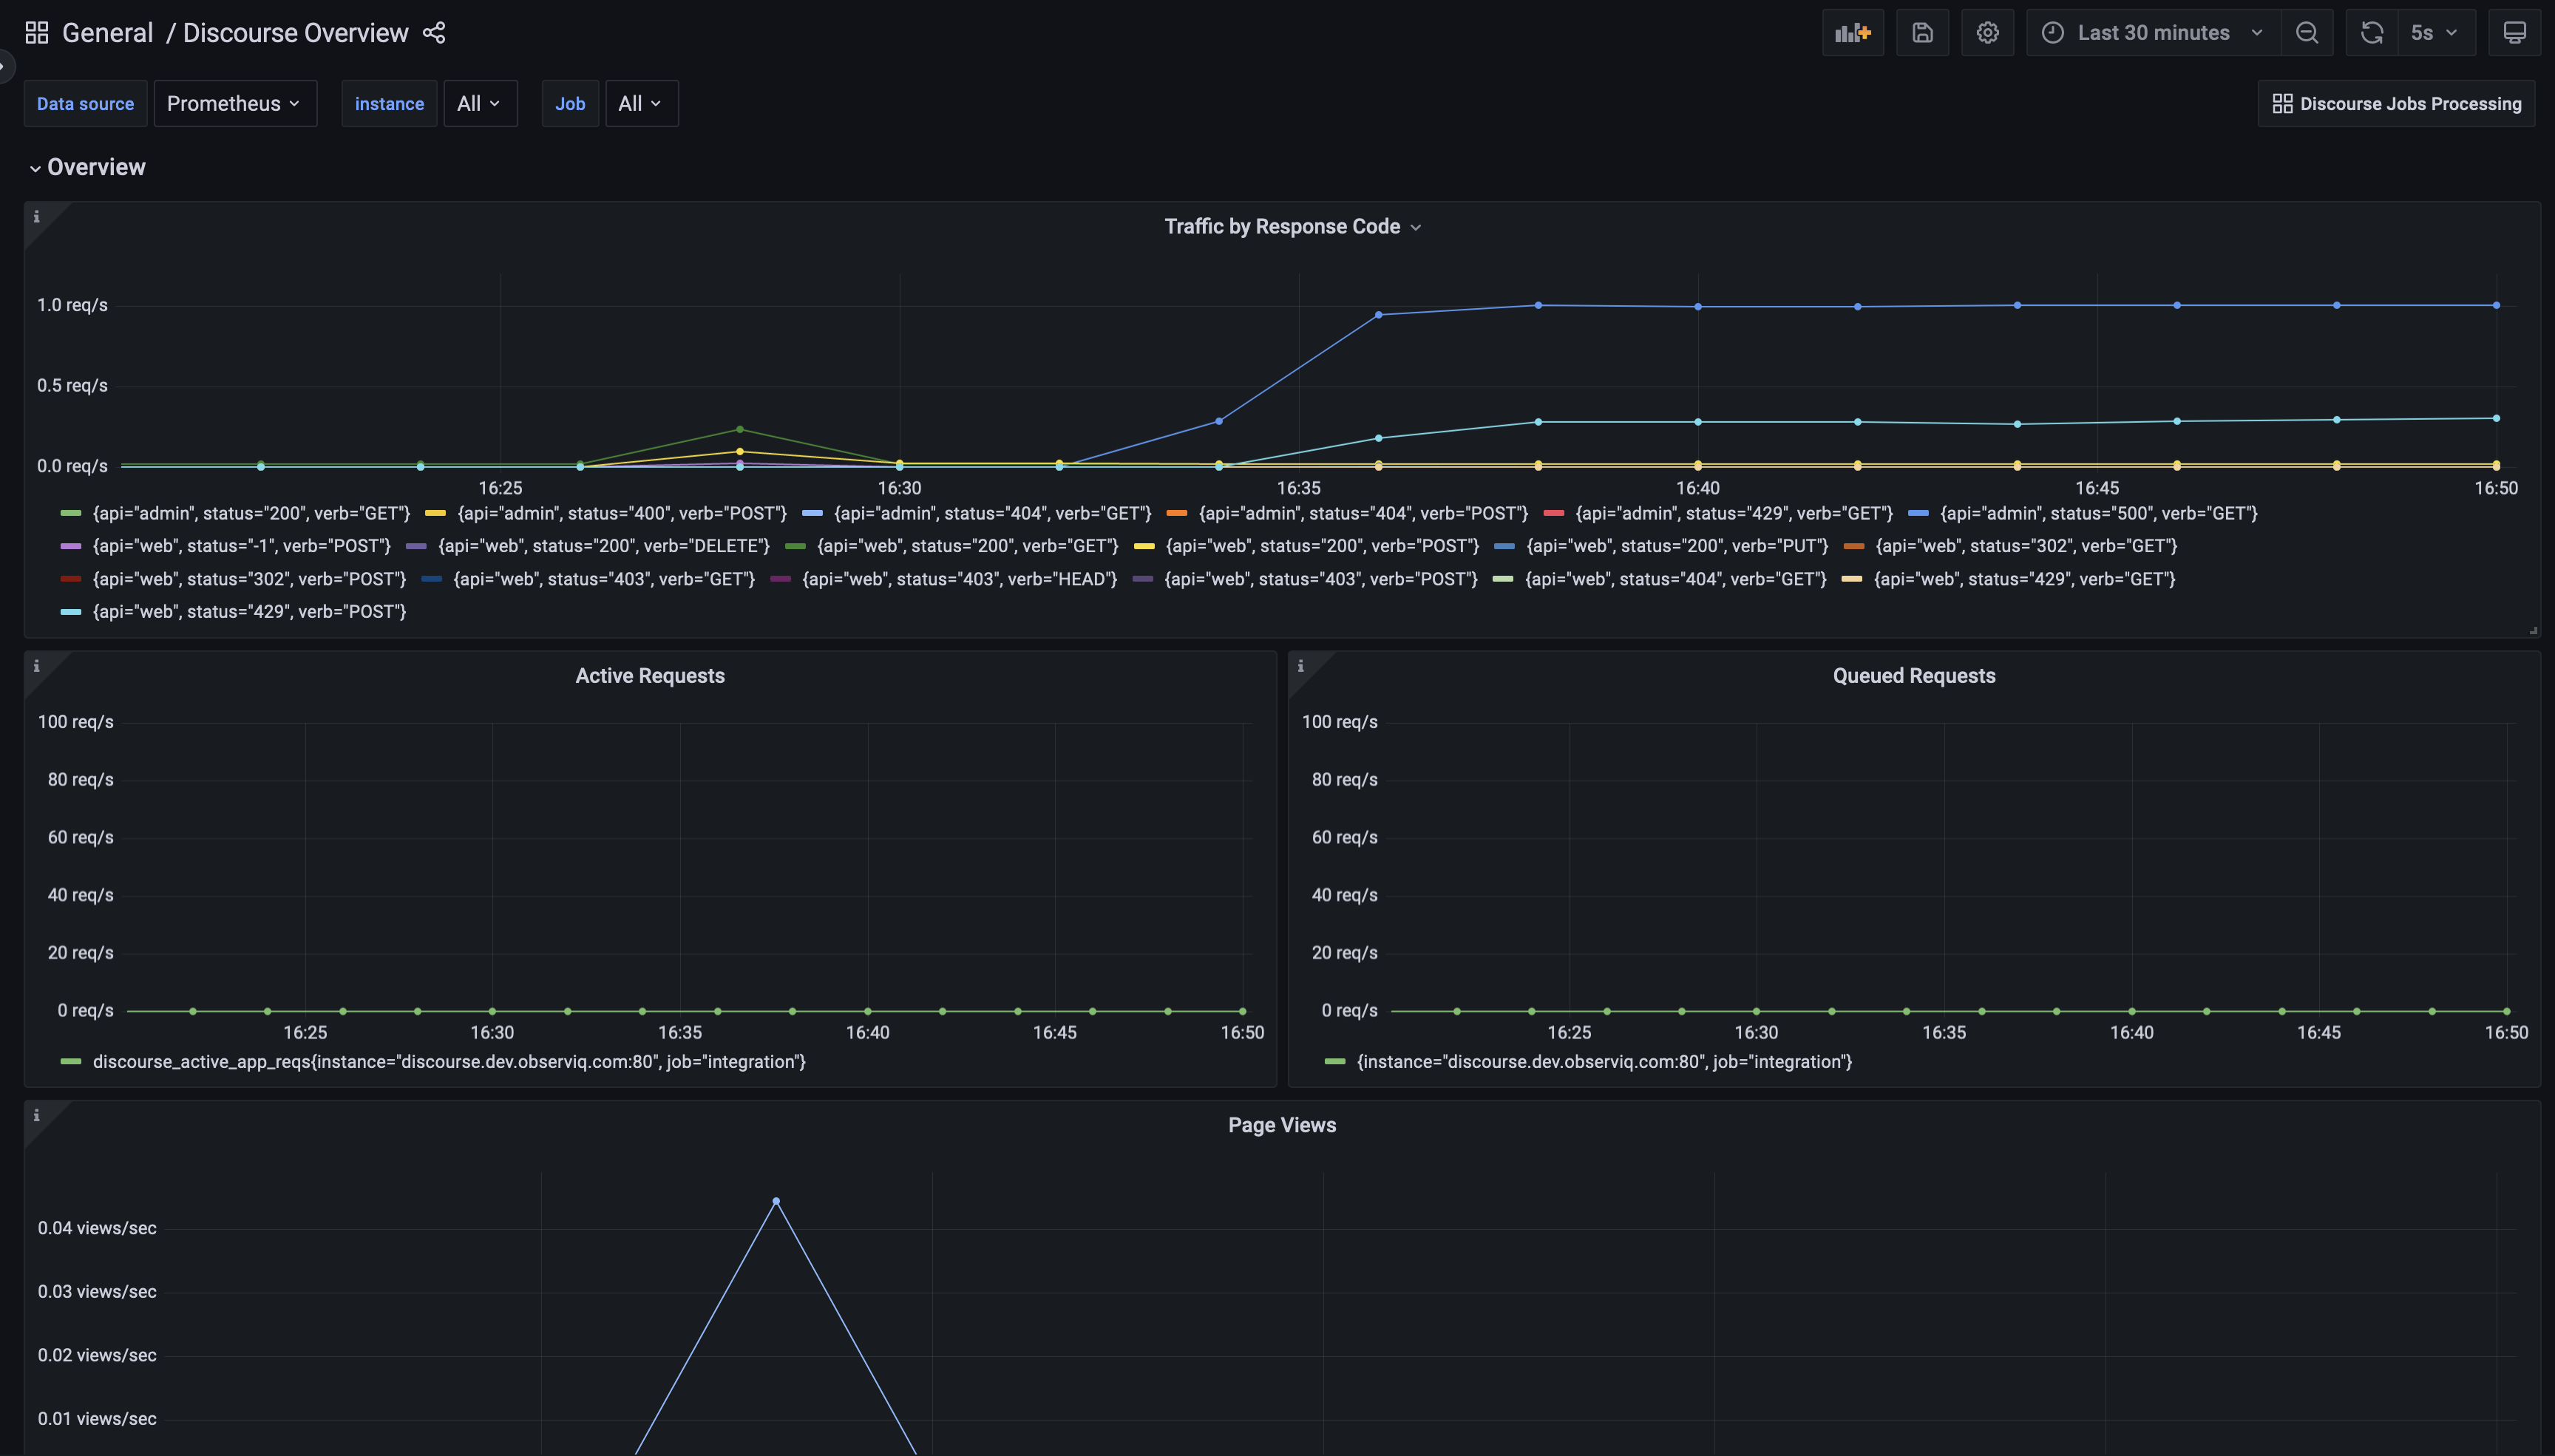
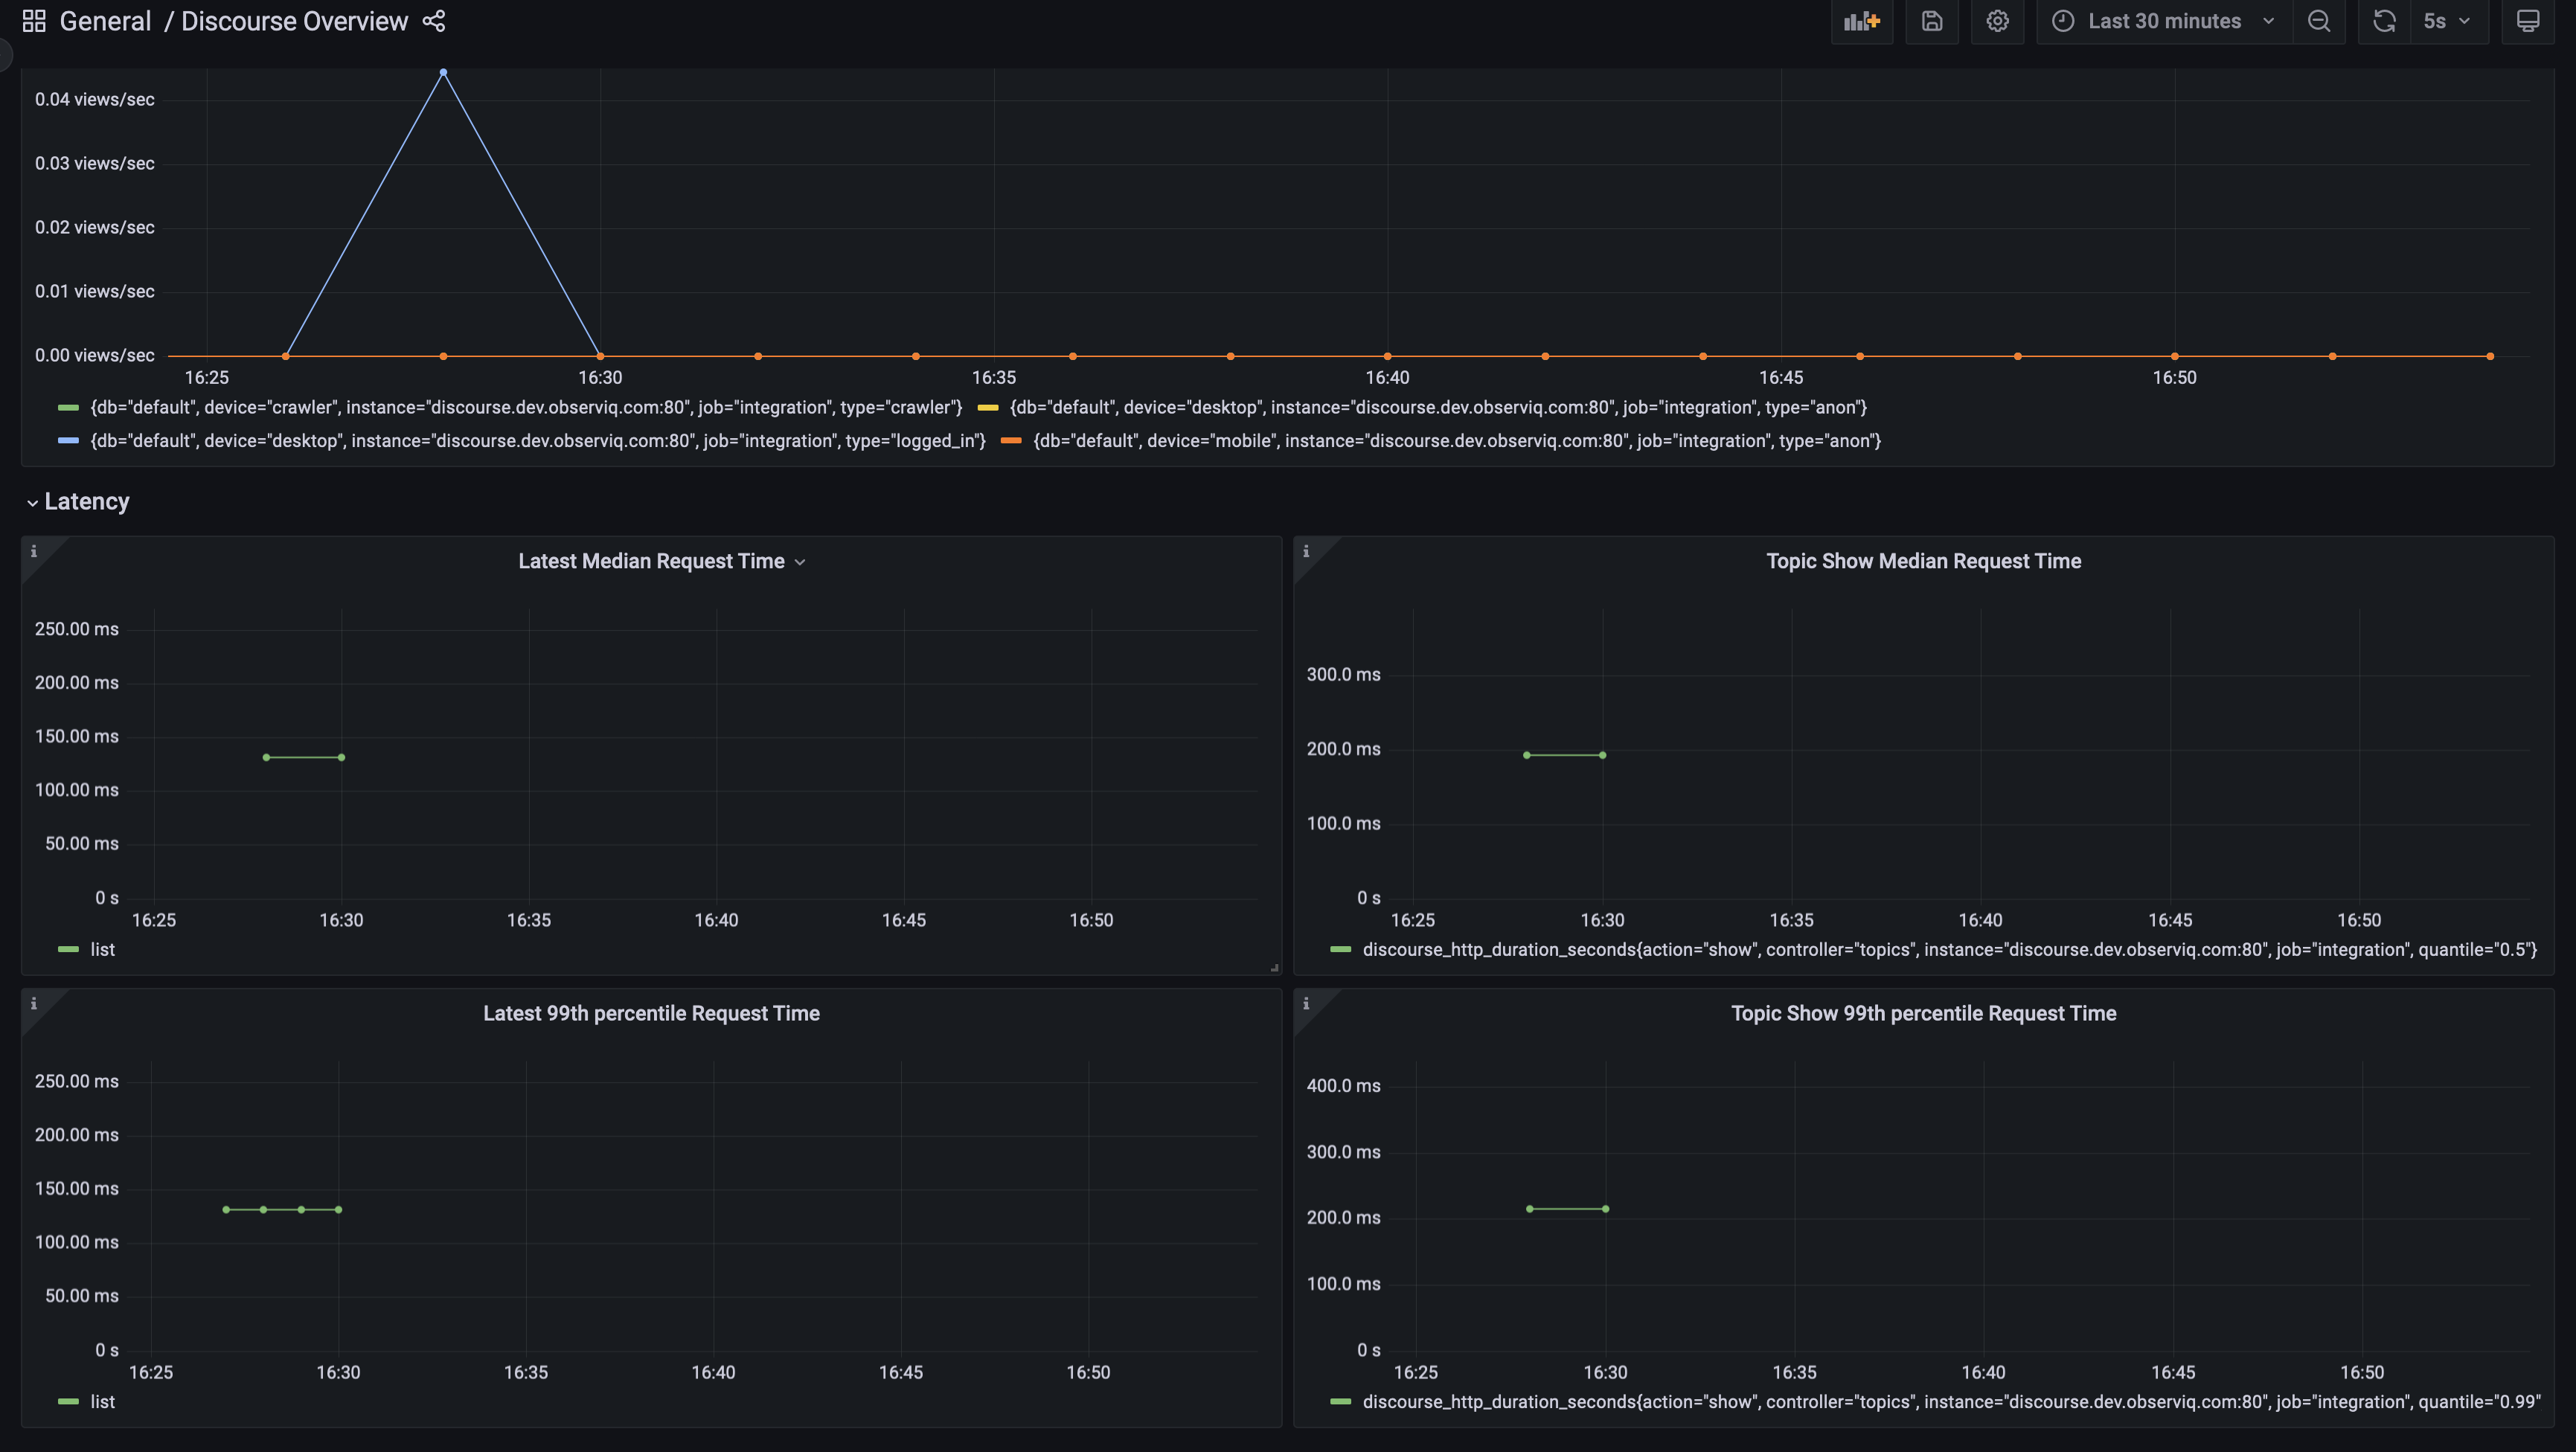
- Discourse Overview
Discourse Jobs Dashboard
Discourse Overview Dashboard 1
Discourse Overview Dashboard 2
Alerts
The Discourse integration includes the following useful alerts:
| Alert | Description |
|---|---|
| DiscourseRequestsHigh5xxErrors | Critical: More than 10% of all requests result in a 5XX. |
| DiscourseRequestsHigh4xxErrors | Warning: More than 30% of all requests result in a 4XX. |
Metrics
The most important metrics provided by the Discourse integration, which are used on the pre-built dashboards and Prometheus alerts, are as follows:
- discourse_active_app_reqs
- discourse_http_duration_seconds
- discourse_http_requests
- discourse_page_views
- discourse_queued_app_reqs
- discourse_rss
- discourse_scheduled_job_count
- discourse_scheduled_job_duration_seconds
- discourse_sidekiq_job_count
- discourse_sidekiq_job_duration_seconds
- discourse_sidekiq_jobs_enqueued
- discourse_v8_used_heap_size
- up
Changelog
# 0.0.2 - September 2023

* New Filter Metrics option for configuring the Grafana Agent, which saves on metrics cost by dropping any metric not used by this integration. Beware that anything custom built using metrics that are not on the snippet will stop working.
* New hostname relabel option, which applies the instance name you write on the text box to the Grafana Agent configuration snippets, making it easier and less error prone to configure this mandatory label.

# 0.0.1 - December 2022

Initial Release
Cost
By connecting your Discourse instance to Grafana Cloud, you might incur charges. To view information on the number of active series that your Grafana Cloud account uses for metrics included in each Cloud tier, see Active series and dpm usage and Cloud tier pricing.
Was this page helpful?
Related resources from Grafana Labs


