
Couchbase integration for Grafana Cloud
Couchbase is a distributed NoSQL database which provides high availability, scalability, and performance for large sets of data. This integration for Grafana Cloud allows users to collect metrics and logs from the cluster, node, and bucket levels of a Couchbase clustered deployment.
This integration supports Couchbase 7.0+
This integration includes 4 useful alerts and 3 pre-built dashboards to help monitor and visualize Couchbase metrics and logs.
Before you begin
Couchbase exposes a Prometheus metrics endpoint that is enabled by default.
In order to access this endpoint, configure basic authentication with the credentials of a user with an admin role. For more information on roles in Couchbase, see these docs
Install Couchbase integration for Grafana Cloud
- In your Grafana Cloud stack, click Connections in the left-hand menu.
- Find Couchbase and click its tile to open the integration.
- Review the prerequisites in the Configuration Details tab and set up Grafana Agent to send Couchbase metrics and logs to your Grafana Cloud instance.
- Click Install to add this integration’s pre-built dashboards and alerts to your Grafana Cloud instance, and you can start monitoring your Couchbase setup.
Configuration snippets for Grafana Alloy
Advanced mode
The following snippets provide examples to guide you through the configuration process.
To instruct Grafana Alloy to scrape your Couchbase instances, manually copy and append the snippets to your alloy configuration file, then follow subsequent instructions.
Advanced metrics snippets
discovery.relabel "metrics_integrations_integrations_couchbase" {
	targets = [{
		__address__ = "<node-hostname>:8091",
	}]

	rule {
		target_label = "instance"
		replacement  = constants.hostname
	}

	rule {
		target_label = "couchbase_cluster"
		replacement  = "<your-cluster-name>"
	}
}

prometheus.scrape "metrics_integrations_integrations_couchbase" {
	targets    = discovery.relabel.metrics_integrations_integrations_couchbase.output
	forward_to = [prometheus.remote_write.metrics_service.receiver]
	job_name   = "integrations/couchbase"

	basic_auth {
		username = "<cb-cluster-username>"
		password = "<cb-cluster-password>"
	}
}
To monitor your Couchbase instance, you must use a discovery.relabel component to discover your Couchbase Prometheus endpoint and apply appropriate labels, followed by a prometheus.scrape component to scrape it.
Configure the following properties within each discovery.relabel component:
__address__: The address to your Couchbase Prometheus metrics endpoint.instancelabel:constants.hostnamesets theinstancelabel to your Grafana Alloy server hostname. If that is not suitable, change it to a value uniquely identifies this Couchbase instance. Make sure this label value is the same for all telemetry data collected for this instance.couchbase_cluster: Thecouchbase_clusterlabel to group your Couchbase instances within a cluster. Set the same value for all nodes within your cluster.
If you have multiple Couchbase servers to scrape, configure one discovery.relabel for each and scrape them by including each under targets within the prometheus.scrape component.
Advanced logs snippets
darwin
local.file_match "logs_integrations_integrations_couchbase" {
	path_targets = [{
		__address__       = "localhost",
		__path__          = "/opt/couchbase/var/lib/couchbase/*.log",
		couchbase_cluster = "<your-cluster-name>",
		instance          = constants.hostname,
		job               = "integrations/couchbase",
	}]
}

loki.process "logs_integrations_integrations_couchbase" {
	forward_to = [loki.write.grafana_cloud_loki.receiver]

	stage.drop {
		expression = "---"
	}

	stage.multiline {
		firstline     = "\\[(ns_server|couchdb):(error|info),.*\\]"
		max_lines     = 0
		max_wait_time = "3s"
	}
}

loki.source.file "logs_integrations_integrations_couchbase" {
	targets    = local.file_match.logs_integrations_integrations_couchbase.targets
	forward_to = [loki.process.logs_integrations_integrations_couchbase.receiver]
}
To monitor your Couchbase instance logs, you will use a combination of the following components:
local.file_match defines where to find the log file to be scraped. Change the following properties according to your environment:
__address__: The Couchbase instance address__path__: The path to the log file.instancelabel:constants.hostnamesets theinstancelabel to your Grafana Alloy server hostname. If that is not suitable, change it to a value uniquely identifies this Couchbase instance. Make sure this label value is the same for all telemetry data collected for this instance.couchbase_cluster: Thecouchbase_clusterlabel to group your Couchbase instances within a cluster. Set the same value for all nodes within your cluster.
loki.process defines how to process logs before sending it to Loki.
loki.source.file sends logs to Loki.
linux
local.file_match "logs_integrations_integrations_couchbase" {
	path_targets = [{
		__address__       = "localhost",
		__path__          = "/opt/couchbase/var/lib/couchbase/*.log",
		couchbase_cluster = "<your-cluster-name>",
		instance          = constants.hostname,
		job               = "integrations/couchbase",
	}]
}

loki.process "logs_integrations_integrations_couchbase" {
	forward_to = [loki.write.grafana_cloud_loki.receiver]

	stage.drop {
		expression = "---"
	}

	stage.multiline {
		firstline     = "\\[(ns_server|couchdb):(error|info),.*\\]"
		max_lines     = 0
		max_wait_time = "3s"
	}
}

loki.source.file "logs_integrations_integrations_couchbase" {
	targets    = local.file_match.logs_integrations_integrations_couchbase.targets
	forward_to = [loki.process.logs_integrations_integrations_couchbase.receiver]
}
To monitor your Couchbase instance logs, you will use a combination of the following components:
local.file_match defines where to find the log file to be scraped. Change the following properties according to your environment:
__address__: The Couchbase instance address__path__: The path to the log file.instancelabel:constants.hostnamesets theinstancelabel to your Grafana Alloy server hostname. If that is not suitable, change it to a value uniquely identifies this Couchbase instance. Make sure this label value is the same for all telemetry data collected for this instance.couchbase_cluster: Thecouchbase_clusterlabel to group your Couchbase instances within a cluster. Set the same value for all nodes within your cluster.
loki.process defines how to process logs before sending it to Loki.
loki.source.file sends logs to Loki.
windows
local.file_match "logs_integrations_integrations_couchbase" {
	path_targets = [{
		__address__       = "localhost",
		__path__          = "/opt/couchbase/var/lib/couchbase/*.log",
		couchbase_cluster = "<your-cluster-name>",
		instance          = constants.hostname,
		job               = "integrations/couchbase",
	}]
}

loki.process "logs_integrations_integrations_couchbase" {
	forward_to = [loki.write.grafana_cloud_loki.receiver]

	stage.drop {
		expression = "---"
	}

	stage.multiline {
		firstline     = "\\[(ns_server|couchdb):(error|info),.*\\]"
		max_lines     = 0
		max_wait_time = "3s"
	}
}

loki.source.file "logs_integrations_integrations_couchbase" {
	targets    = local.file_match.logs_integrations_integrations_couchbase.targets
	forward_to = [loki.process.logs_integrations_integrations_couchbase.receiver]
}
To monitor your Couchbase instance logs, you will use a combination of the following components:
local.file_match defines where to find the log file to be scraped. Change the following properties according to your environment:
__address__: The Couchbase instance address__path__: The path to the log file.instancelabel:constants.hostnamesets theinstancelabel to your Grafana Alloy server hostname. If that is not suitable, change it to a value uniquely identifies this Couchbase instance. Make sure this label value is the same for all telemetry data collected for this instance.couchbase_cluster: Thecouchbase_clusterlabel to group your Couchbase instances within a cluster. Set the same value for all nodes within your cluster.
loki.process defines how to process logs before sending it to Loki.
loki.source.file sends logs to Loki.
Grafana Agent static configuration (deprecated)
The following section shows configuration for running Grafana Agent in static mode which is deprecated. You should use Grafana Alloy for all new deployments.
Before you begin
Couchbase exposes a Prometheus metrics endpoint that is enabled by default.
In order to access this endpoint, configure basic authentication with the credentials of a user with an admin role. For more information on roles in Couchbase, see these docs
Install Couchbase integration for Grafana Cloud
- In your Grafana Cloud stack, click Connections in the left-hand menu.
- Find Couchbase and click its tile to open the integration.
- Review the prerequisites in the Configuration Details tab and set up Grafana Agent to send Couchbase metrics and logs to your Grafana Cloud instance.
- Click Install to add this integration’s pre-built dashboards and alerts to your Grafana Cloud instance, and you can start monitoring your Couchbase setup.
Post-install configuration for the Couchbase integration
You should instruct Grafana Agent to scrape your Couchbase nodes.
Couchbase exposes a /metrics endpoint. To scrape it, add the provided config snippet to your agent configuration file.
Make sure to change targets in the snippet according to your environment.
If you want to show logs and metrics signals correlated in your dashboards, as a single pane of glass, ensure the following:
job,instance, andcouchbase_clusterlabel values must match for metrics and logs scrape config in your agent configuration file.joblabel must be set tointegrations/couchbase(already configured in the snippets).instancelabel must be set to a value that uniquely identifies your Couchbase node. Please replace the default hostname value according to your environment - it must be set manually.couchbase_clusterlabel must be set to a value that identifies your Couchbase cluster.
Configuration snippets for Grafana Agent
Below metrics.configs.scrape_configs, insert the following lines and change the URLs according to your environment:
    - job_name: integrations/couchbase
      basic_auth:
        username: '<cb-cluster-username>'
        password: '<cb-cluster-password>'
      metrics_path: "/metrics"
      relabel_configs:
        - replacement: '<your-instance-name>'
          target_label: instance
        - replacement: '<your-cluster-name>'
          target_label: couchbase_cluster
      static_configs:
        - targets: [<node-hostname>:8091]
Below logs.configs.scrape_configs, insert the following lines according to your environment.
    - job_name: integrations/couchbase
      static_configs:
        - targets: [localhost]
          labels:
            job: integrations/couchbase
            instance: '<your-instance-name>'
            couchbase_cluster: '<your-cluster-name>'
            __path__: /opt/couchbase/var/lib/couchbase/*.log
      pipeline_stages:
        - drop:
            expression: '---'
        - multiline:
            firstline: '(\\[(ns_server|couchdb):(error|info),.*\\]|\\[\\d\\] couchbase.log.*)'
Full example configuration for Grafana Agent
Refer to the following Grafana Agent configuration for a complete example that contains all the snippets used for the Couchbase integration. This example also includes metrics that are sent to monitor your Grafana Agent instance.
integrations:
  prometheus_remote_write:
  - basic_auth:
      password: <your_prom_pass>
      username: <your_prom_user>
    url: <your_prom_url>
  agent:
    enabled: true
    relabel_configs:
    - action: replace
      source_labels:
      - agent_hostname
      target_label: instance
    - action: replace
      target_label: job
      replacement: "integrations/agent-check"
    metric_relabel_configs:
    - action: keep
      regex: (prometheus_target_sync_length_seconds_sum|prometheus_target_scrapes_.*|prometheus_target_interval.*|prometheus_sd_discovered_targets|agent_build.*|agent_wal_samples_appended_total|process_start_time_seconds)
      source_labels:
      - __name__
  # Add here any snippet that belongs to the `integrations` section.
  # For a correct indentation, paste snippets copied from Grafana Cloud at the beginning of the line.
logs:
  configs:
  - clients:
    - basic_auth:
        password: <your_loki_pass>
        username: <your_loki_user>
      url: <your_loki_url>
    name: integrations
    positions:
      filename: /tmp/positions.yaml
    scrape_configs:
      # Add here any snippet that belongs to the `logs.configs.scrape_configs` section.
      # For a correct indentation, paste snippets copied from Grafana Cloud at the beginning of the line.
    - job_name: integrations/couchbase
      static_configs:
        - targets: [localhost]
          labels:
            job: integrations/couchbase
            instance: '<your-instance-name>'
            couchbase_cluster: '<your-cluster-name>'
            __path__: /opt/couchbase/var/lib/couchbase/*.log
      pipeline_stages:
        - drop:
            expression: '---'
        - multiline:
            firstline: '(\\[(ns_server|couchdb):(error|info),.*\\]|\\[\\d\\] couchbase.log.*)'
metrics:
  configs:
  - name: integrations
    remote_write:
    - basic_auth:
        password: <your_prom_pass>
        username: <your_prom_user>
      url: <your_prom_url>
    scrape_configs:
      # Add here any snippet that belongs to the `metrics.configs.scrape_configs` section.
      # For a correct indentation, paste snippets copied from Grafana Cloud at the beginning of the line.
    - job_name: integrations/couchbase
      basic_auth:
        username: '<cb-cluster-username>'
        password: '<cb-cluster-password>'
      metrics_path: "/metrics"
      relabel_configs:
        - replacement: '<your-instance-name>'
          target_label: instance
        - replacement: '<your-cluster-name>'
          target_label: couchbase_cluster
      static_configs:
        - targets: [<node-hostname>:8091]
  global:
    scrape_interval: 60s
  wal_directory: /tmp/grafana-agent-wal
Dashboards
The Couchbase integration installs the following dashboards in your Grafana Cloud instance to help monitor your system.
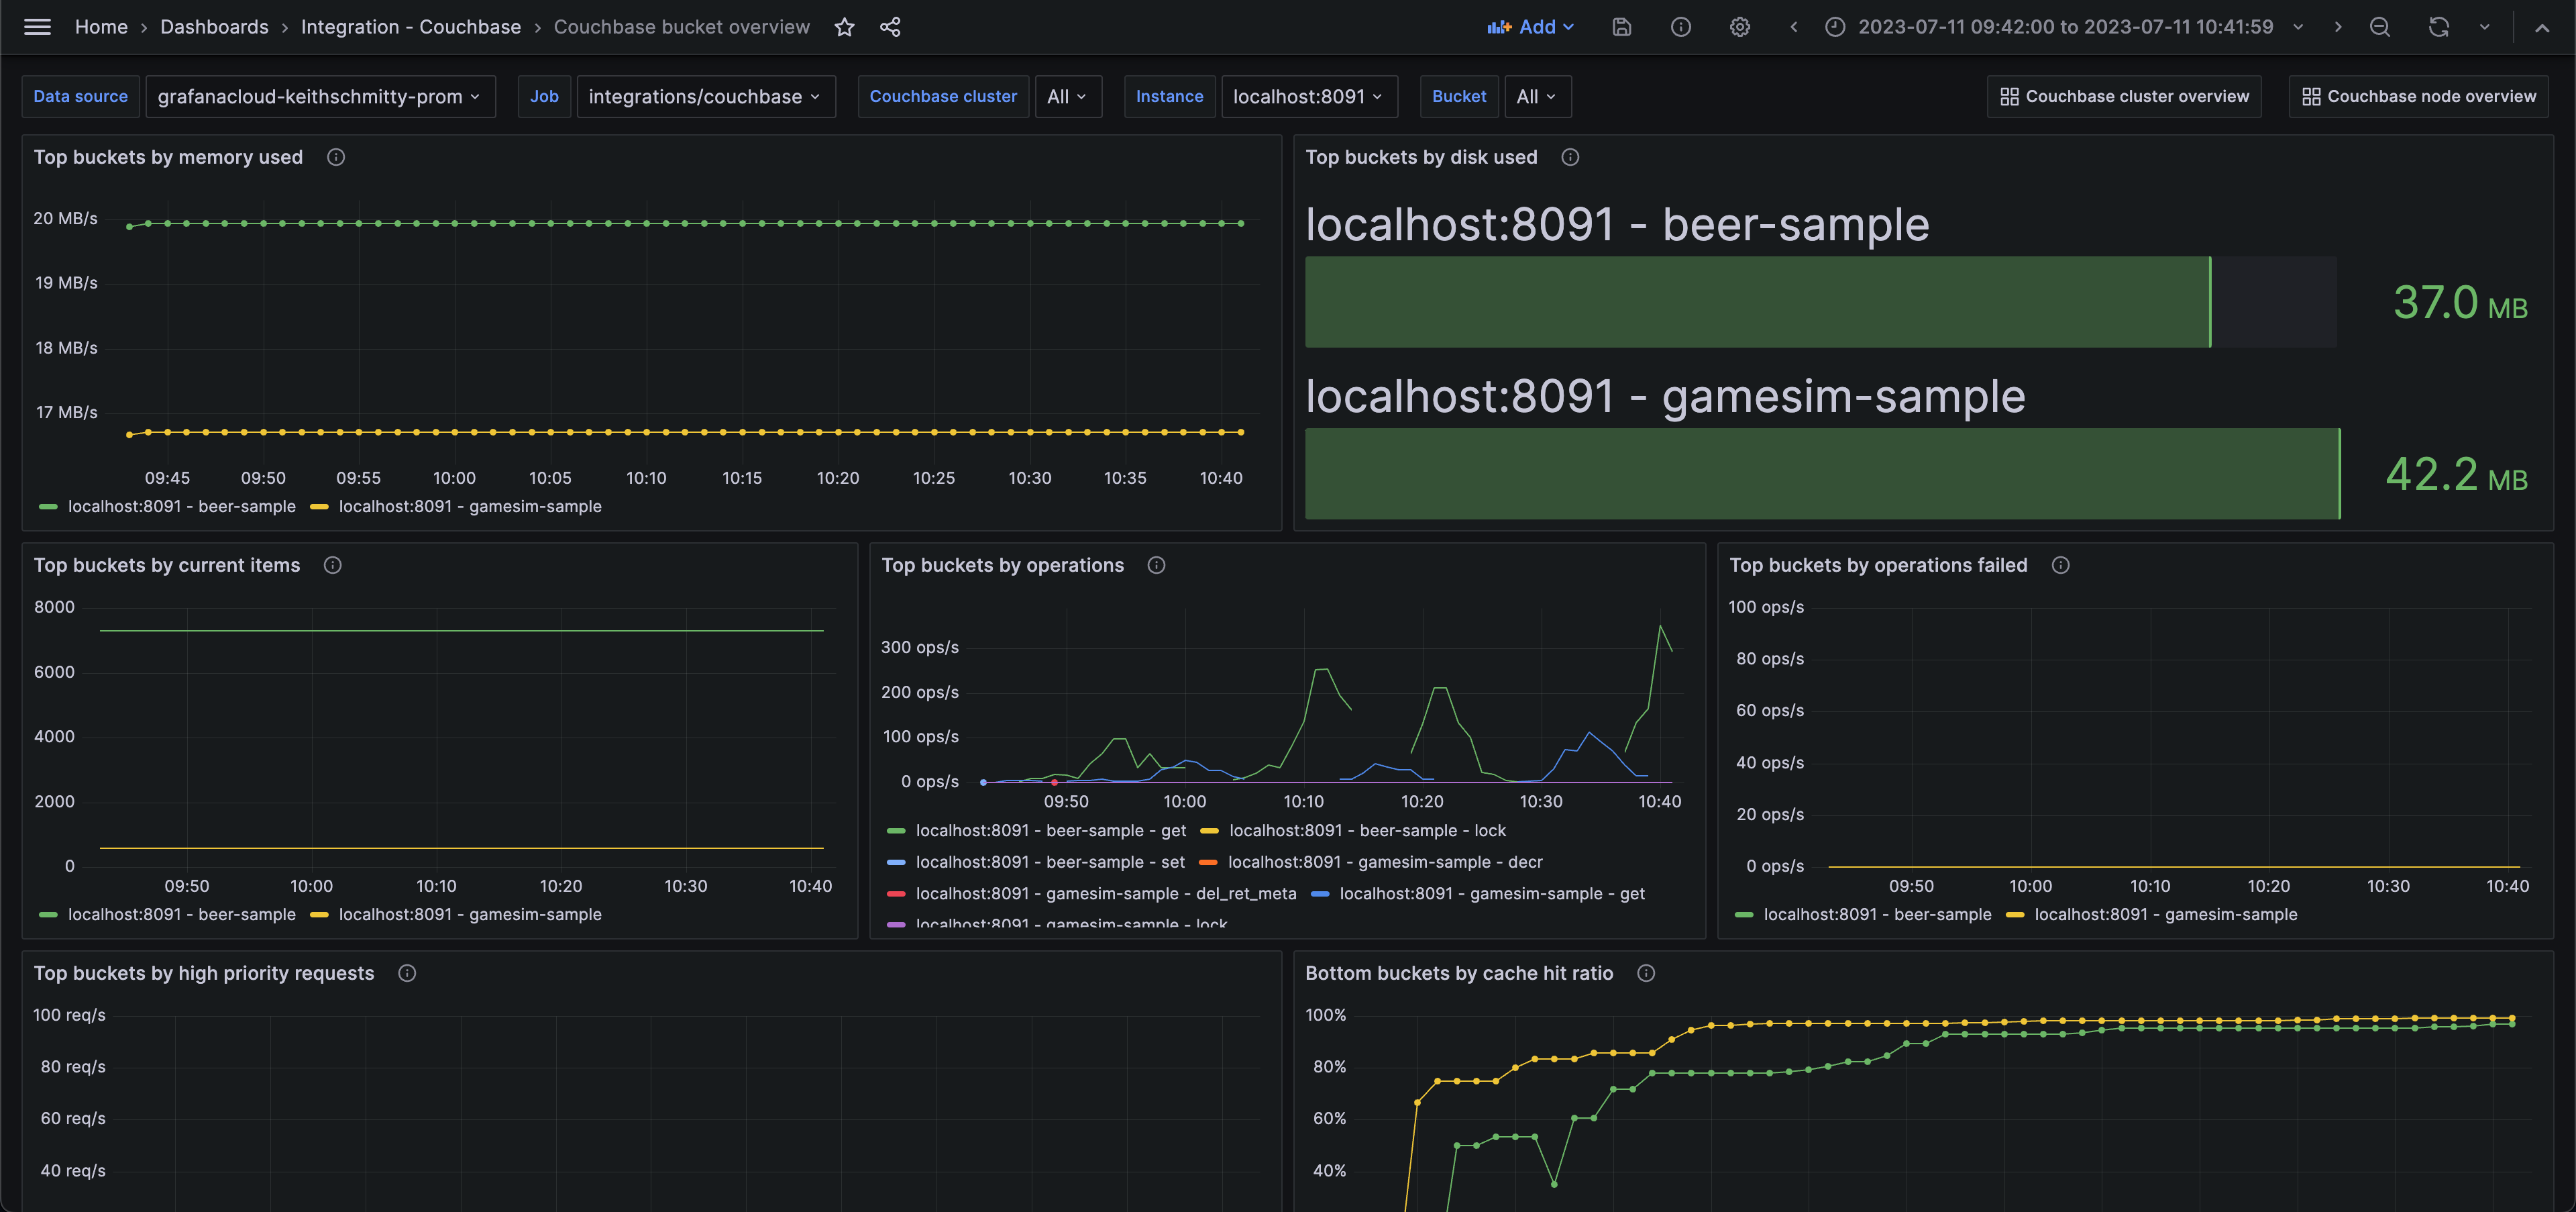
- Couchbase bucket overview
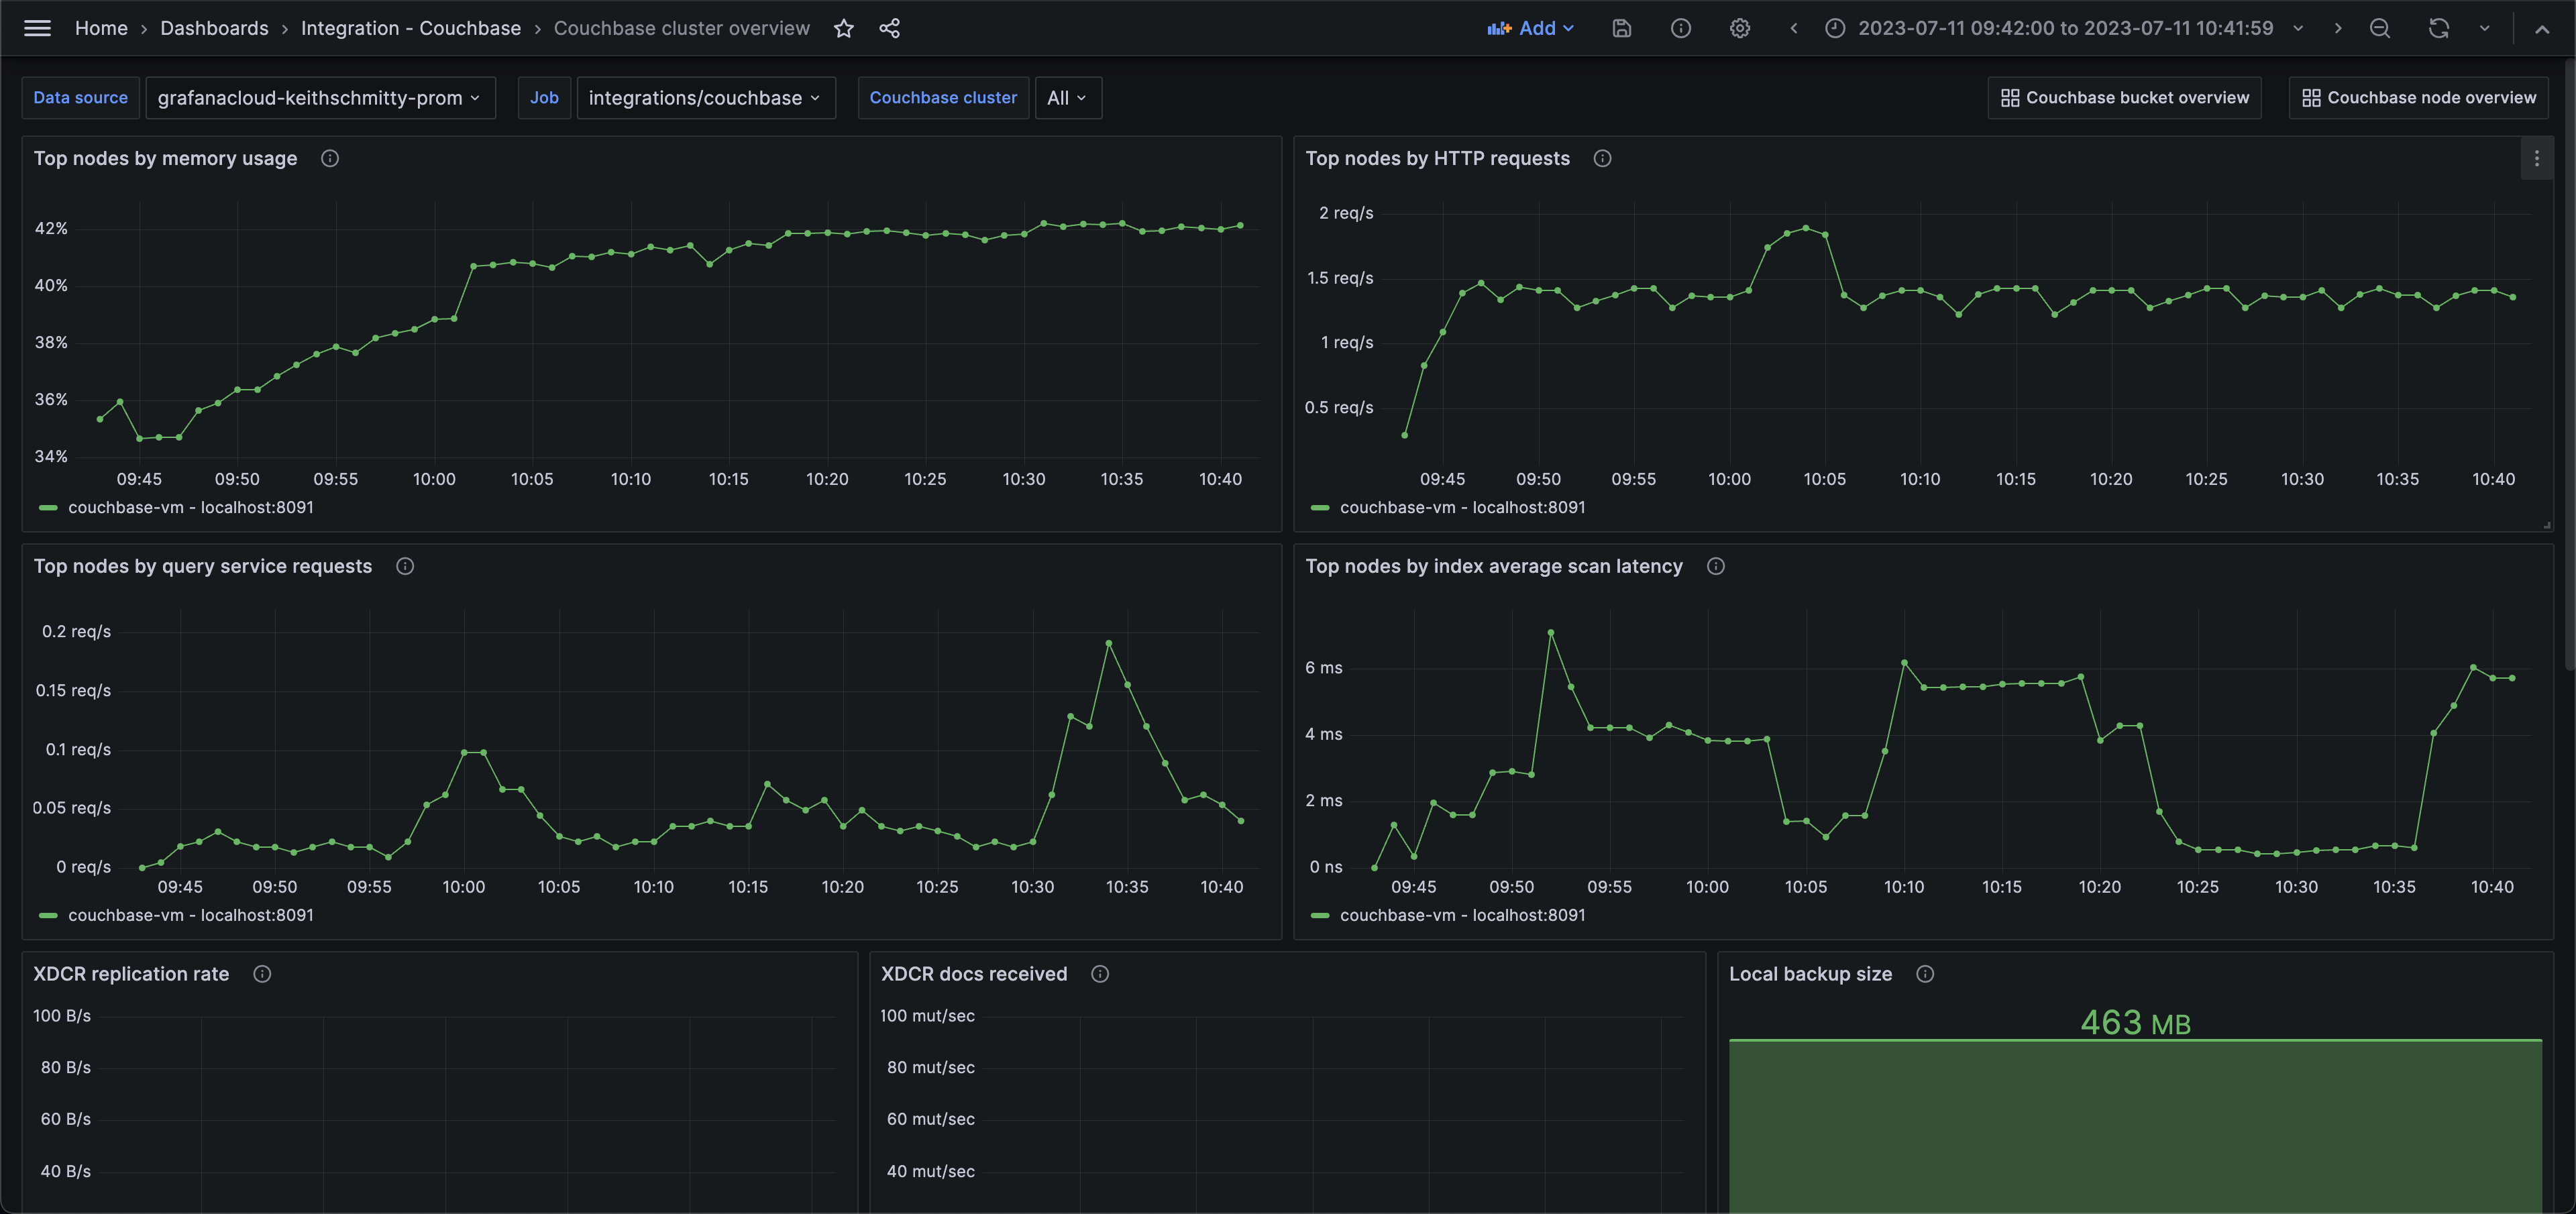
- Couchbase cluster overview
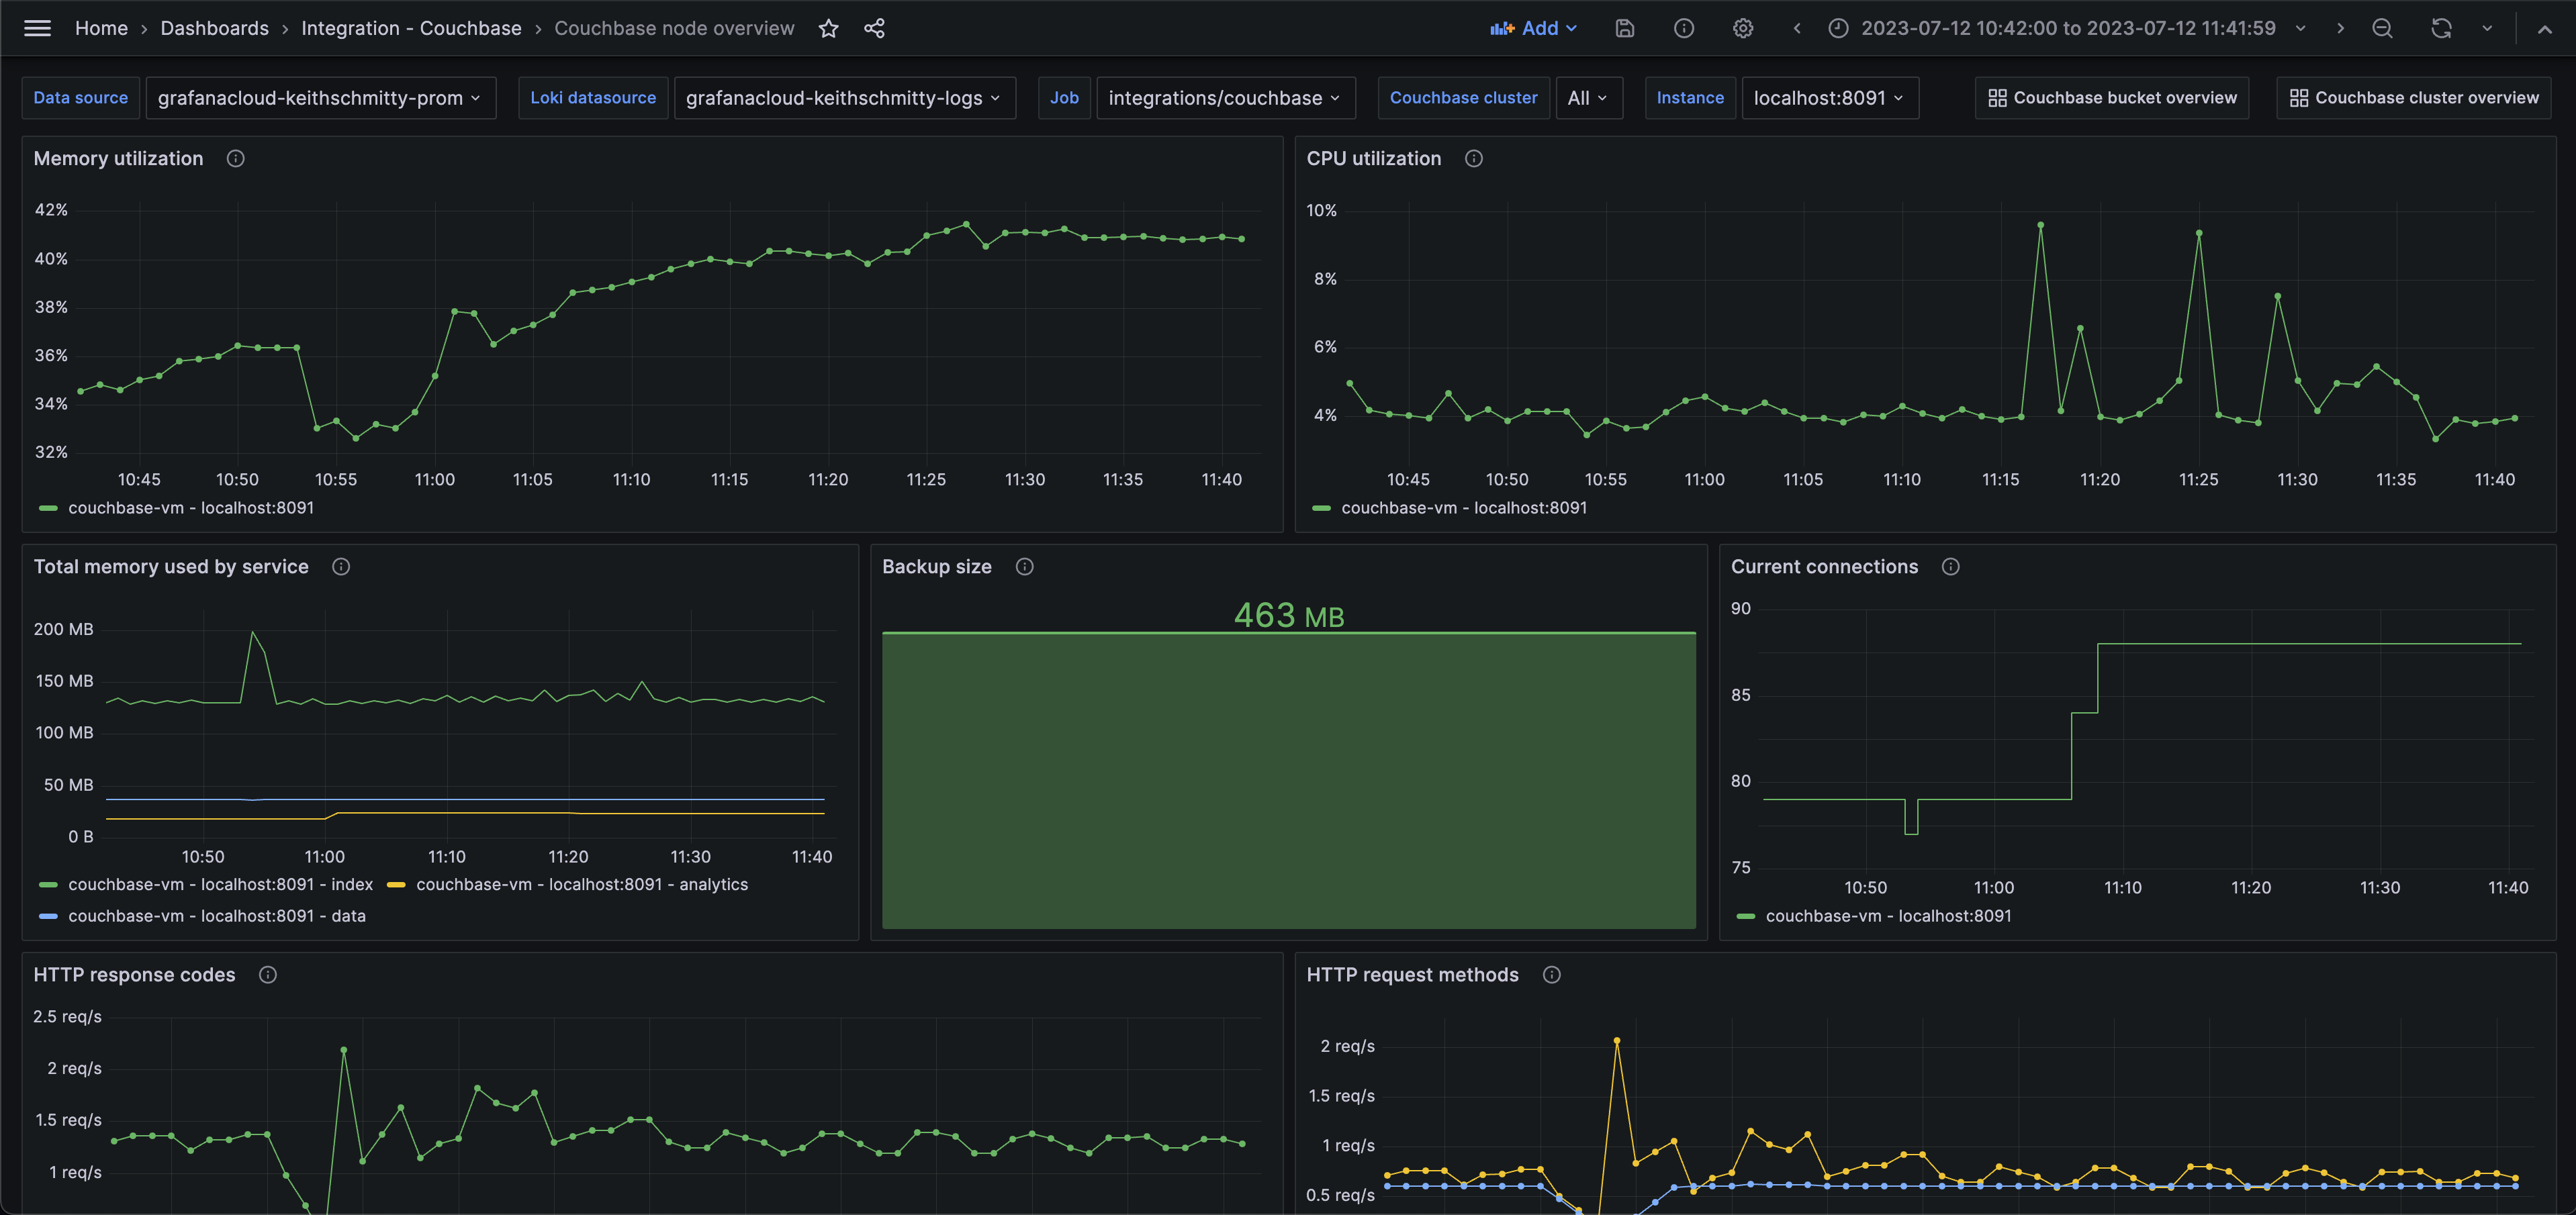
- Couchbase node overview
Couchbase cluster overview (top nodes)
Couchbase node overview (memory)
Couchbase bucket overview (storage)
Alerts
The Couchbase integration includes the following useful alerts:
| Alert | Description |
|---|---|
| CouchbaseHighCPUUsage | Critical: The node CPU usage has exceeded the critical threshold. |
| CouchbaseHighMemoryUsage | Critical: There is a limited amount of memory available for a node. |
| CouchbaseMemoryEvictionRate | Warning: There is a spike in evictions in a bucket, which indicates high memory pressure. |
| CouchbaseInvalidRequestVolume | Warning: There is a high volume of incoming invalid requests, which may indicate a DOS or injection attack. |
Metrics
The most important metrics provided by the Couchbase integration, which are used on the pre-built dashboards and Prometheus alerts, are as follows:
- backup_data_size
- cbas_direct_memory_used_bytes
- cm_http_requests_total
- couch_docs_actual_disk_size
- index_avg_scan_latency
- index_cache_hits
- index_cache_misses
- index_memory_used_total
- index_num_requests
- kv_curr_connections
- kv_curr_items
- kv_ep_num_value_ejects
- kv_mem_used_bytes
- kv_num_high_pri_requests
- kv_num_vbuckets
- kv_ops
- kv_ops_failed
- kv_vb_queue_memory_bytes
- n1ql_errors
- n1ql_invalid_requests
- n1ql_requests
- n1ql_requests_1000ms
- n1ql_requests_250ms
- n1ql_requests_5000ms
- n1ql_requests_500ms
- sys_cpu_utilization_rate
- sys_mem_actual_free
- sys_mem_actual_used
- up
- xdcr_data_replicated_bytes
- xdcr_docs_received_from_dcp_total
Changelog
# 1.0.0 - March 2024

- Added cluster selector to dashboards for kubernetes support
- Added default cluster label to agent config
- Bump version to 1.0.0

# 0.0.3 - September 2023

* New Filter Metrics option for configuring the Grafana Agent, which saves on metrics cost by dropping any metric not used by this integration. Beware that anything custom built using metrics that are not on the snippet will stop working.
* New hostname relabel option, which applies the instance name you write on the text box to the Grafana Agent configuration snippets, making it easier and less error prone to configure this mandatory label.

# 0.0.2 - August 2023

* Add regex filter for logs datasource

# 0.0.1 - July 2023

- Initial release
Cost
By connecting your Couchbase instance to Grafana Cloud, you might incur charges. To view information on the number of active series that your Grafana Cloud account uses for metrics included in each Cloud tier, see Active series and dpm usage and Cloud tier pricing.
Was this page helpful?
Related resources from Grafana Labs


