
Ceph integration for Grafana Cloud
Ceph uniquely delivers object, block, and file storage in one unified system.
This integration includes 6 useful alerts and 1 pre-built dashboard to help monitor and visualize Ceph metrics.
Before you begin
In order for the Ceph integration to work, you must enable the built-in Prometheus plugin in your Ceph cluster, with the provided command:
ceph mgr module enable prometheusInstall Ceph integration for Grafana Cloud
- In your Grafana Cloud stack, click Connections in the left-hand menu.
- Find Ceph and click its tile to open the integration.
- Review the prerequisites in the Configuration Details tab and set up Grafana Agent to send Ceph metrics to your Grafana Cloud instance.
- Click Install to add this integration’s pre-built dashboard and alerts to your Grafana Cloud instance, and you can start monitoring your Ceph setup.
Configuration snippets for Grafana Alloy
Simple mode
These snippets are configured to scrape a single Ceph instance running locally with default ports.
First, manually copy and append the following snippets into your alloy configuration file.
Metrics snippets
discovery.relabel "metrics_integrations_integrations_ceph" {
	targets = [{
		__address__  = "cephnode1:9283",
		ceph_cluster = "my-cluster",
	}]

	rule {
		target_label = "instance"
		replacement  = constants.hostname
	}
}

prometheus.scrape "metrics_integrations_integrations_ceph" {
	targets    = discovery.relabel.metrics_integrations_integrations_ceph.output
	forward_to = [prometheus.remote_write.metrics_service.receiver]
	job_name   = "integrations/ceph"
}
Advanced mode
The following snippets provide examples to guide you through the configuration process.
To instruct Grafana Alloy to scrape your Ceph instances, manually copy and append the snippets to your alloy configuration file, then follow subsequent instructions.
Advanced metrics snippets
discovery.relabel "metrics_integrations_integrations_ceph" {
	targets = [{
		__address__  = "cephnode1:9283",
		ceph_cluster = "my-cluster",
	}]

	rule {
		target_label = "instance"
		replacement  = constants.hostname
	}
}

prometheus.scrape "metrics_integrations_integrations_ceph" {
	targets    = discovery.relabel.metrics_integrations_integrations_ceph.output
	forward_to = [prometheus.remote_write.metrics_service.receiver]
	job_name   = "integrations/ceph"
}
To monitor your Ceph instance, you must use a discovery.relabel component to discover your Ceph Prometheus endpoint and apply appropriate labels, followed by a prometheus.scrape component to scrape it.
Configure the following properties within each discovery.relabel component:
__address__: The address to your Ceph Prometheus metrics endpoint.instancelabel:constants.hostnamesets theinstancelabel to your Grafana Alloy server hostname. If that is not suitable, change it to a value uniquely identifies this Ceph instance.ceph_cluster: must be the value that identifies the Ceph cluster this instance belongs to.
If you have multiple Ceph servers to scrape, configure one discovery.relabel for each and scrape them by including each under targets within the prometheus.scrape component.
Grafana Agent static configuration (deprecated)
The following section shows configuration for running Grafana Agent in static mode which is deprecated. You should use Grafana Alloy for all new deployments.
Before you begin
In order for the Ceph integration to work, you must enable the built-in Prometheus plugin in your Ceph cluster, with the provided command:
ceph mgr module enable prometheusInstall Ceph integration for Grafana Cloud
- In your Grafana Cloud stack, click Connections in the left-hand menu.
- Find Ceph and click its tile to open the integration.
- Review the prerequisites in the Configuration Details tab and set up Grafana Agent to send Ceph metrics to your Grafana Cloud instance.
- Click Install to add this integration’s pre-built dashboard and alerts to your Grafana Cloud instance, and you can start monitoring your Ceph setup.
Post-install configuration for the Ceph integration
After enabling the prometheus plugin, instruct Grafana Agent to scrape your Ceph nodes.
Ceph exposes a /metrics endpoint. To scrape it, add the provided snippet to your agent configuration file.
A ceph_cluster label must be added to each scrape, such as the snippet. This is used as a filter in the dashboards, so you can monitor your nodes by cluster. Make sure to give it a value according to your environment.
Make sure to change targets in the snippet according to your environment.
Configuration snippets for Grafana Agent
Below metrics.configs.scrape_configs, insert the following lines and change the URLs according to your environment:
    - job_name: integrations/ceph # one job per node
      relabel_configs:
      - replacement: '<your-instance-name>'
        target_label: instance
      static_configs:
        - targets: ['cephnode1:9283']
          labels:
            ceph_cluster: 'my-cluster'
Full example configuration for Grafana Agent
Refer to the following Grafana Agent configuration for a complete example that contains all the snippets used for the Ceph integration. This example also includes metrics that are sent to monitor your Grafana Agent instance.
integrations:
  prometheus_remote_write:
  - basic_auth:
      password: <your_prom_pass>
      username: <your_prom_user>
    url: <your_prom_url>
  agent:
    enabled: true
    relabel_configs:
    - action: replace
      source_labels:
      - agent_hostname
      target_label: instance
    - action: replace
      target_label: job
      replacement: "integrations/agent-check"
    metric_relabel_configs:
    - action: keep
      regex: (prometheus_target_sync_length_seconds_sum|prometheus_target_scrapes_.*|prometheus_target_interval.*|prometheus_sd_discovered_targets|agent_build.*|agent_wal_samples_appended_total|process_start_time_seconds)
      source_labels:
      - __name__
  # Add here any snippet that belongs to the `integrations` section.
  # For a correct indentation, paste snippets copied from Grafana Cloud at the beginning of the line.
logs:
  configs:
  - clients:
    - basic_auth:
        password: <your_loki_pass>
        username: <your_loki_user>
      url: <your_loki_url>
    name: integrations
    positions:
      filename: /tmp/positions.yaml
    scrape_configs:
      # Add here any snippet that belongs to the `logs.configs.scrape_configs` section.
      # For a correct indentation, paste snippets copied from Grafana Cloud at the beginning of the line.
metrics:
  configs:
  - name: integrations
    remote_write:
    - basic_auth:
        password: <your_prom_pass>
        username: <your_prom_user>
      url: <your_prom_url>
    scrape_configs:
      # Add here any snippet that belongs to the `metrics.configs.scrape_configs` section.
      # For a correct indentation, paste snippets copied from Grafana Cloud at the beginning of the line.
    - job_name: integrations/ceph # one job per node
      relabel_configs:
      - replacement: '<your-instance-name>'
        target_label: instance
      static_configs:
        - targets: ['cephnode1:9283']
          labels:
            ceph_cluster: 'my-cluster'
  global:
    scrape_interval: 60s
  wal_directory: /tmp/grafana-agent-wal
Dashboards
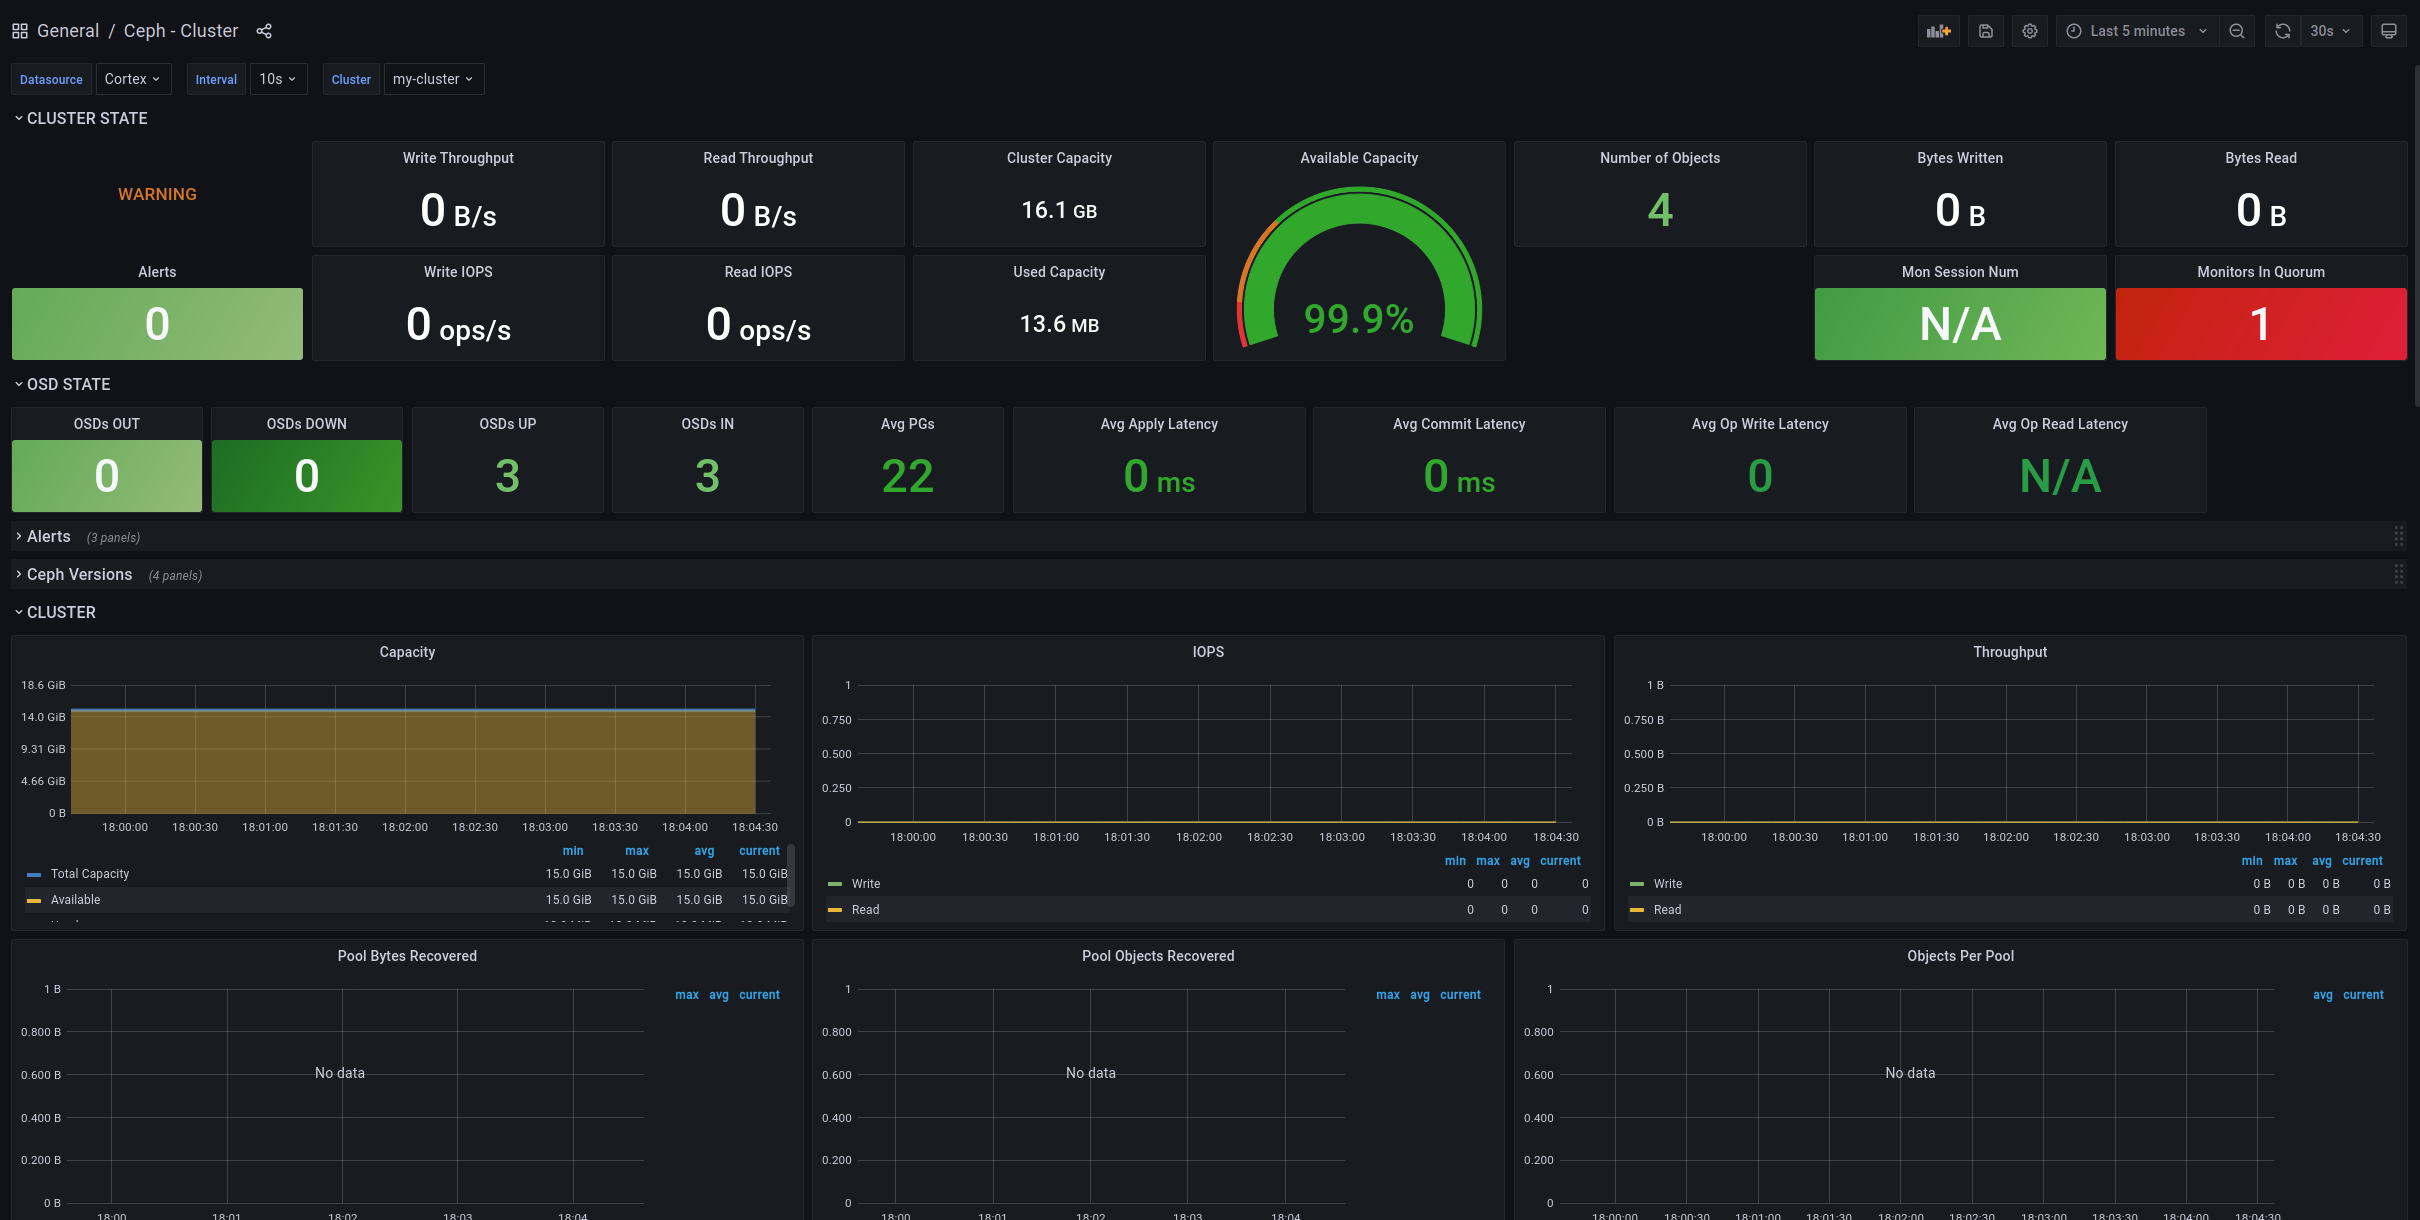
The Ceph integration installs the following dashboards in your Grafana Cloud instance to help monitor your system.
- Ceph - Cluster
Ceph Cluster
Alerts
The Ceph integration includes the following useful alerts:
| Alert | Description |
|---|---|
| CephUnhealthyWarning | Warning: The Ceph cluster has warning level issues. |
| CephUnhealthyCritical | Critical: The Ceph cluster has critical issues. |
| CephDiskLessThan15Left | Warning: The Ceph cluster has less than 15% storage space left. |
| CephDiskLessThan5Left | Critical: The Ceph cluster has less than 5% storage space left. |
| OSDNodeDown | Warning: The OSD node is down. |
| MDSDown | Warning: All MDS nodes down. |
Metrics
The most important metrics provided by the Ceph integration, which are used on the pre-built dashboard and Prometheus alerts, are as follows:
- ceph_bluestore_commit_lat_count
- ceph_cluster_total_bytes
- ceph_cluster_total_used_bytes
- ceph_filestore_journal_latency_count
- ceph_health_status
- ceph_mds_metadata
- ceph_mon_metadata
- ceph_mon_num_sessions
- ceph_mon_quorum_status
- ceph_osd_apply_latency_ms
- ceph_osd_commit_latency_ms
- ceph_osd_in
- ceph_osd_metadata
- ceph_osd_numpg
- ceph_osd_op_r
- ceph_osd_op_r_latency_count
- ceph_osd_op_r_latency_sum
- ceph_osd_op_r_out_bytes
- ceph_osd_op_w
- ceph_osd_op_w_in_bytes
- ceph_osd_op_w_latency_count
- ceph_osd_op_w_latency_sum
- ceph_osd_recovery_ops
- ceph_osd_up
- ceph_pg_active
- ceph_pg_backfill
- ceph_pg_backfill_toofull
- ceph_pg_clean
- ceph_pg_creating
- ceph_pg_deep
- ceph_pg_degraded
- ceph_pg_down
- ceph_pg_forced_backfill
- ceph_pg_forced_recovery
- ceph_pg_incomplete
- ceph_pg_inconsistent
- ceph_pg_peered
- ceph_pg_peering
- ceph_pg_recovering
- ceph_pg_remapped
- ceph_pg_repair
- ceph_pg_scrubbing
- ceph_pg_stale
- ceph_pg_undersized
- ceph_pg_wait_backfill
- ceph_pool_metadata
- ceph_pool_num_bytes_recovered
- ceph_pool_num_objects_recovered
- ceph_pool_objects
- ceph_pool_quota_bytes
- ceph_pool_quota_objects
- ceph_rgw_metadata
- ceph_unclean_pgs
- up
Changelog
# 1.0.0 - February 2024

* Updated mixin:
  - Replace all Angular panels with React based panels.
  - Address lint issues

# 0.0.6 - September 2023

* Update Grafana Agent configuration snippets to include filtered metrics used in gauge panels

# 0.0.5 - September 2023

* New Filter Metrics option for configuring the Grafana Agent, which saves on metrics cost by dropping any metric not used by this integration. Beware that anything custom built using metrics that are not on the snippet will stop working.
* New hostname relabel option, which applies the instance name you write on the text box to the Grafana Agent configuration snippets, making it easier and less error prone to configure this mandatory label.

# 0.0.4 - September 2022

* Update panels descriptions.

# 0.0.3 - April 2022

* Update mixin to latest version:
  - Removes all cluster variable in favor of `ceph_cluster`
  - Removes `node_exporter` based panels
  - Migrates from graph panel to time series panels
  - Removes panel stacking
  - Fixes `CephUnhealthy` alert - spliting into 2 different alerts with Warning and Critical levels
  - Sets default time threshold to 5m on all alerts

# 0.0.2 - October 2021

*  Update all rate queries to use `$__rate_interval`, so they respect the default resolution

# 0.0.1 - August 2021

* Initial release
Cost
By connecting your Ceph instance to Grafana Cloud, you might incur charges. To view information on the number of active series that your Grafana Cloud account uses for metrics included in each Cloud tier, see Active series and dpm usage and Cloud tier pricing.
Was this page helpful?
Related resources from Grafana Labs


