
Asterisk integration for Grafana Cloud
Asterisk is a free and open source framework for building communications applications and is sponsored by Sangoma. Asterisk enables the creation of communication applications such as PBX (private branch exchange), VoIP (Voice over Internet Protocol), and conference servers. The Asterisk integration can monitor useful metrics and logs of an asterisk instance.
This integration includes 4 useful alerts and 2 pre-built dashboards to help monitor and visualize Asterisk metrics and logs.
Before you begin
In order for this integration to work, you must enable the embedded Prometheus exporter in Asterisk to collect and expose Asterisk metrics. The embedded Prometheus exporter also requires the embedded Asterisk HTTP server to be enabled.
When both the Asterisk HTTP server and Prometheus exporter are enabled - the metrics are exposed by default on the URL: http://localhost:8088/metrics
To enable logs collection, logging to file must be enabled in asterisk configuration.
Sample res_prometheus configuration /etc/asterisk/prometheus.conf
[general]
enabled = yes
core_metrics_enabled = yes
uri = metrics
Sample http_server configuration /etc/asterisk/http.conf
[general]
enabled=yes
enablestatic=yes
bindaddr=0.0.0.0
bindport=8088
prefix=
sessionlimit=100
session_inactivity=30000
session_keep_alive=15000
Sample file logging configuration in /etc/asterisk/logger.conf
[logfiles]
full => notice,warning,error,verbose,dtmf,fax
Once the configurations are updated, restart the Asterisk server with the following command: sudo systemctl restart asterisk
Check the status of the Asterisk server: sudo systemctl status asterisk
Then login to the Asterisk CLI to verify it’s running: sudo asterisk -r
The metrics should be exposed by the embedded Prometheus exporter on the URL http:/localhost:8088/metrics
Install Asterisk integration for Grafana Cloud
- In your Grafana Cloud stack, click Connections in the left-hand menu.
- Find Asterisk and click its tile to open the integration.
- Review the prerequisites in the Configuration Details tab and set up Grafana Agent to send Asterisk metrics and logs to your Grafana Cloud instance.
- Click Install to add this integration’s pre-built dashboards and alerts to your Grafana Cloud instance, and you can start monitoring your Asterisk setup.
Configuration snippets for Grafana Alloy
Simple mode
These snippets are configured to scrape a single Asterisk instance running locally with default ports.
First, manually copy and append the following snippets into your alloy configuration file.
Metrics snippets
discovery.relabel "metrics_integrations_integrations_asterisk_prom" {
	targets = [{
		__address__ = "localhost:8088",
	}]

	rule {
		target_label = "instance"
		replacement  = constants.hostname
	}
}

prometheus.scrape "metrics_integrations_integrations_asterisk_prom" {
	targets    = discovery.relabel.metrics_integrations_integrations_asterisk_prom.output
	forward_to = [prometheus.remote_write.metrics_service.receiver]
	job_name   = "integrations/asterisk-prom"
}
Logs snippets
darwin
local.file_match "logs_integrations_integrations_asterisk_logs" {
	path_targets = [{
		__address__ = "localhost",
		__path__    = "/var/log/asterisk/full",
		instance    = constants.hostname,
		job         = "integrations/asterisk-logs",
	}]
}

loki.source.file "logs_integrations_integrations_asterisk_logs" {
	targets    = local.file_match.logs_integrations_integrations_asterisk_logs.targets
	forward_to = [loki.write.grafana_cloud_loki.receiver]
}
linux
local.file_match "logs_integrations_integrations_asterisk_logs" {
	path_targets = [{
		__address__ = "localhost",
		__path__    = "/var/log/asterisk/full",
		instance    = constants.hostname,
		job         = "integrations/asterisk-logs",
	}]
}

loki.source.file "logs_integrations_integrations_asterisk_logs" {
	targets    = local.file_match.logs_integrations_integrations_asterisk_logs.targets
	forward_to = [loki.write.grafana_cloud_loki.receiver]
}
windows
local.file_match "logs_integrations_integrations_asterisk_logs" {
	path_targets = [{
		__address__ = "localhost",
		__path__    = "/var/log/asterisk/full",
		instance    = constants.hostname,
		job         = "integrations/asterisk-logs",
	}]
}

loki.source.file "logs_integrations_integrations_asterisk_logs" {
	targets    = local.file_match.logs_integrations_integrations_asterisk_logs.targets
	forward_to = [loki.write.grafana_cloud_loki.receiver]
}
Advanced mode
The following snippets provide examples to guide you through the configuration process.
To instruct Grafana Alloy to scrape your Asterisk instances, manually copy and append the snippets to your alloy configuration file, then follow subsequent instructions.
Advanced metrics snippets
discovery.relabel "metrics_integrations_integrations_asterisk_prom" {
	targets = [{
		__address__ = "localhost:8088",
	}]

	rule {
		target_label = "instance"
		replacement  = constants.hostname
	}
}

prometheus.scrape "metrics_integrations_integrations_asterisk_prom" {
	targets    = discovery.relabel.metrics_integrations_integrations_asterisk_prom.output
	forward_to = [prometheus.remote_write.metrics_service.receiver]
	job_name   = "integrations/asterisk-prom"
}
To monitor your Asterisk instance, you must use a discovery.relabel component to discover your Asterisk Prometheus endpoint and apply appropriate labels, followed by a prometheus.scrape component to scrape it.
Configure the following properties within each discovery.relabel component:
__address__: The address to your Asterisk Prometheus metrics endpoint.instancelabel:constants.hostnamesets theinstancelabel to your Grafana Alloy server hostname. If that is not suitable, change it to a value uniquely identifies this Asterisk instance. Make sure this label value is the same for all telemetry data collected for this instance.
If you have multiple Asterisk servers to scrape, configure one discovery.relabel for each and scrape them by including each under targets within the prometheus.scrape component.
Advanced logs snippets
darwin
local.file_match "logs_integrations_integrations_asterisk_logs" {
	path_targets = [{
		__address__ = "localhost",
		__path__    = "/var/log/asterisk/full",
		instance    = constants.hostname,
		job         = "integrations/asterisk-logs",
	}]
}

loki.source.file "logs_integrations_integrations_asterisk_logs" {
	targets    = local.file_match.logs_integrations_integrations_asterisk_logs.targets
	forward_to = [loki.write.grafana_cloud_loki.receiver]
}
To monitor your Asterisk instance logs, you will use a combination of the following components:
local.file_match defines where to find the log file to be scraped. Change the following properties according to your environment:
__address__: The Asterisk instance address__path__: The path to the log file. The agent also must be configured to collect logs from thefullAsterisk log file as shown in the snippet.instancelabel:constants.hostnamesets theinstancelabel to your Grafana Alloy server hostname. If that is not suitable, change it to a value uniquely identifies this Asterisk instance. Make sure this label value is the same for all telemetry data collected for this instance.
loki.source.file sends logs to Loki.
linux
local.file_match "logs_integrations_integrations_asterisk_logs" {
	path_targets = [{
		__address__ = "localhost",
		__path__    = "/var/log/asterisk/full",
		instance    = constants.hostname,
		job         = "integrations/asterisk-logs",
	}]
}

loki.source.file "logs_integrations_integrations_asterisk_logs" {
	targets    = local.file_match.logs_integrations_integrations_asterisk_logs.targets
	forward_to = [loki.write.grafana_cloud_loki.receiver]
}
To monitor your Asterisk instance logs, you will use a combination of the following components:
local.file_match defines where to find the log file to be scraped. Change the following properties according to your environment:
__address__: The Asterisk instance address__path__: The path to the log file. The agent also must be configured to collect logs from thefullAsterisk log file as shown in the snippet.instancelabel:constants.hostnamesets theinstancelabel to your Grafana Alloy server hostname. If that is not suitable, change it to a value uniquely identifies this Asterisk instance. Make sure this label value is the same for all telemetry data collected for this instance.
loki.source.file sends logs to Loki.
windows
local.file_match "logs_integrations_integrations_asterisk_logs" {
	path_targets = [{
		__address__ = "localhost",
		__path__    = "/var/log/asterisk/full",
		instance    = constants.hostname,
		job         = "integrations/asterisk-logs",
	}]
}

loki.source.file "logs_integrations_integrations_asterisk_logs" {
	targets    = local.file_match.logs_integrations_integrations_asterisk_logs.targets
	forward_to = [loki.write.grafana_cloud_loki.receiver]
}
To monitor your Asterisk instance logs, you will use a combination of the following components:
local.file_match defines where to find the log file to be scraped. Change the following properties according to your environment:
__address__: The Asterisk instance address__path__: The path to the log file. The agent also must be configured to collect logs from thefullAsterisk log file as shown in the snippet.instancelabel:constants.hostnamesets theinstancelabel to your Grafana Alloy server hostname. If that is not suitable, change it to a value uniquely identifies this Asterisk instance. Make sure this label value is the same for all telemetry data collected for this instance.
loki.source.file sends logs to Loki.
Grafana Agent static configuration (deprecated)
The following section shows configuration for running Grafana Agent in static mode which is deprecated. You should use Grafana Alloy for all new deployments.
Before you begin
In order for this integration to work, you must enable the embedded Prometheus exporter in Asterisk to collect and expose Asterisk metrics. The embedded Prometheus exporter also requires the embedded Asterisk HTTP server to be enabled.
When both the Asterisk HTTP server and Prometheus exporter are enabled - the metrics are exposed by default on the URL: http://localhost:8088/metrics
To enable logs collection, logging to file must be enabled in asterisk configuration.
Sample res_prometheus configuration /etc/asterisk/prometheus.conf
[general]
enabled = yes
core_metrics_enabled = yes
uri = metrics
Sample http_server configuration /etc/asterisk/http.conf
[general]
enabled=yes
enablestatic=yes
bindaddr=0.0.0.0
bindport=8088
prefix=
sessionlimit=100
session_inactivity=30000
session_keep_alive=15000
Sample file logging configuration in /etc/asterisk/logger.conf
[logfiles]
full => notice,warning,error,verbose,dtmf,fax
Once the configurations are updated, restart the Asterisk server with the following command: sudo systemctl restart asterisk
Check the status of the Asterisk server: sudo systemctl status asterisk
Then login to the Asterisk CLI to verify it’s running: sudo asterisk -r
The metrics should be exposed by the embedded Prometheus exporter on the URL http:/localhost:8088/metrics
Install Asterisk integration for Grafana Cloud
- In your Grafana Cloud stack, click Connections in the left-hand menu.
- Find Asterisk and click its tile to open the integration.
- Review the prerequisites in the Configuration Details tab and set up Grafana Agent to send Asterisk metrics and logs to your Grafana Cloud instance.
- Click Install to add this integration’s pre-built dashboards and alerts to your Grafana Cloud instance, and you can start monitoring your Asterisk setup.
Post-install configuration for the Asterisk integration
After enabling the metrics generation, instruct Grafana Agent to scrape your Asterisk nodes.
Asterisk exposes a /metrics endpoint. To scrape it, add the provided snippet to your agent configuration file.
The agent also must be configured to collect logs from the full Asterisk log file as shown in the snippet.
Make sure to change targets in the snippet according to your environment.
Configuration snippets for Grafana Agent
Below metrics.configs.scrape_configs, insert the following lines and change the URLs according to your environment:
    - job_name: integrations/asterisk-prom
      relabel_configs:
      - replacement: '<your-instance-name>'
        target_label: instance
      static_configs:
        - targets: ['localhost:8088']
Below logs.configs.scrape_configs, insert the following lines according to your environment.
    - job_name: integrations/asterisk-logs
      static_configs:
      - targets: ['localhost']
        labels:
          job: integrations/asterisk-logs
          instance: '<your-instance-name>'
          __path__: /var/log/asterisk/full
Full example configuration for Grafana Agent
Refer to the following Grafana Agent configuration for a complete example that contains all the snippets used for the Asterisk integration. This example also includes metrics that are sent to monitor your Grafana Agent instance.
integrations:
  prometheus_remote_write:
  - basic_auth:
      password: <your_prom_pass>
      username: <your_prom_user>
    url: <your_prom_url>
  agent:
    enabled: true
    relabel_configs:
    - action: replace
      source_labels:
      - agent_hostname
      target_label: instance
    - action: replace
      target_label: job
      replacement: "integrations/agent-check"
    metric_relabel_configs:
    - action: keep
      regex: (prometheus_target_sync_length_seconds_sum|prometheus_target_scrapes_.*|prometheus_target_interval.*|prometheus_sd_discovered_targets|agent_build.*|agent_wal_samples_appended_total|process_start_time_seconds)
      source_labels:
      - __name__
  # Add here any snippet that belongs to the `integrations` section.
  # For a correct indentation, paste snippets copied from Grafana Cloud at the beginning of the line.
logs:
  configs:
  - clients:
    - basic_auth:
        password: <your_loki_pass>
        username: <your_loki_user>
      url: <your_loki_url>
    name: integrations
    positions:
      filename: /tmp/positions.yaml
    scrape_configs:
      # Add here any snippet that belongs to the `logs.configs.scrape_configs` section.
      # For a correct indentation, paste snippets copied from Grafana Cloud at the beginning of the line.
    - job_name: integrations/asterisk-logs
      static_configs:
      - targets: ['localhost']
        labels:
          job: integrations/asterisk-logs
          instance: '<your-instance-name>'
          __path__: /var/log/asterisk/full
metrics:
  configs:
  - name: integrations
    remote_write:
    - basic_auth:
        password: <your_prom_pass>
        username: <your_prom_user>
      url: <your_prom_url>
    scrape_configs:
      # Add here any snippet that belongs to the `metrics.configs.scrape_configs` section.
      # For a correct indentation, paste snippets copied from Grafana Cloud at the beginning of the line.
    - job_name: integrations/asterisk-prom
      relabel_configs:
      - replacement: '<your-instance-name>'
        target_label: instance
      static_configs:
        - targets: ['localhost:8088']
  global:
    scrape_interval: 60s
  wal_directory: /tmp/grafana-agent-wal
Dashboards
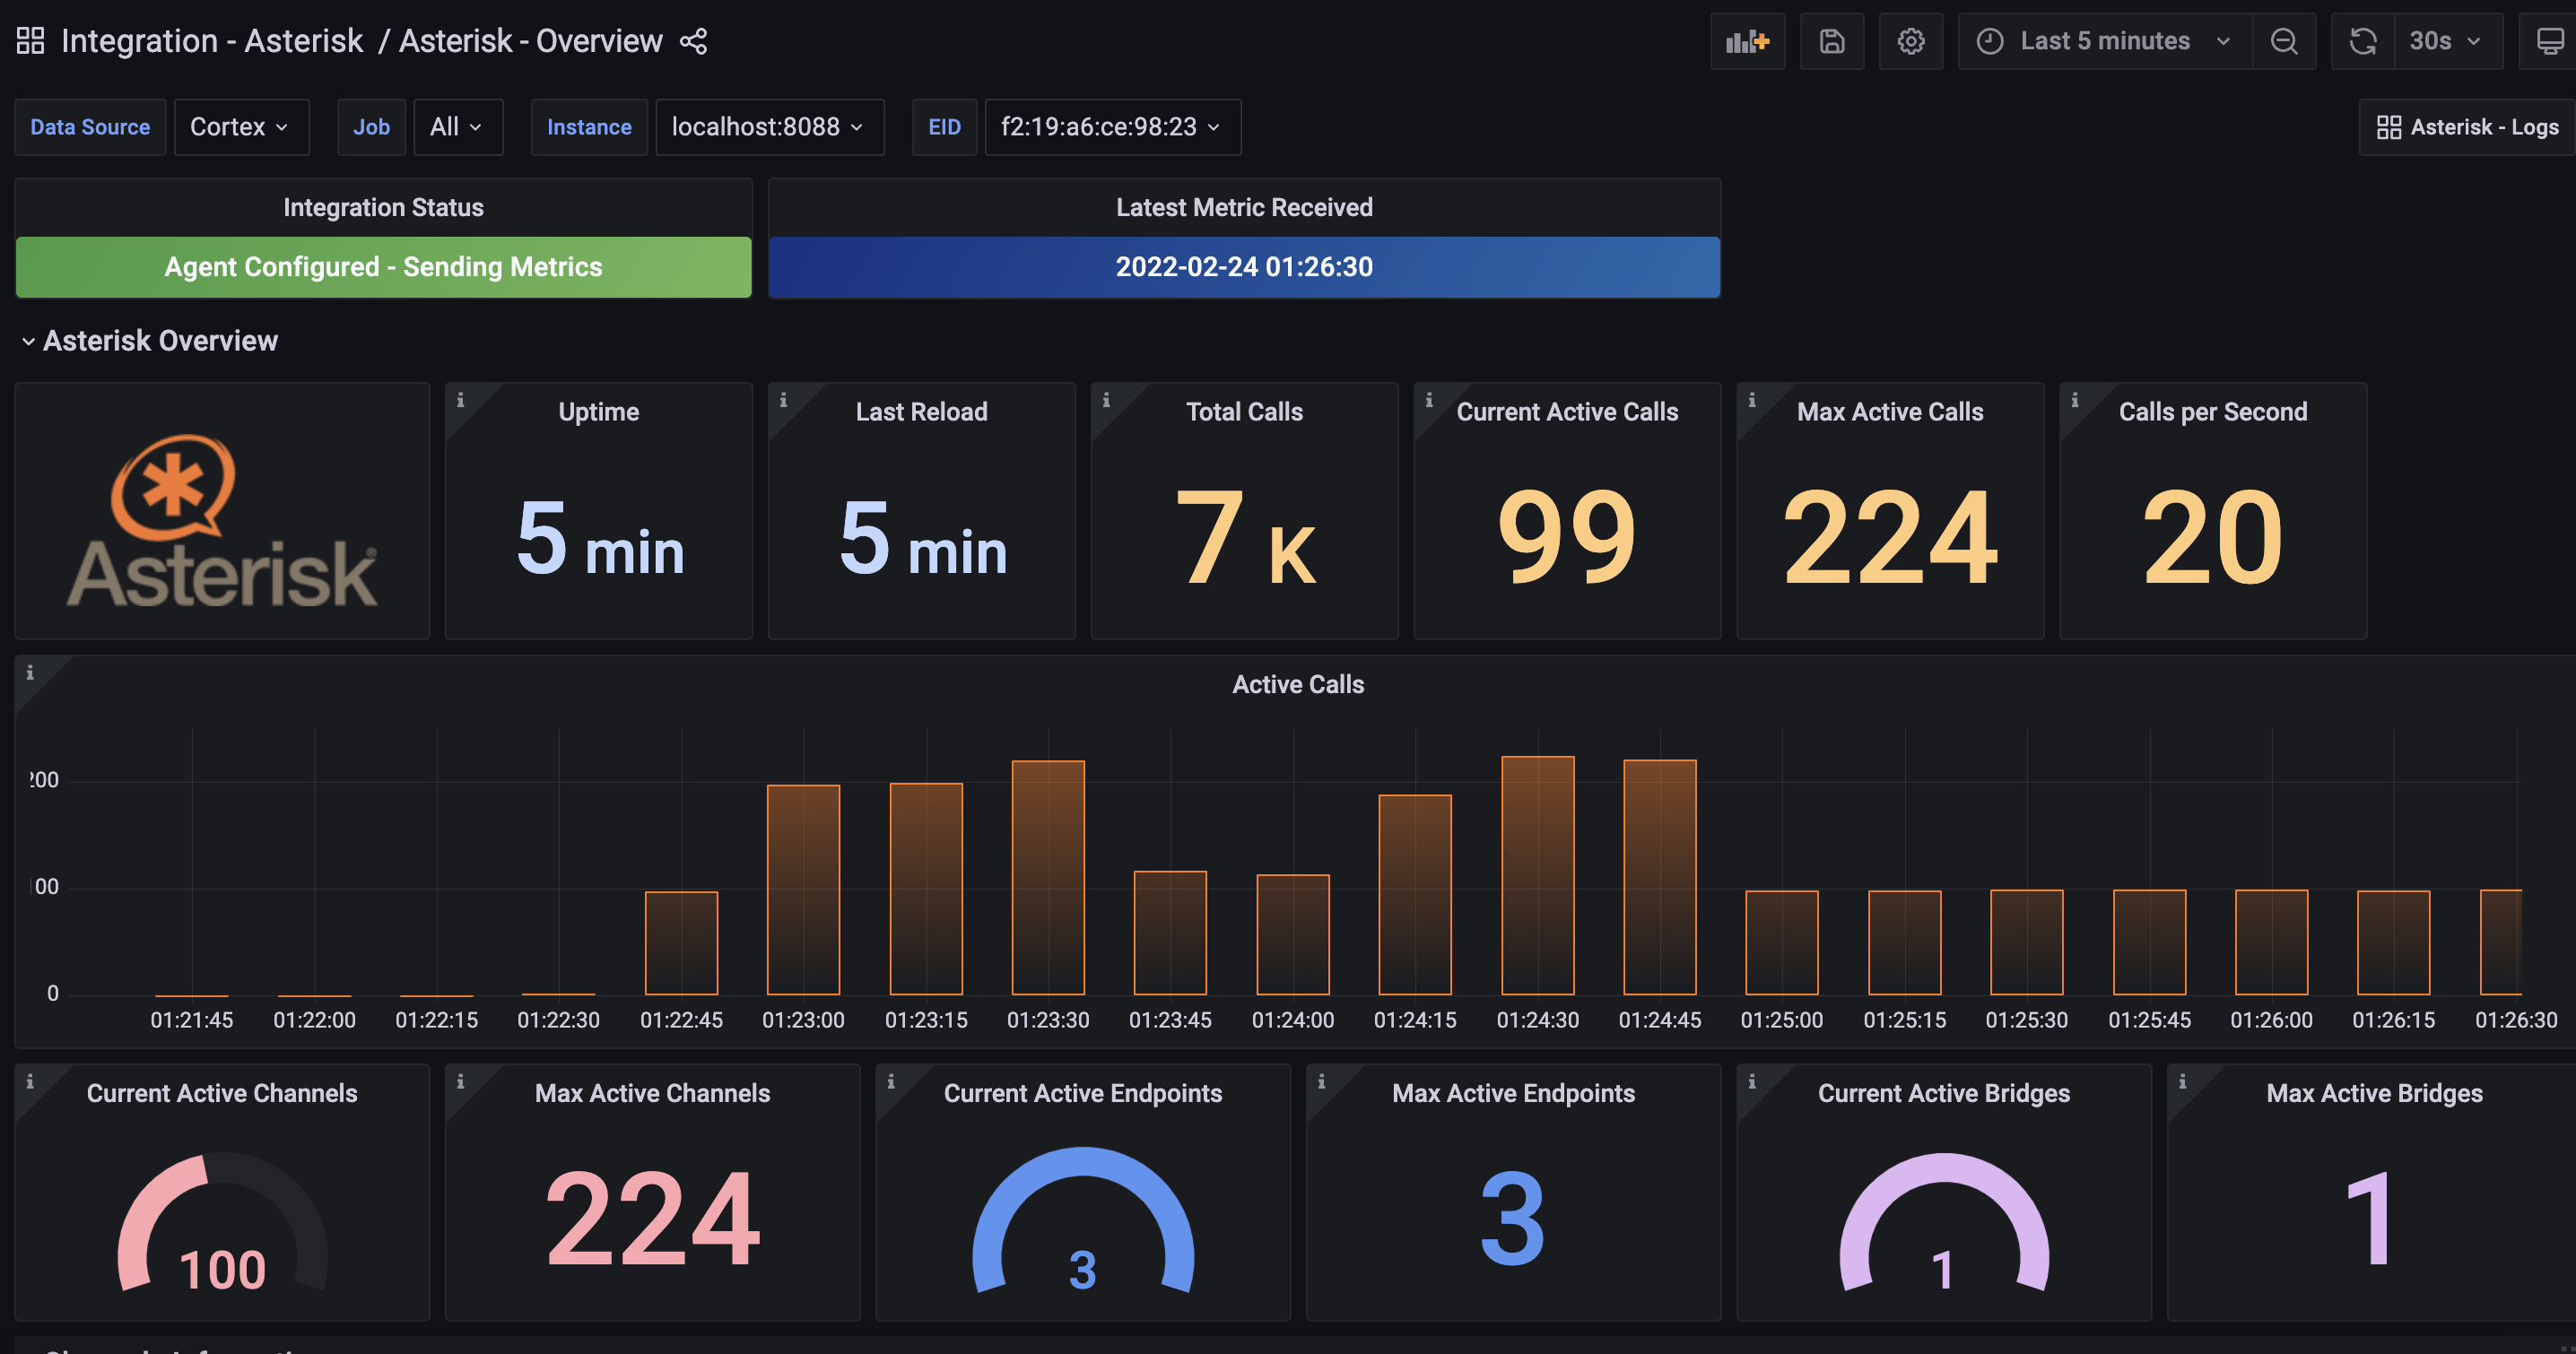
The Asterisk integration installs the following dashboards in your Grafana Cloud instance to help monitor your system.
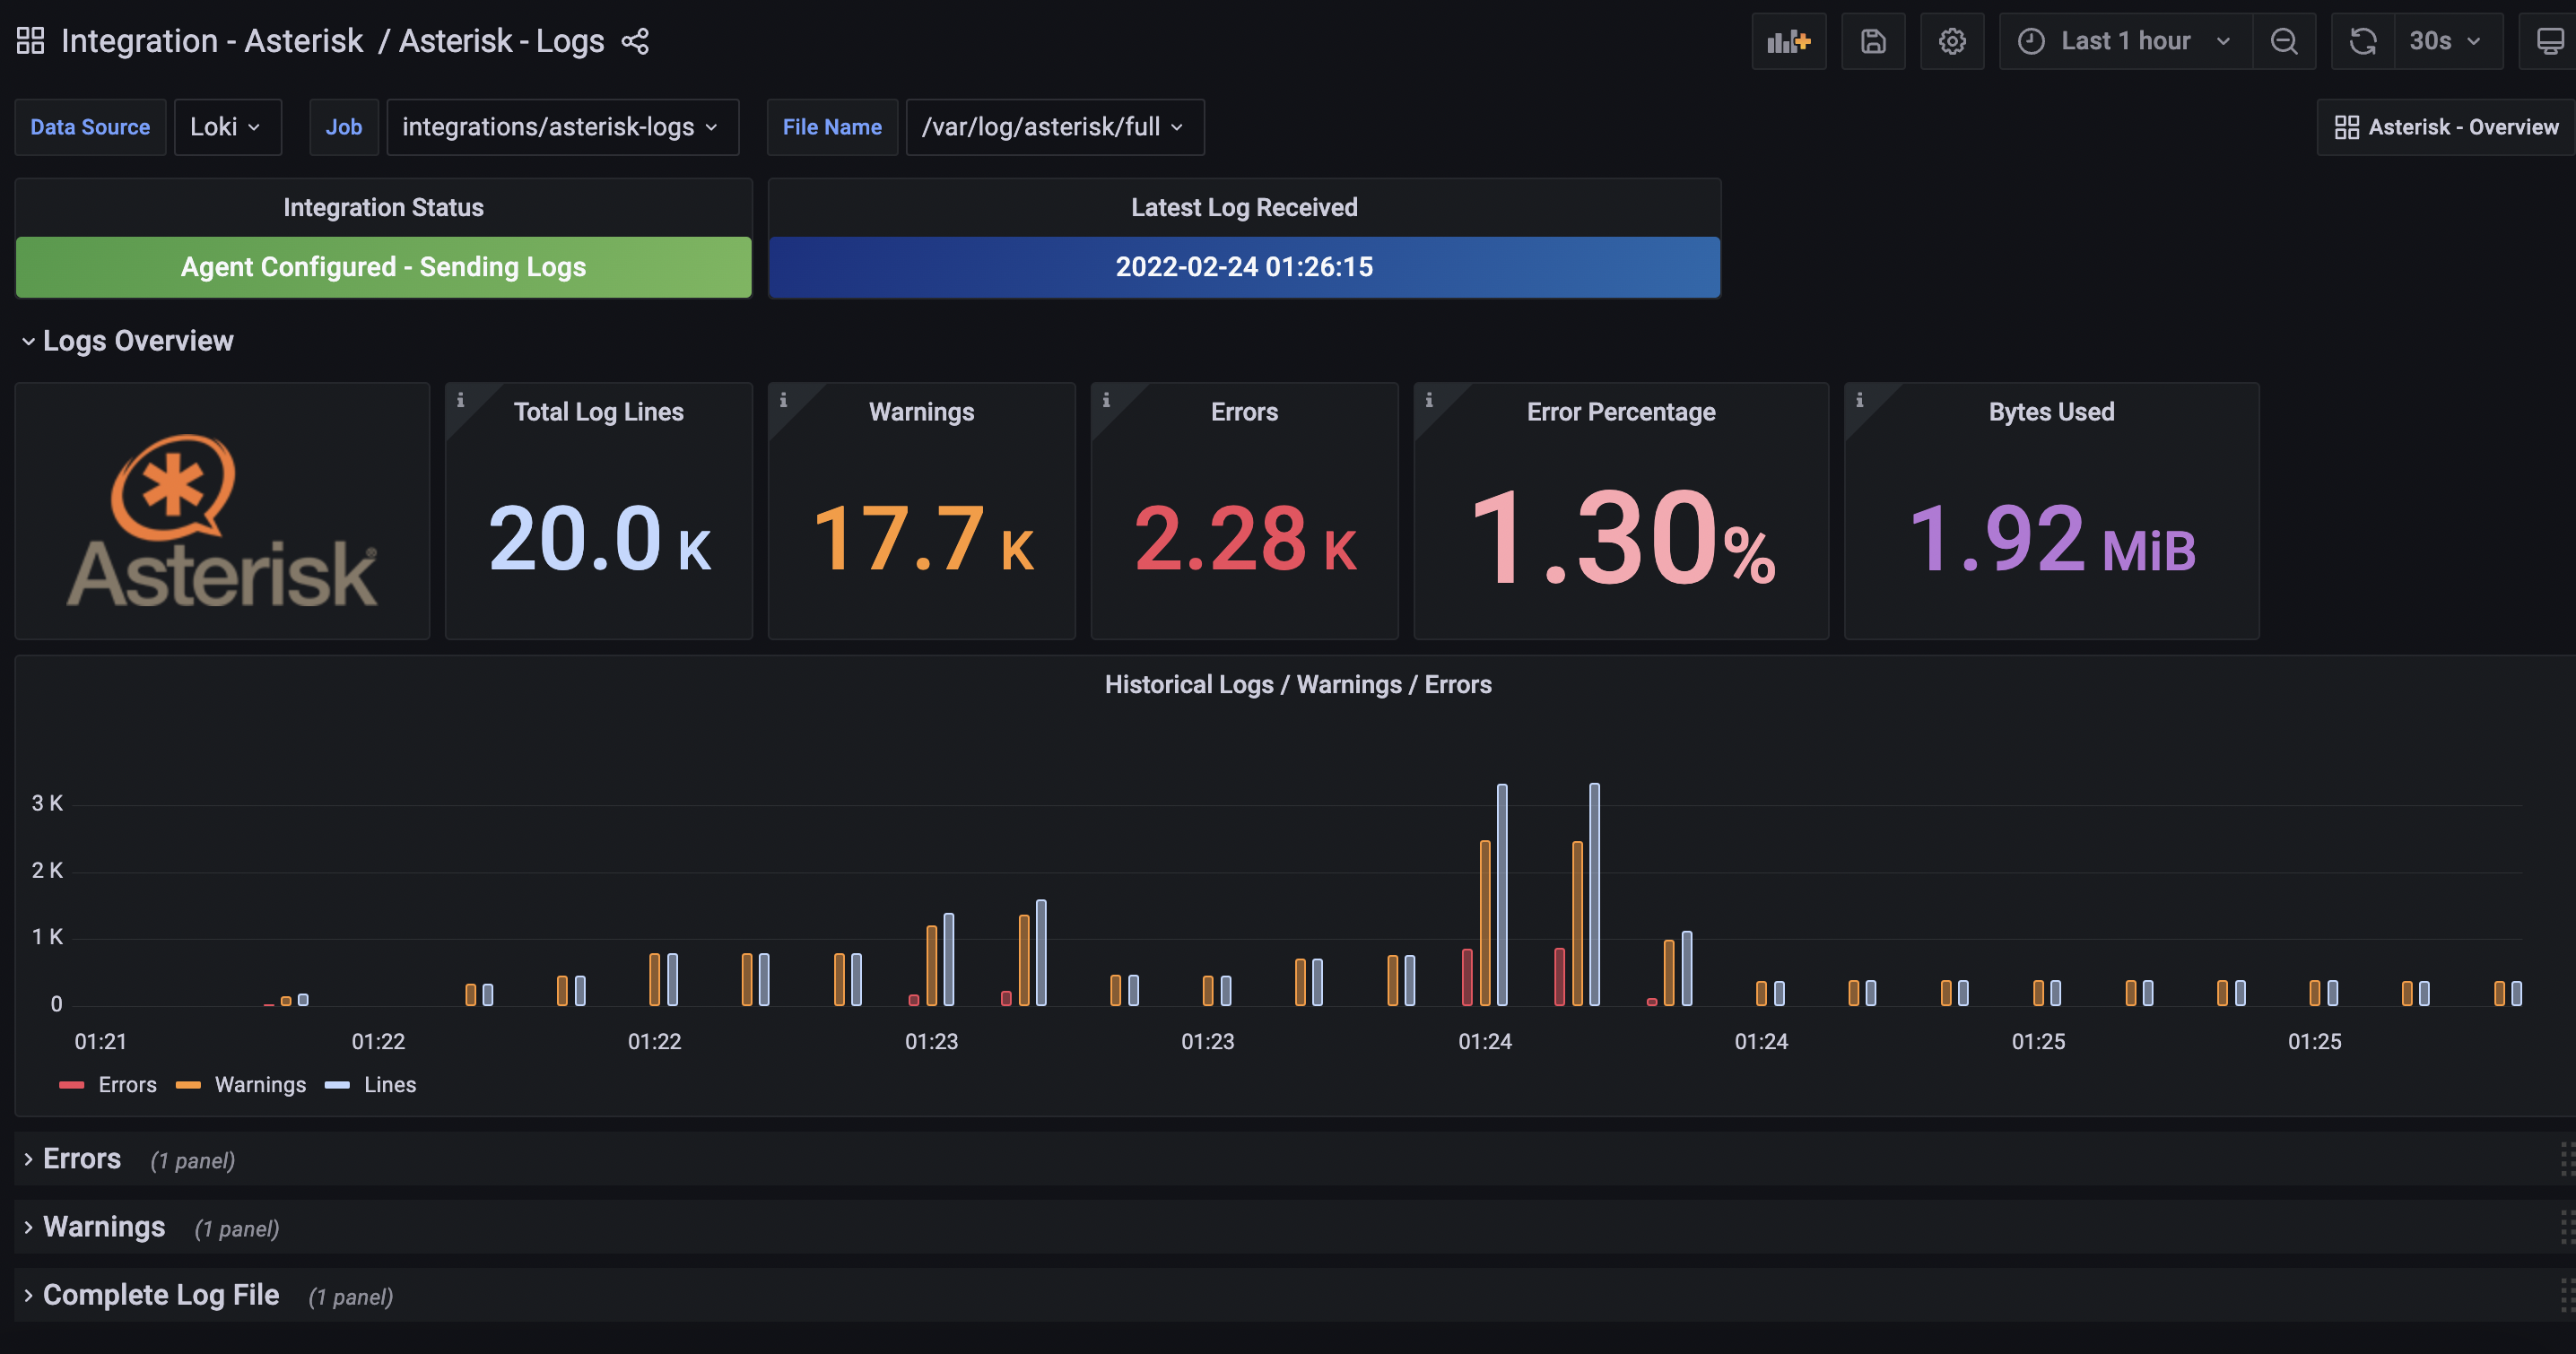
- Asterisk - Logs
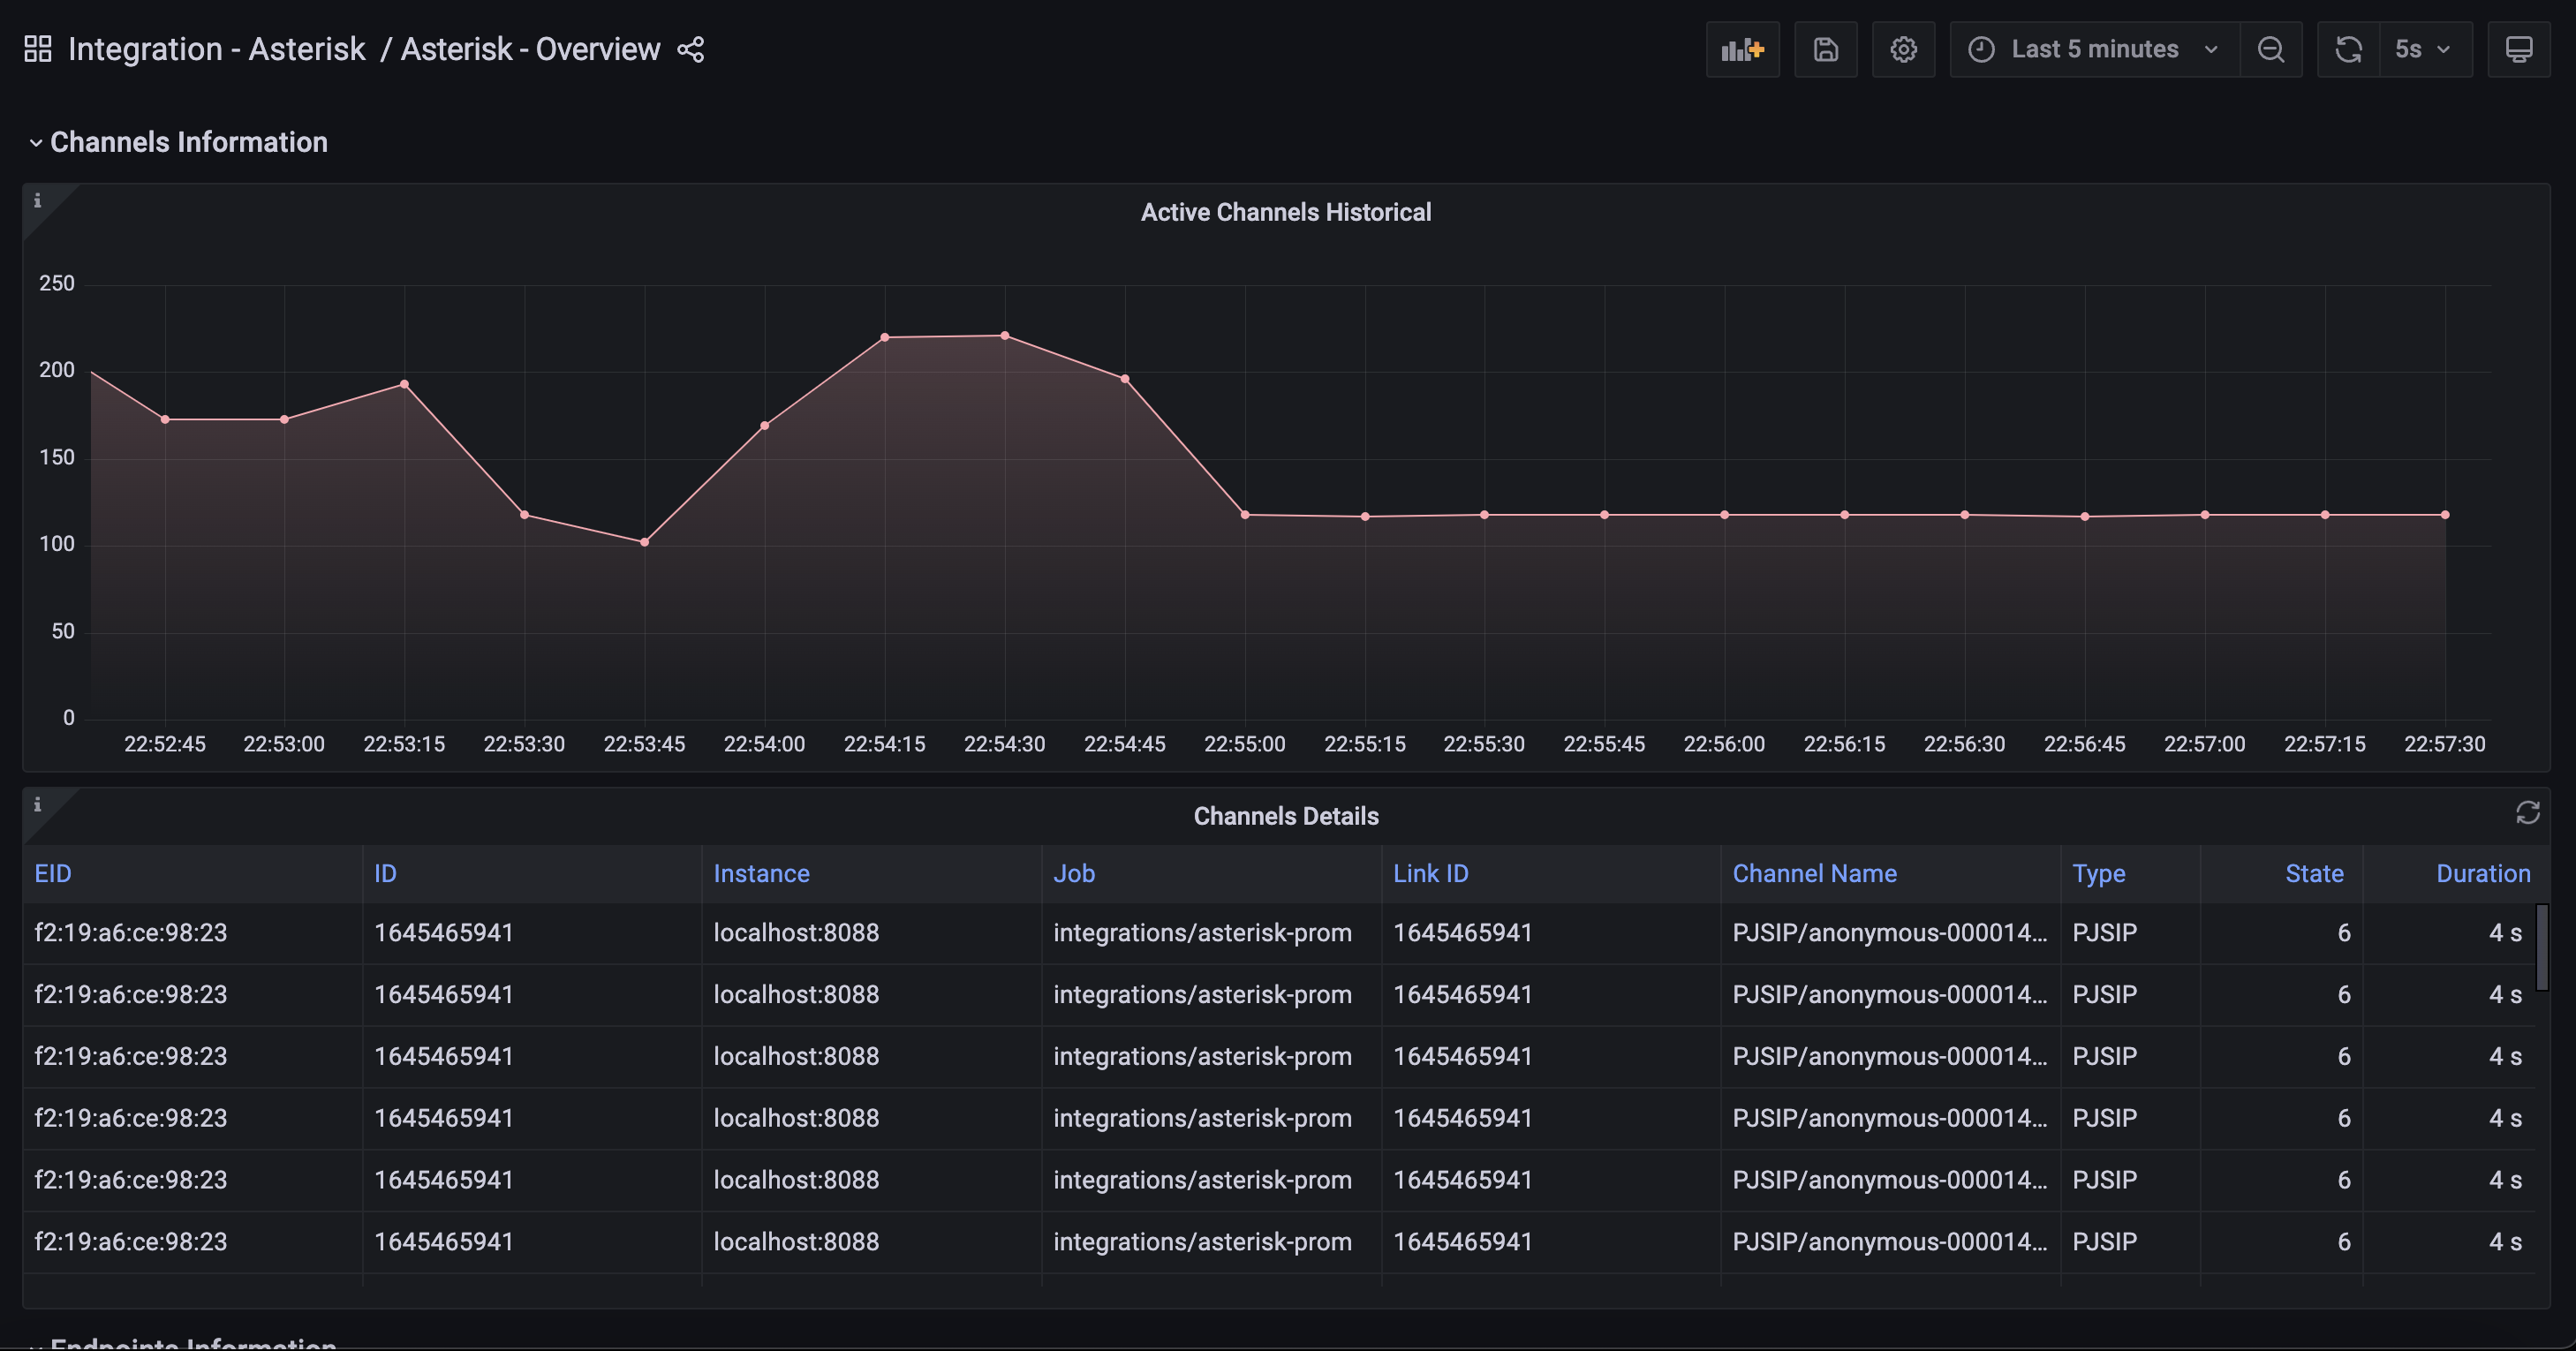
- Asterisk - Overview
Overview
Logs Overview
Channels Information
Alerts
The Asterisk integration includes the following useful alerts:
| Alert | Description |
|---|---|
| AsteriskRestarted | Critical: Asterisk instance restarted in the last minute. |
| AsteriskReloaded | Warning: Asterisk instance reloaded in the last minute. |
| AsteriskHighScrapeTime | Critical: Asterisk instance core high scrape time. |
| AsteriskHighActiveCallsCount | Warning: Asterisk high active call count. |
Metrics
The most important metrics provided by the Asterisk integration, which are used on the pre-built dashboards and Prometheus alerts, are as follows:
- asterisk_bridges_channels_count
- asterisk_bridges_count
- asterisk_calls_count
- asterisk_calls_sum
- asterisk_channels_count
- asterisk_channels_duration_seconds
- asterisk_channels_state
- asterisk_core_last_reload_seconds
- asterisk_core_properties
- asterisk_core_scrape_time_ms
- asterisk_core_uptime_seconds
- asterisk_endpoints_channels_count
- asterisk_endpoints_count
- up
Changelog
# 0.0.5 - September 2023

* New Filter Metrics option for configuring the Grafana Agent, which saves on metrics cost by dropping any metric not used by this integration. Beware that anything custom built using metrics that are not on the snippet will stop working.
* New hostname relabel option, which applies the instance name you write on the text box to the Grafana Agent configuration snippets, making it easier and less error prone to configure this mandatory label.

# 0.0.4 - August 2023

* Add regex filter for logs datasource

# 0.0.3 - February 2023

* Add missing units to panel
* Rename alert summaries based on linting standards

# 0.0.2 - June 2022

* Update mixin to latest version:
  - Fix job variable regex

# 0.0.1 - March 2022

* Initial release
Cost
By connecting your Asterisk instance to Grafana Cloud, you might incur charges. To view information on the number of active series that your Grafana Cloud account uses for metrics included in each Cloud tier, see Active series and dpm usage and Cloud tier pricing.
Was this page helpful?
Related resources from Grafana Labs


