
Apache Solr integration for Grafana Cloud
Apache Solr is an open-source search platform built on Apache Lucene, known for its powerful full-text search, scalability, and real-time indexing capabilities. It supports a wide range of document formats and offers features like faceted search, geospatial search, and rich document handling. The integration with Grafana Cloud enables users to oversee a Solr environment using distinct dashboards. These dashboards display metrics and logs for Solr clusters, query performance, resource monitoring, and logs.
This integration supports Apache Solr 8.11.2 and uses the built in prometheus exporter.
This integration includes 8 useful alerts and 4 pre-built dashboards to help monitor and visualize Apache Solr metrics and logs.
Before you begin
In order for the integration to properly work, it is essential to implement the built-in Prometheus Exporter on each cluster instance.
Initiating the Prometheus Exporter
Initiate the Prometheus Exporter in Apache Solr either in a Standalone or SolrCloud mode by navigating to contrib/prometheus-exporter on your Solr instance and applying relevant command line parameters as demonstrated below.
For Linux, initiate the Prometheus Exporter in SolrCloud mode with:./bin/solr-exporter -p 9854 -z localhost:2181/solr -f ./conf/solr-exporter-config.xml -n 16
For Windows, initiate the Prometheus Exporter in SolrCloud mode with:.\bin\solr-exporter -p 9854 -z localhost:2181/solr -f .\conf\solr-exporter-config.xml -n 16
In cases where SolrCloud mode operates with a ZooKeeper ensemble, set the -z zkhost value as a string zk1,zk2,zk3.
Validate the Prometheus Exporter
Upon activation, the Prometheus Exporter will report the metrics. The full metric list will be shown when there is an active ZooKeeper ensemble setup and a Solr Collection created. To validate that the Prometheus Exporter is setup correctly, the Prometheus metrics are accessible locally via curl:
curl http://localhost:9854/metricsConfigure logs location.
No additional configuration is required for the collection of Apache Solr logs. By default, logs are written to the SOLR_LOGS_DIR, located at /var/solr/logs on Linux or sever/logs on Windows.
Install Apache Solr integration for Grafana Cloud
- In your Grafana Cloud stack, click Connections in the left-hand menu.
- Find Apache Solr and click its tile to open the integration.
- Review the prerequisites in the Configuration Details tab and set up Grafana Agent to send Apache Solr metrics and logs to your Grafana Cloud instance.
- Click Install to add this integration’s pre-built dashboards and alerts to your Grafana Cloud instance, and you can start monitoring your Apache Solr setup.
Configuration snippets for Grafana Alloy
Advanced mode
The following snippets provide examples to guide you through the configuration process.
To instruct Grafana Alloy to scrape your Apache Solr instances, manually copy and append the snippets to your alloy configuration file, then follow subsequent instructions.
Advanced metrics snippets
prometheus.scrape "metrics_integrations_integrations_apache_solr" {
	targets = [{
		__address__  = "localhost:<your-instance-port>",
		solr_cluster = "<your-solr-cluster-name>",
	}]
	forward_to = [prometheus.remote_write.metrics_service.receiver]
	job_name   = "integrations/apache-solr"
}
To monitor your Apache Solr instance, you must use a discovery.relabel component to discover your Apache Solr Prometheus endpoint and apply appropriate labels, followed by a prometheus.scrape component to scrape it.
Configure the following properties within each discovery.relabel component:
__address__: The address to your Apache Solr Prometheus metrics endpoint.instancelabel:constants.hostnamesets theinstancelabel to your Grafana Alloy server hostname. If that is not suitable, change it to a value uniquely identifies this Apache Solr instance. Make sure this label value is the same for all telemetry data collected for this instance.solr_clustermust be the value that identifies the Solr cluster this instance belongs to.
If you have multiple Apache Solr servers to scrape, configure one discovery.relabel for each and scrape them by including each under targets within the prometheus.scrape component.
Advanced logs snippets
darwin
local.file_match "logs_integrations_integrations_apache_solr" {
	path_targets = [{
		__address__  = "localhost",
		__path__     = "/var/solr/logs/*.log",
		instance     = constants.hostname,
		job          = "integrations/apache-solr",
		solr_cluster = "<your-solr-cluster-name>",
	}]
}

loki.process "logs_integrations_integrations_apache_solr" {
	forward_to = [loki.write.grafana_cloud_loki.receiver]

	stage.multiline {
		firstline     = "^\\d{4}-\\d{2}-\\d{2} \\d{2}:\\d{2}:\\d{2}\\.\\d{3}"
		max_lines     = 0
		max_wait_time = "3s"
	}

	stage.regex {
		expression = "^\\d{4}-\\d{2}-\\d{2} \\d{2}:\\d{2}:\\d{2}\\.\\d{3} (?P<level>\\w+)"
	}

	stage.labels {
		values = {
			level = null,
		}
	}
}

loki.source.file "logs_integrations_integrations_apache_solr" {
	targets    = local.file_match.logs_integrations_integrations_apache_solr.targets
	forward_to = [loki.process.logs_integrations_integrations_apache_solr.receiver]
}
To monitor your Apache Solr instance logs, you will use a combination of the following components:
local.file_match defines where to find the log file to be scraped. Change the following properties according to your environment:
__address__: The Apache Solr instance address__path__: is the Solr logs location or whereSOLR_LOGS_DIRis set. By default this value should be either/var/solr/logs/*.logson Linux orsever/logs/*.logson Windows.instancelabel:constants.hostnamesets theinstancelabel to your Grafana Alloy server hostname. If that is not suitable, change it to a value uniquely identifies this Apache Solr instance. Make sure this label value is the same for all telemetry data collected for this instance.solr_clustermust be the value that identifies the Solr cluster this instance belongs to.
loki.process defines how to process logs before sending it to Loki.
loki.source.file sends logs to Loki.
linux
local.file_match "logs_integrations_integrations_apache_solr" {
	path_targets = [{
		__address__  = "localhost",
		__path__     = "/var/solr/logs/*.log",
		instance     = constants.hostname,
		job          = "integrations/apache-solr",
		solr_cluster = "<your-solr-cluster-name>",
	}]
}

loki.process "logs_integrations_integrations_apache_solr" {
	forward_to = [loki.write.grafana_cloud_loki.receiver]

	stage.multiline {
		firstline     = "^\\d{4}-\\d{2}-\\d{2} \\d{2}:\\d{2}:\\d{2}\\.\\d{3}"
		max_lines     = 0
		max_wait_time = "3s"
	}

	stage.regex {
		expression = "^\\d{4}-\\d{2}-\\d{2} \\d{2}:\\d{2}:\\d{2}\\.\\d{3} (?P<level>\\w+)"
	}

	stage.labels {
		values = {
			level = null,
		}
	}
}

loki.source.file "logs_integrations_integrations_apache_solr" {
	targets    = local.file_match.logs_integrations_integrations_apache_solr.targets
	forward_to = [loki.process.logs_integrations_integrations_apache_solr.receiver]
}
To monitor your Apache Solr instance logs, you will use a combination of the following components:
local.file_match defines where to find the log file to be scraped. Change the following properties according to your environment:
__address__: The Apache Solr instance address__path__: is the Solr logs location or whereSOLR_LOGS_DIRis set. By default this value should be either/var/solr/logs/*.logson Linux orsever/logs/*.logson Windows.instancelabel:constants.hostnamesets theinstancelabel to your Grafana Alloy server hostname. If that is not suitable, change it to a value uniquely identifies this Apache Solr instance. Make sure this label value is the same for all telemetry data collected for this instance.solr_clustermust be the value that identifies the Solr cluster this instance belongs to.
loki.process defines how to process logs before sending it to Loki.
loki.source.file sends logs to Loki.
windows
local.file_match "logs_integrations_integrations_apache_solr" {
	path_targets = [{
		__address__  = "localhost",
		__path__     = "/var/solr/logs/*.log",
		instance     = constants.hostname,
		job          = "integrations/apache-solr",
		solr_cluster = "<your-solr-cluster-name>",
	}]
}

loki.process "logs_integrations_integrations_apache_solr" {
	forward_to = [loki.write.grafana_cloud_loki.receiver]

	stage.multiline {
		firstline     = "^\\d{4}-\\d{2}-\\d{2} \\d{2}:\\d{2}:\\d{2}\\.\\d{3}"
		max_lines     = 0
		max_wait_time = "3s"
	}

	stage.regex {
		expression = "^\\d{4}-\\d{2}-\\d{2} \\d{2}:\\d{2}:\\d{2}\\.\\d{3} (?P<level>\\w+)"
	}

	stage.labels {
		values = {
			level = null,
		}
	}
}

loki.source.file "logs_integrations_integrations_apache_solr" {
	targets    = local.file_match.logs_integrations_integrations_apache_solr.targets
	forward_to = [loki.process.logs_integrations_integrations_apache_solr.receiver]
}
To monitor your Apache Solr instance logs, you will use a combination of the following components:
local.file_match defines where to find the log file to be scraped. Change the following properties according to your environment:
__address__: The Apache Solr instance address__path__: is the Solr logs location or whereSOLR_LOGS_DIRis set. By default this value should be either/var/solr/logs/*.logson Linux orsever/logs/*.logson Windows.instancelabel:constants.hostnamesets theinstancelabel to your Grafana Alloy server hostname. If that is not suitable, change it to a value uniquely identifies this Apache Solr instance. Make sure this label value is the same for all telemetry data collected for this instance.solr_clustermust be the value that identifies the Solr cluster this instance belongs to.
loki.process defines how to process logs before sending it to Loki.
loki.source.file sends logs to Loki.
Grafana Agent static configuration (deprecated)
The following section shows configuration for running Grafana Agent in static mode which is deprecated. You should use Grafana Alloy for all new deployments.
Before you begin
In order for the integration to properly work, it is essential to implement the built-in Prometheus Exporter on each cluster instance.
Initiating the Prometheus Exporter
Initiate the Prometheus Exporter in Apache Solr either in a Standalone or SolrCloud mode by navigating to contrib/prometheus-exporter on your Solr instance and applying relevant command line parameters as demonstrated below.
For Linux, initiate the Prometheus Exporter in SolrCloud mode with:./bin/solr-exporter -p 9854 -z localhost:2181/solr -f ./conf/solr-exporter-config.xml -n 16
For Windows, initiate the Prometheus Exporter in SolrCloud mode with:.\bin\solr-exporter -p 9854 -z localhost:2181/solr -f .\conf\solr-exporter-config.xml -n 16
In cases where SolrCloud mode operates with a ZooKeeper ensemble, set the -z zkhost value as a string zk1,zk2,zk3.
Validate the Prometheus Exporter
Upon activation, the Prometheus Exporter will report the metrics. The full metric list will be shown when there is an active ZooKeeper ensemble setup and a Solr Collection created. To validate that the Prometheus Exporter is setup correctly, the Prometheus metrics are accessible locally via curl:
curl http://localhost:9854/metricsConfigure logs location.
No additional configuration is required for the collection of Apache Solr logs. By default, logs are written to the SOLR_LOGS_DIR, located at /var/solr/logs on Linux or sever/logs on Windows.
Install Apache Solr integration for Grafana Cloud
- In your Grafana Cloud stack, click Connections in the left-hand menu.
- Find Apache Solr and click its tile to open the integration.
- Review the prerequisites in the Configuration Details tab and set up Grafana Agent to send Apache Solr metrics and logs to your Grafana Cloud instance.
- Click Install to add this integration’s pre-built dashboards and alerts to your Grafana Cloud instance, and you can start monitoring your Apache Solr setup.
Post-install configuration for the Apache Solr integration
After enabling metric collection through the Prometheus Exporter, instruct the Grafana Agent to scrape these Apache Solr metrics. The Grafana Agent config is stored in the default location for each respective operating system. More documentation for the Grafana Agent can be found here: Grafana Agent documentation.
Enable the integration by adding the suggested snippets to your agent configuration file.
To show show logs and metrics signals correlated in your dashboards as a single pane of glass, ensure the following:
jobandinstancelabel values must match for the Solr integration and logs scrape config in your agent configuration file.jobmust be set tointegrations/apache-solr(already configured in the snippets).instancemust be set to a value that uniquely identifies your Solr instance.solr_clustermust be the value that identifies the Solr cluster this instance belongs to.__path__is the Solr logs location or whereSOLR_LOGS_DIRis set. By default this value should be either/var/solr/logs/*.logson Linux orsever/logs/*.logson Windows.- Make sure to change
targetsin the snippet according to your host name and exposed Prometheus port.
Configuration snippets for Grafana Agent
Below metrics.configs.scrape_configs, insert the following lines and change the URLs according to your environment:
    - job_name: integrations/apache-solr
      metrics_path: /metrics
      static_configs:
        - targets: ["<your-instance-hostname>:<your-instance-port>"]
          labels:
            solr_cluster: '<your-solr-cluster-name>'
Below logs.configs.scrape_configs, insert the following lines according to your environment.
    - job_name: integrations/apache-solr
      static_configs:
        - targets: [localhost]
          labels:
            job: integrations/apache-solr
            instance: '<your-instance-name>'
            solr_cluster: '<your-solr-cluster-name>'
            __path__: /var/solr/logs/*.log
      pipeline_stages:
      - multiline:
          firstline: '^\d{4}-\d{2}-\d{2} \d{2}:\d{2}:\d{2}\.\d{3}'
      - regex:
          expression: '^\d{4}-\d{2}-\d{2} \d{2}:\d{2}:\d{2}\.\d{3} (?P<level>\w+)'
      - labels:
          level:
Full example configuration for Grafana Agent
Refer to the following Grafana Agent configuration for a complete example that contains all the snippets used for the Apache Solr integration. This example also includes metrics that are sent to monitor your Grafana Agent instance.
integrations:
  prometheus_remote_write:
  - basic_auth:
      password: <your_prom_pass>
      username: <your_prom_user>
    url: <your_prom_url>
  agent:
    enabled: true
    relabel_configs:
    - action: replace
      source_labels:
      - agent_hostname
      target_label: instance
    - action: replace
      target_label: job
      replacement: "integrations/agent-check"
    metric_relabel_configs:
    - action: keep
      regex: (prometheus_target_sync_length_seconds_sum|prometheus_target_scrapes_.*|prometheus_target_interval.*|prometheus_sd_discovered_targets|agent_build.*|agent_wal_samples_appended_total|process_start_time_seconds)
      source_labels:
      - __name__
  # Add here any snippet that belongs to the `integrations` section.
  # For a correct indentation, paste snippets copied from Grafana Cloud at the beginning of the line.
logs:
  configs:
  - clients:
    - basic_auth:
        password: <your_loki_pass>
        username: <your_loki_user>
      url: <your_loki_url>
    name: integrations
    positions:
      filename: /tmp/positions.yaml
    scrape_configs:
      # Add here any snippet that belongs to the `logs.configs.scrape_configs` section.
      # For a correct indentation, paste snippets copied from Grafana Cloud at the beginning of the line.
    - job_name: integrations/apache-solr
      static_configs:
        - targets: [localhost]
          labels:
            job: integrations/apache-solr
            instance: '<your-instance-name>'
            solr_cluster: '<your-solr-cluster-name>'
            __path__: /var/solr/logs/*.log
      pipeline_stages:
      - multiline:
          firstline: '^\d{4}-\d{2}-\d{2} \d{2}:\d{2}:\d{2}\.\d{3}'
      - regex:
          expression: '^\d{4}-\d{2}-\d{2} \d{2}:\d{2}:\d{2}\.\d{3} (?P<level>\w+)'
      - labels:
          level:
metrics:
  configs:
  - name: integrations
    remote_write:
    - basic_auth:
        password: <your_prom_pass>
        username: <your_prom_user>
      url: <your_prom_url>
    scrape_configs:
      # Add here any snippet that belongs to the `metrics.configs.scrape_configs` section.
      # For a correct indentation, paste snippets copied from Grafana Cloud at the beginning of the line.
    - job_name: integrations/apache-solr
      metrics_path: /metrics
      static_configs:
        - targets: ["<your-instance-hostname>:<your-instance-port>"]
          labels:
            solr_cluster: '<your-solr-cluster-name>'
  global:
    scrape_interval: 60s
  wal_directory: /tmp/grafana-agent-wal
Dashboards
The Apache Solr integration installs the following dashboards in your Grafana Cloud instance to help monitor your system.
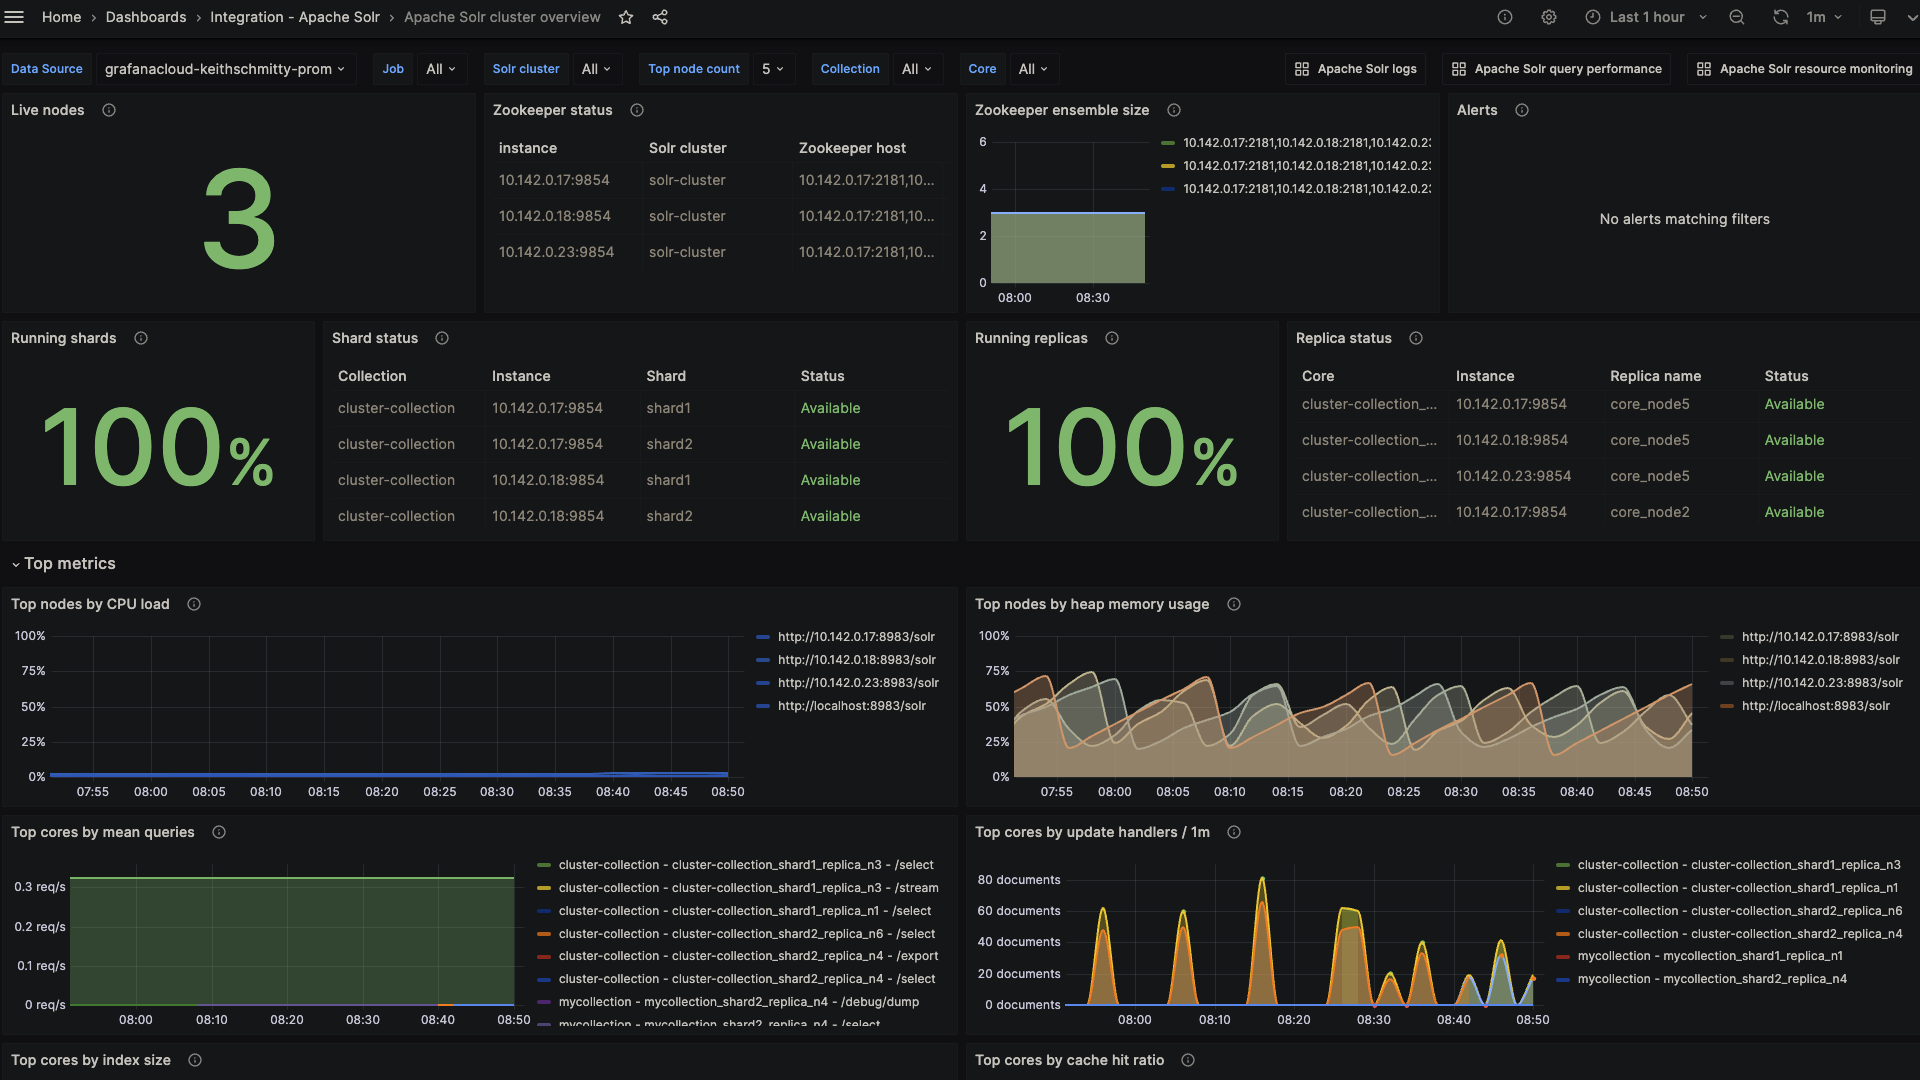
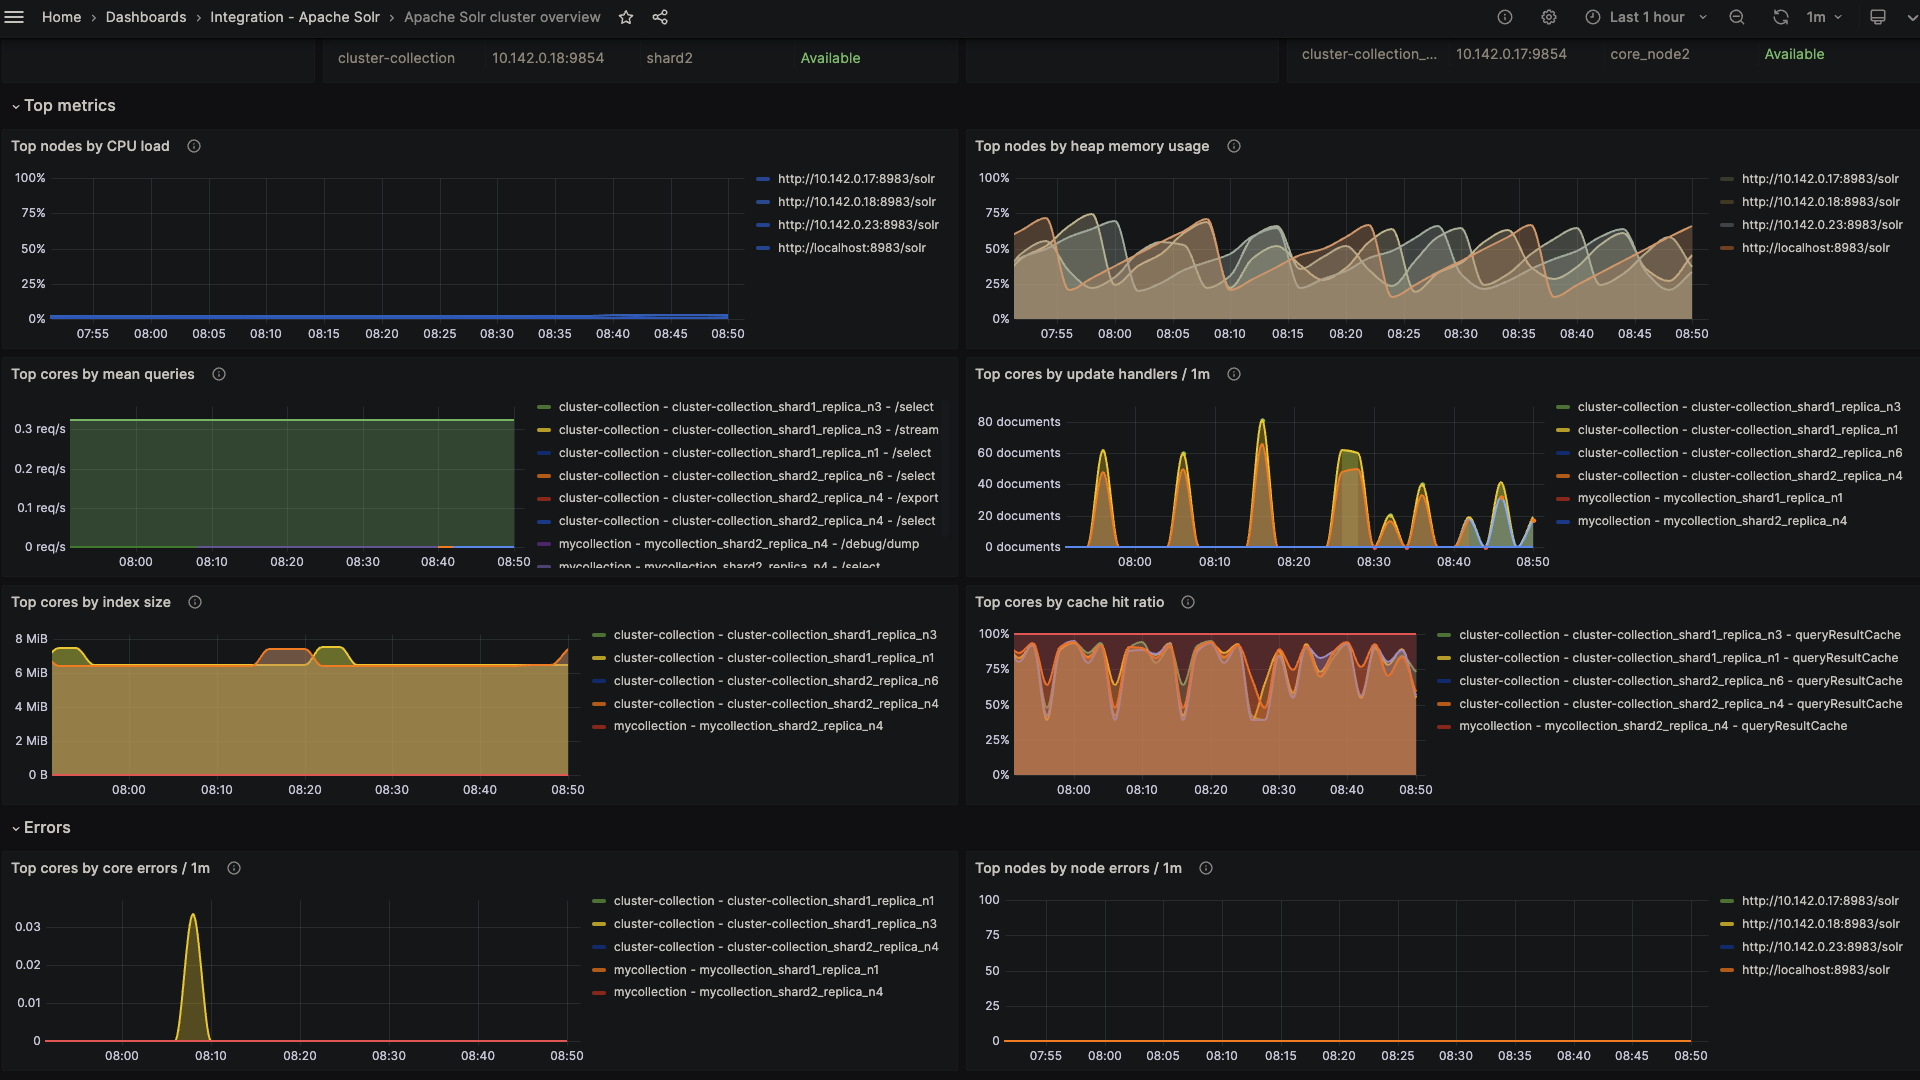
- Apache Solr cluster overview
- Apache Solr logs
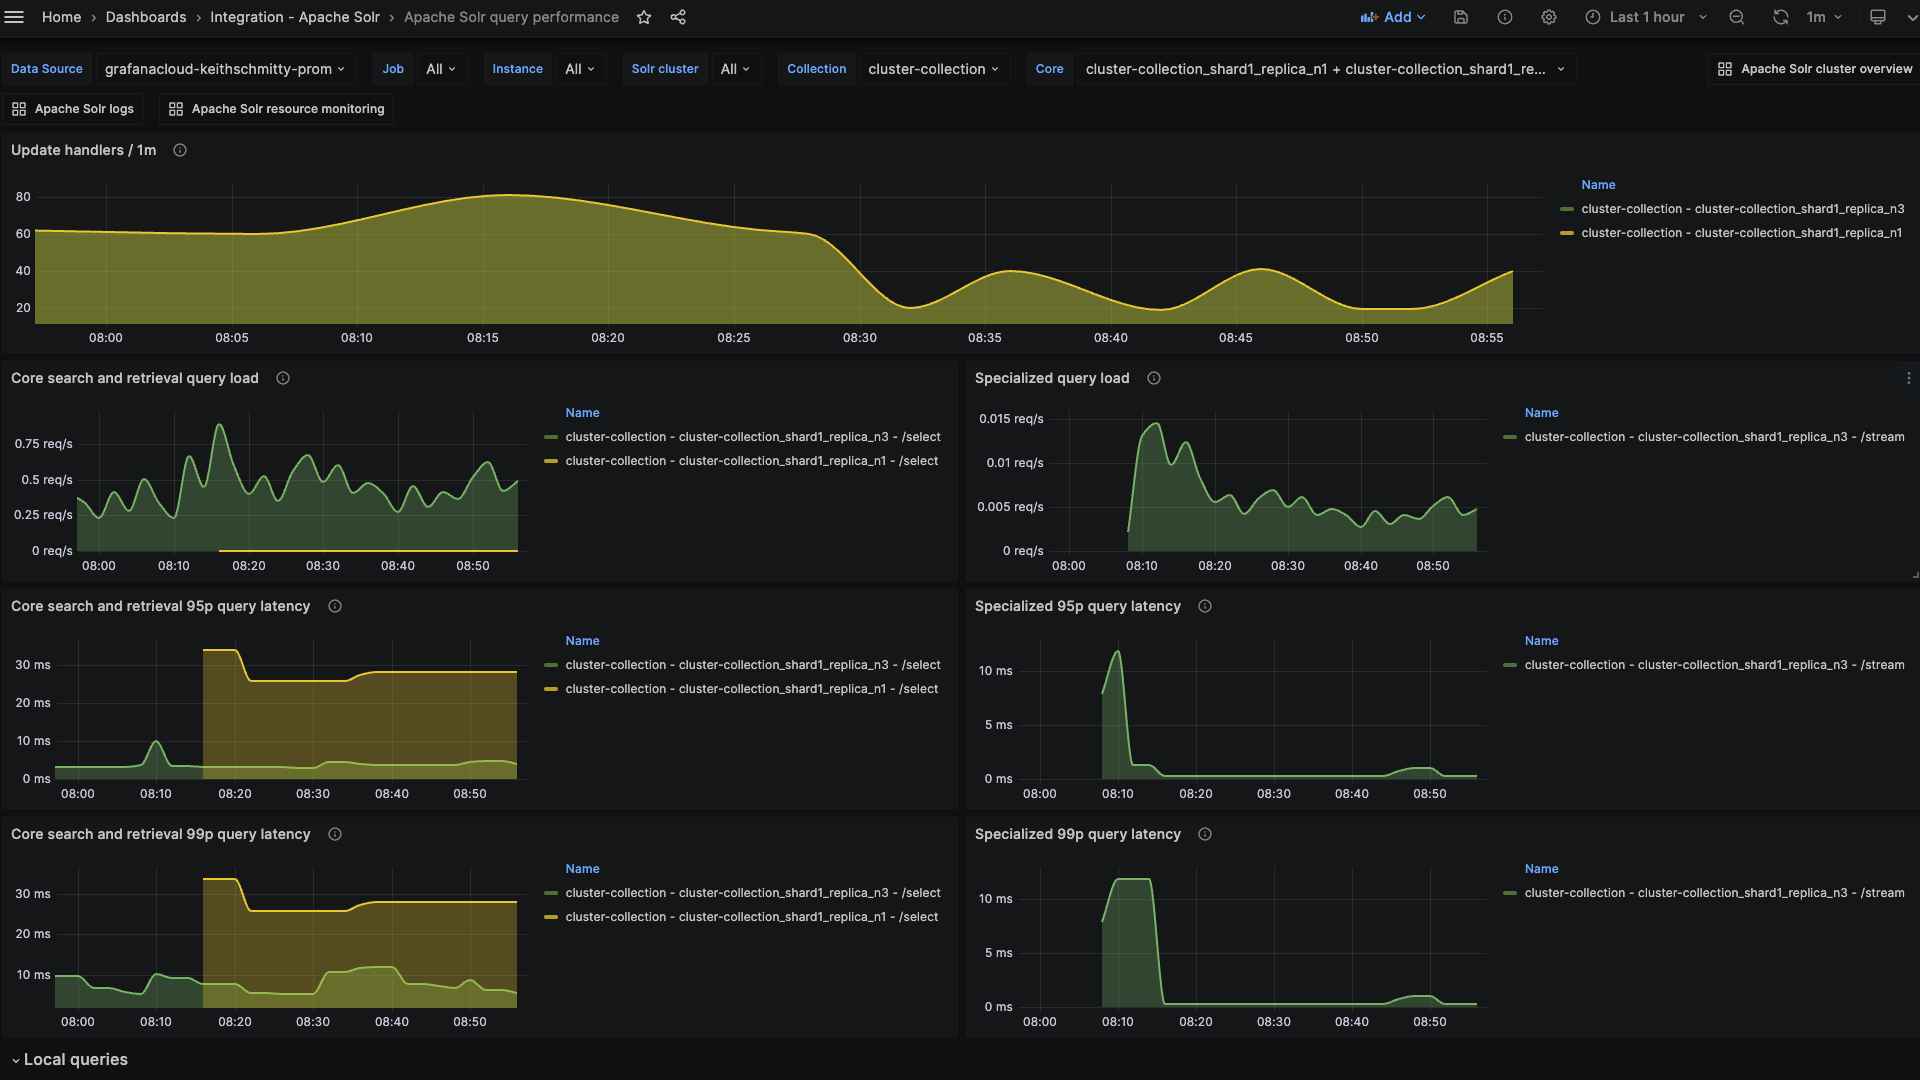
- Apache Solr query performance
- Apache Solr resource monitoring
Apache Solr overview (cluster)
Apache Solr overview (top metrics)
Apache Solr query performance (latency)
Alerts
The Apache Solr integration includes the following useful alerts:
| Alert | Description |
|---|---|
| ApacheSolrZookeeperChangeInEnsembleSize | Warning: Changes in the ZooKeeper ensemble size can affect the stability and performance of the cluster. |
| ApacheSolrHighCPUUsageCritical | Critical: High CPU load can indicate that Solr nodes are under heavy load, potentially impacting performance. |
| ApacheSolrHighCPUUsageWarning | Warning: High CPU load can indicate that Solr nodes are under heavy load, potentially impacting performance. |
| ApacheSolrHighHeapMemoryUsageCritical | Critical: High heap memory usage can lead to garbage collection issues, out-of-memory errors, and overall system instability. |
| ApacheSolrHighHeapMemoryUsageWarning | Warning: High heap memory usage can lead to garbage collection issues, out-of-memory errors, and overall system instability. |
| ApacheSolrLowCacheHitRatio | Warning: Low cache hit ratios can lead to increased disk I/O and slower query response times. |
| ApacheSolrHighCoreErrors | Warning: A spike in core errors can indicate serious issues at the core level, affecting data integrity and availability. |
| ApacheSolrHighDocumentIndexing | Warning: A sudden spike in document indexing could indicate unintended or malicious bulk updates. |
Metrics
The most important metrics provided by the Apache Solr integration, which are used on the pre-built dashboards and Prometheus alerts, are as follows:
- solr_collections_live_nodes
- solr_collections_replica_state
- solr_collections_shard_state
- solr_metrics_core_errors_total
- solr_metrics_core_query_5minRate
- solr_metrics_core_query_client_errors_1minRate
- solr_metrics_core_query_errors_1minRate
- solr_metrics_core_query_local_5minRate
- solr_metrics_core_query_local_p95_ms
- solr_metrics_core_query_local_p99_ms
- solr_metrics_core_query_p95_ms
- solr_metrics_core_query_p99_ms
- solr_metrics_core_searcher_cache
- solr_metrics_core_searcher_cache_ratio
- solr_metrics_core_timeouts_total
- solr_metrics_core_update_handler_adds_total
- solr_metrics_jetty_dispatches_total
- solr_metrics_jetty_requests_total
- solr_metrics_jetty_response_total
- solr_metrics_jvm_gc_seconds_total
- solr_metrics_jvm_gc_total
- solr_metrics_jvm_memory_heap_bytes
- solr_metrics_jvm_memory_non_heap_bytes
- solr_metrics_jvm_os_cpu_load
- solr_metrics_jvm_os_file_descriptors
- solr_metrics_jvm_os_memory_bytes
- solr_metrics_node_connections
- solr_metrics_node_core_root_fs_bytes
- solr_metrics_node_thread_pool_completed_total
- solr_metrics_node_thread_pool_submitted_total
- solr_metrics_node_timeouts_total
- solr_zookeeper_ensemble_size
- solr_zookeeper_status
- up
Changelog
# 1.0.1 - February 2024

* Fix alerts to trigger properly

# 1.0.0 - January 2024

- Initial release
Cost
By connecting your Apache Solr instance to Grafana Cloud, you might incur charges. To view information on the number of active series that your Grafana Cloud account uses for metrics included in each Cloud tier, see Active series and dpm usage and Cloud tier pricing.
Was this page helpful?
Related resources from Grafana Labs


