
Apache HTTP server integration for Grafana Cloud
Apache HTTP server integration is an observability package of dashboards and alerts filled with metrics and logs.
This integration includes 5 useful alerts and 2 pre-built dashboards to help monitor and visualize Apache HTTP server metrics and logs.
Before you begin
Metrics are scraped from server-status page.
To enable it, add this code to your httpd.conf configuration file
<Location "/server-status">
    SetHandler server-status
</Location>
For more information please check the official guide.
Install Apache HTTP server integration for Grafana Cloud
- In your Grafana Cloud stack, click Connections in the left-hand menu.
- Find Apache HTTP server and click its tile to open the integration.
- Review the prerequisites in the Configuration Details tab and set up Grafana Agent to send Apache HTTP server metrics and logs to your Grafana Cloud instance.
- Click Install to add this integration’s pre-built dashboards and alerts to your Grafana Cloud instance, and you can start monitoring your Apache HTTP server setup.
Configuration snippets for Grafana Alloy
Simple mode
These snippets are configured to scrape a single Apache HTTP server instance running locally with default ports.
First, manually copy and append the following snippets into your alloy configuration file.
Integrations snippets
prometheus.exporter.self "integrations_alloy" { }

discovery.relabel "integrations_alloy" {
	targets = prometheus.exporter.self.integrations_alloy.targets

	rule {
		target_label = "job"
		replacement  = "integrations/agent"
	}
}

prometheus.scrape "integrations_alloy" {
	targets    = discovery.relabel.integrations_alloy.output
	forward_to = [prometheus.relabel.integrations_alloy.receiver]
	job_name   = "integrations/alloy"
}

prometheus.relabel "integrations_alloy" {
	forward_to = [prometheus.remote_write.metrics_service.receiver]

	rule {
		source_labels = ["exported_job"]
		target_label  = "job"
	}

	rule {
		source_labels = ["exported_instance"]
		target_label  = "instance"
	}

	rule {
		regex  = "(exported_instance|exported_job)"
		action = "labeldrop"
	}
}

prometheus.exporter.apache "integrations_apache_http" {
	scrape_uri = "http://localhost:8080/server-status?auto"
}

discovery.relabel "integrations_apache_http" {
	targets = prometheus.exporter.apache.integrations_apache_http.targets

	rule {
		target_label = "instance"
		replacement  = constants.hostname
	}

	rule {
		target_label = "job"
		replacement  = "integrations/apache_http"
	}
}

prometheus.scrape "integrations_apache_http" {
	targets    = discovery.relabel.integrations_apache_http.output
	forward_to = [prometheus.remote_write.metrics_service.receiver]
	job_name   = "integrations/apache_http"
}
Logs snippets
darwin
local.file_match "logs_integrations_integrations_apache_error" {
	path_targets = [{
		__address__ = "localhost",
		__path__    = "/var/log/apache2/error.log",
		instance    = constants.hostname,
		job         = "integrations/apache_http",
	}]
}

loki.process "logs_integrations_integrations_apache_error" {
	forward_to = []

	stage.regex {
		expression = "^\\[[^ ]* (?P<timestamp>[^\\]]*)\\] \\[(?:(?P<module>[^:\\]]+):)?(?P<level>[^\\]]+)\\](?: \\[pid (?P<pid>[^\\]]*)\\])?(?: \\[client (?P<client>[^\\]]*)\\])? (?P<message>.*)$"
	}

	stage.labels {
		values = {
			level  = null,
			module = null,
		}
	}

	stage.static_labels {
		values = {
			logtype = "error",
		}
	}
}

loki.source.file "logs_integrations_integrations_apache_error" {
	targets    = local.file_match.logs_integrations_integrations_apache_error.targets
	forward_to = [loki.write.grafana_cloud_loki.receiver]
}

local.file_match "logs_integrations_integrations_apache_access" {
	path_targets = [{
		__address__ = "localhost",
		__path__    = "/var/log/apache2/access.log",
		instance    = constants.hostname,
		job         = "integrations/apache_http",
	}]
}

loki.process "logs_integrations_integrations_apache_access" {
	forward_to = [loki.write.grafana_cloud_loki.receiver]

	stage.regex {
		expression = "^(?P<ip>[^ ]*) [^ ]* (?P<user>[^ ]*) \\[(?P<timestamp>[^\\]]*)\\] \"(?P<method>\\S+)(?: +(?P<path>[^ ]*) +\\S*)?\" (?P<code>[^ ]*) (?P<size>[^ ]*)(?: \"(?P<referer>[^\\\"]*)\" \"(?P<agent>.*)\")?$"
	}

	stage.metrics { }

	stage.labels {
		values = {
			method = null,
		}
	}

	stage.static_labels {
		values = {
			logtype = "access",
		}
	}
}

loki.source.file "logs_integrations_integrations_apache_access" {
	targets    = local.file_match.logs_integrations_integrations_apache_access.targets
	forward_to = [loki.process.logs_integrations_integrations_apache_access.receiver]
}
linux
local.file_match "logs_integrations_integrations_apache_error" {
	path_targets = [{
		__address__ = "localhost",
		__path__    = "/var/log/apache2/error.log",
		instance    = constants.hostname,
		job         = "integrations/apache_http",
	}]
}

loki.process "logs_integrations_integrations_apache_error" {
	forward_to = []

	stage.regex {
		expression = "^\\[[^ ]* (?P<timestamp>[^\\]]*)\\] \\[(?:(?P<module>[^:\\]]+):)?(?P<level>[^\\]]+)\\](?: \\[pid (?P<pid>[^\\]]*)\\])?(?: \\[client (?P<client>[^\\]]*)\\])? (?P<message>.*)$"
	}

	stage.labels {
		values = {
			level  = null,
			module = null,
		}
	}

	stage.static_labels {
		values = {
			logtype = "error",
		}
	}
}

loki.source.file "logs_integrations_integrations_apache_error" {
	targets    = local.file_match.logs_integrations_integrations_apache_error.targets
	forward_to = [loki.write.grafana_cloud_loki.receiver]
}

local.file_match "logs_integrations_integrations_apache_access" {
	path_targets = [{
		__address__ = "localhost",
		__path__    = "/var/log/apache2/access.log",
		instance    = constants.hostname,
		job         = "integrations/apache_http",
	}]
}

loki.process "logs_integrations_integrations_apache_access" {
	forward_to = [loki.write.grafana_cloud_loki.receiver]

	stage.regex {
		expression = "^(?P<ip>[^ ]*) [^ ]* (?P<user>[^ ]*) \\[(?P<timestamp>[^\\]]*)\\] \"(?P<method>\\S+)(?: +(?P<path>[^ ]*) +\\S*)?\" (?P<code>[^ ]*) (?P<size>[^ ]*)(?: \"(?P<referer>[^\\\"]*)\" \"(?P<agent>.*)\")?$"
	}

	stage.metrics { }

	stage.labels {
		values = {
			method = null,
		}
	}

	stage.static_labels {
		values = {
			logtype = "access",
		}
	}
}

loki.source.file "logs_integrations_integrations_apache_access" {
	targets    = local.file_match.logs_integrations_integrations_apache_access.targets
	forward_to = [loki.process.logs_integrations_integrations_apache_access.receiver]
}
windows
local.file_match "logs_integrations_integrations_apache_error" {
	path_targets = [{
		__address__ = "localhost",
		__path__    = "/var/log/apache2/error.log",
		instance    = constants.hostname,
		job         = "integrations/apache_http",
	}]
}

loki.process "logs_integrations_integrations_apache_error" {
	forward_to = []

	stage.regex {
		expression = "^\\[[^ ]* (?P<timestamp>[^\\]]*)\\] \\[(?:(?P<module>[^:\\]]+):)?(?P<level>[^\\]]+)\\](?: \\[pid (?P<pid>[^\\]]*)\\])?(?: \\[client (?P<client>[^\\]]*)\\])? (?P<message>.*)$"
	}

	stage.labels {
		values = {
			level  = null,
			module = null,
		}
	}

	stage.static_labels {
		values = {
			logtype = "error",
		}
	}
}

loki.source.file "logs_integrations_integrations_apache_error" {
	targets    = local.file_match.logs_integrations_integrations_apache_error.targets
	forward_to = [loki.write.grafana_cloud_loki.receiver]
}

local.file_match "logs_integrations_integrations_apache_access" {
	path_targets = [{
		__address__ = "localhost",
		__path__    = "/var/log/apache2/access.log",
		instance    = constants.hostname,
		job         = "integrations/apache_http",
	}]
}

loki.process "logs_integrations_integrations_apache_access" {
	forward_to = [loki.write.grafana_cloud_loki.receiver]

	stage.regex {
		expression = "^(?P<ip>[^ ]*) [^ ]* (?P<user>[^ ]*) \\[(?P<timestamp>[^\\]]*)\\] \"(?P<method>\\S+)(?: +(?P<path>[^ ]*) +\\S*)?\" (?P<code>[^ ]*) (?P<size>[^ ]*)(?: \"(?P<referer>[^\\\"]*)\" \"(?P<agent>.*)\")?$"
	}

	stage.metrics { }

	stage.labels {
		values = {
			method = null,
		}
	}

	stage.static_labels {
		values = {
			logtype = "access",
		}
	}
}

loki.source.file "logs_integrations_integrations_apache_access" {
	targets    = local.file_match.logs_integrations_integrations_apache_access.targets
	forward_to = [loki.process.logs_integrations_integrations_apache_access.receiver]
}
Advanced mode
The following snippets provide examples to guide you through the configuration process.
To instruct Grafana Alloy to scrape your Apache HTTP server instances, manually copy and append the snippets to your alloy configuration file, then follow subsequent instructions.
Advanced integrations snippets
prometheus.exporter.self "integrations_alloy" { }

discovery.relabel "integrations_alloy" {
	targets = prometheus.exporter.self.integrations_alloy.targets

	rule {
		target_label = "job"
		replacement  = "integrations/agent"
	}
}

prometheus.scrape "integrations_alloy" {
	targets    = discovery.relabel.integrations_alloy.output
	forward_to = [prometheus.relabel.integrations_alloy.receiver]
	job_name   = "integrations/alloy"
}

prometheus.relabel "integrations_alloy" {
	forward_to = [prometheus.remote_write.metrics_service.receiver]

	rule {
		source_labels = ["exported_job"]
		target_label  = "job"
	}

	rule {
		source_labels = ["exported_instance"]
		target_label  = "instance"
	}

	rule {
		regex  = "(exported_instance|exported_job)"
		action = "labeldrop"
	}
}

prometheus.exporter.apache "integrations_apache_http" {
	scrape_uri = "http://localhost:8080/server-status?auto"
}

discovery.relabel "integrations_apache_http" {
	targets = prometheus.exporter.apache.integrations_apache_http.targets

	rule {
		target_label = "instance"
		replacement  = constants.hostname
	}

	rule {
		target_label = "job"
		replacement  = "integrations/apache_http"
	}
}

prometheus.scrape "integrations_apache_http" {
	targets    = discovery.relabel.integrations_apache_http.output
	forward_to = [prometheus.remote_write.metrics_service.receiver]
	job_name   = "integrations/apache_http"
}
This integrations uses the prometheus.exporter.apache component to generate metrics from a Apache HTTP server instance.
For the full array of configuration options, refer to the prometheus.exporter.apache component reference documentation.
This exporter must be linked with a discovery.relabel component to apply the necessary relabelings.
For each Apache HTTP server instance to be monitored you must create a pair of these components.
Configure the following properties within each discovery.relabel component:
instancelabel:constants.hostnamesets theinstancelabel to your Grafana Alloy server hostname. If that is not suitable, change it to a value uniquely identifies this Apache HTTP server instance. Make sure this label value is the same for all telemetry data collected for this instance.
You can then scrape them by including each discovery.relabel under targets within the prometheus.scrape component.
Advanced logs snippets
darwin
local.file_match "logs_integrations_integrations_apache_error" {
	path_targets = [{
		__address__ = "localhost",
		__path__    = "/var/log/apache2/error.log",
		instance    = constants.hostname,
		job         = "integrations/apache_http",
	}]
}

loki.process "logs_integrations_integrations_apache_error" {
	forward_to = []

	stage.regex {
		expression = "^\\[[^ ]* (?P<timestamp>[^\\]]*)\\] \\[(?:(?P<module>[^:\\]]+):)?(?P<level>[^\\]]+)\\](?: \\[pid (?P<pid>[^\\]]*)\\])?(?: \\[client (?P<client>[^\\]]*)\\])? (?P<message>.*)$"
	}

	stage.labels {
		values = {
			level  = null,
			module = null,
		}
	}

	stage.static_labels {
		values = {
			logtype = "error",
		}
	}
}

loki.source.file "logs_integrations_integrations_apache_error" {
	targets    = local.file_match.logs_integrations_integrations_apache_error.targets
	forward_to = [loki.write.grafana_cloud_loki.receiver]
}

local.file_match "logs_integrations_integrations_apache_access" {
	path_targets = [{
		__address__ = "localhost",
		__path__    = "/var/log/apache2/access.log",
		instance    = constants.hostname,
		job         = "integrations/apache_http",
	}]
}

loki.process "logs_integrations_integrations_apache_access" {
	forward_to = [loki.write.grafana_cloud_loki.receiver]

	stage.regex {
		expression = "^(?P<ip>[^ ]*) [^ ]* (?P<user>[^ ]*) \\[(?P<timestamp>[^\\]]*)\\] \"(?P<method>\\S+)(?: +(?P<path>[^ ]*) +\\S*)?\" (?P<code>[^ ]*) (?P<size>[^ ]*)(?: \"(?P<referer>[^\\\"]*)\" \"(?P<agent>.*)\")?$"
	}

	stage.metrics { }

	stage.labels {
		values = {
			method = null,
		}
	}

	stage.static_labels {
		values = {
			logtype = "access",
		}
	}
}

loki.source.file "logs_integrations_integrations_apache_access" {
	targets    = local.file_match.logs_integrations_integrations_apache_access.targets
	forward_to = [loki.process.logs_integrations_integrations_apache_access.receiver]
}
linux
local.file_match "logs_integrations_integrations_apache_error" {
	path_targets = [{
		__address__ = "localhost",
		__path__    = "/var/log/apache2/error.log",
		instance    = constants.hostname,
		job         = "integrations/apache_http",
	}]
}

loki.process "logs_integrations_integrations_apache_error" {
	forward_to = []

	stage.regex {
		expression = "^\\[[^ ]* (?P<timestamp>[^\\]]*)\\] \\[(?:(?P<module>[^:\\]]+):)?(?P<level>[^\\]]+)\\](?: \\[pid (?P<pid>[^\\]]*)\\])?(?: \\[client (?P<client>[^\\]]*)\\])? (?P<message>.*)$"
	}

	stage.labels {
		values = {
			level  = null,
			module = null,
		}
	}

	stage.static_labels {
		values = {
			logtype = "error",
		}
	}
}

loki.source.file "logs_integrations_integrations_apache_error" {
	targets    = local.file_match.logs_integrations_integrations_apache_error.targets
	forward_to = [loki.write.grafana_cloud_loki.receiver]
}

local.file_match "logs_integrations_integrations_apache_access" {
	path_targets = [{
		__address__ = "localhost",
		__path__    = "/var/log/apache2/access.log",
		instance    = constants.hostname,
		job         = "integrations/apache_http",
	}]
}

loki.process "logs_integrations_integrations_apache_access" {
	forward_to = [loki.write.grafana_cloud_loki.receiver]

	stage.regex {
		expression = "^(?P<ip>[^ ]*) [^ ]* (?P<user>[^ ]*) \\[(?P<timestamp>[^\\]]*)\\] \"(?P<method>\\S+)(?: +(?P<path>[^ ]*) +\\S*)?\" (?P<code>[^ ]*) (?P<size>[^ ]*)(?: \"(?P<referer>[^\\\"]*)\" \"(?P<agent>.*)\")?$"
	}

	stage.metrics { }

	stage.labels {
		values = {
			method = null,
		}
	}

	stage.static_labels {
		values = {
			logtype = "access",
		}
	}
}

loki.source.file "logs_integrations_integrations_apache_access" {
	targets    = local.file_match.logs_integrations_integrations_apache_access.targets
	forward_to = [loki.process.logs_integrations_integrations_apache_access.receiver]
}
windows
local.file_match "logs_integrations_integrations_apache_error" {
	path_targets = [{
		__address__ = "localhost",
		__path__    = "/var/log/apache2/error.log",
		instance    = constants.hostname,
		job         = "integrations/apache_http",
	}]
}

loki.process "logs_integrations_integrations_apache_error" {
	forward_to = []

	stage.regex {
		expression = "^\\[[^ ]* (?P<timestamp>[^\\]]*)\\] \\[(?:(?P<module>[^:\\]]+):)?(?P<level>[^\\]]+)\\](?: \\[pid (?P<pid>[^\\]]*)\\])?(?: \\[client (?P<client>[^\\]]*)\\])? (?P<message>.*)$"
	}

	stage.labels {
		values = {
			level  = null,
			module = null,
		}
	}

	stage.static_labels {
		values = {
			logtype = "error",
		}
	}
}

loki.source.file "logs_integrations_integrations_apache_error" {
	targets    = local.file_match.logs_integrations_integrations_apache_error.targets
	forward_to = [loki.write.grafana_cloud_loki.receiver]
}

local.file_match "logs_integrations_integrations_apache_access" {
	path_targets = [{
		__address__ = "localhost",
		__path__    = "/var/log/apache2/access.log",
		instance    = constants.hostname,
		job         = "integrations/apache_http",
	}]
}

loki.process "logs_integrations_integrations_apache_access" {
	forward_to = [loki.write.grafana_cloud_loki.receiver]

	stage.regex {
		expression = "^(?P<ip>[^ ]*) [^ ]* (?P<user>[^ ]*) \\[(?P<timestamp>[^\\]]*)\\] \"(?P<method>\\S+)(?: +(?P<path>[^ ]*) +\\S*)?\" (?P<code>[^ ]*) (?P<size>[^ ]*)(?: \"(?P<referer>[^\\\"]*)\" \"(?P<agent>.*)\")?$"
	}

	stage.metrics { }

	stage.labels {
		values = {
			method = null,
		}
	}

	stage.static_labels {
		values = {
			logtype = "access",
		}
	}
}

loki.source.file "logs_integrations_integrations_apache_access" {
	targets    = local.file_match.logs_integrations_integrations_apache_access.targets
	forward_to = [loki.process.logs_integrations_integrations_apache_access.receiver]
}
Grafana Agent static configuration (deprecated)
The following section shows configuration for running Grafana Agent in static mode which is deprecated. You should use Grafana Alloy for all new deployments.
Before you begin
Metrics are scraped from server-status page.
To enable it, add this code to your httpd.conf configuration file
<Location "/server-status">
    SetHandler server-status
</Location>
For more information please check the official guide.
Install Apache HTTP server integration for Grafana Cloud
- In your Grafana Cloud stack, click Connections in the left-hand menu.
- Find Apache HTTP server and click its tile to open the integration.
- Review the prerequisites in the Configuration Details tab and set up Grafana Agent to send Apache HTTP server metrics and logs to your Grafana Cloud instance.
- Click Install to add this integration’s pre-built dashboards and alerts to your Grafana Cloud instance, and you can start monitoring your Apache HTTP server setup.
Post-install configuration for the Apache HTTP server integration
After enabling the metrics generation, instruct Grafana Agent to scrape your Apache HTTP nodes.
Apache HTTP exposes a /server-status?auto endpoint. To scrape it, add the snippets above to your agent configuration file.
This integration supports metrics and logs from Apache HTTP server. If you want to see your logs and metrics correlated on your dashboards, as a single pane of glass, do the following:
jobandinstancelabel values must match forapache_httpintegration andlogsscrape config in the agent configuration file.joblabel must be set tointegrations/apache_http(already configured in the snippets)instancelabel must be set to a value that uniquely identifies your Apache Http Node. Replace<yourhostname>in the snippets with a value appropriate to your environment.
Make sure to change targets in the snippet according to your environment.
Logs are scraped from access.log and error.log files. Make sure to point the agent to these locations.
Configuration snippets for Grafana Agent
This integration relies on the Agent exporter, which is provided by default (with a reduced set of metrics) when you installed Grafana Agent.
Replace the existing agent entry with the one provided here.
Below integrations, insert the following lines, following the instructions above:
  apache_http:
    enabled: true
    instance: '<your-instance-name>'
    # job is integrations/apache_http by default
    scrape_uri: 'http://localhost:8080/server-status?auto'
  agent:
    enabled: true
    metric_relabel_configs:
    # required for apache integration.
    # scraping agent endpoint is required for apache histogram metric collection.
      - source_labels: [exported_job]
        target_label: job
      - source_labels: [exported_instance]
        target_label: instance
      - regex: (exported_instance|exported_job)
        action: labeldrop
Below logs.configs.scrape_configs, insert the following lines according to your environment.
    - job_name: integrations/apache_error
      static_configs:
      - targets:
        - localhost
        labels:
          __path__: /var/log/apache2/error.log
          job: integrations/apache_http
          instance: '<your-instance-name>'
      pipeline_stages:
        - regex:
            expression: '^\[[^ ]* (?P<timestamp>[^\]]*)\] \[(?:(?P<module>[^:\]]+):)?(?P<level>[^\]]+)\](?: \[pid (?P<pid>[^\]]*)\])?(?: \[client (?P<client>[^\]]*)\])? (?P<message>.*)$'
        - labels:
            module:
            level:
        - static_labels:
            logtype: error
    - job_name: integrations/apache_access
      static_configs:
      - targets:
        - localhost
        labels:
          __path__: /var/log/apache2/access.log
          job: integrations/apache_http
          instance: '<your-instance-name>'
      pipeline_stages:
        - regex:
            expression: '^(?P<ip>[^ ]*) [^ ]* (?P<user>[^ ]*) \[(?P<timestamp>[^\]]*)\] "(?P<method>\S+)(?: +(?P<path>[^ ]*) +\S*)?" (?P<code>[^ ]*) (?P<size>[^ ]*)(?: "(?P<referer>[^\"]*)" "(?P<agent>.*)")?$'
        - metrics:
            response_http_codes:
              type: Histogram
              description: "Apache responses by HTTP codes"
              prefix: apache_
              source: code
              config:
                buckets: [199,299,399,499,599]
        - labels:
            method:
        - static_labels:
            logtype: access
Full example configuration for Grafana Agent
Refer to the following Grafana Agent configuration for a complete example that contains all the snippets used for the Apache HTTP server integration. This example also includes metrics that are sent to monitor your Grafana Agent instance.
integrations:
  prometheus_remote_write:
  - basic_auth:
      password: <your_prom_pass>
      username: <your_prom_user>
    url: <your_prom_url>
  # Add here any snippet that belongs to the `integrations` section.
  # For a correct indentation, paste snippets copied from Grafana Cloud at the beginning of the line.
  apache_http:
    enabled: true
    instance: '<your-instance-name>'
    # job is integrations/apache_http by default
    scrape_uri: 'http://localhost:8080/server-status?auto'
  agent:
    enabled: true
    metric_relabel_configs:
    # required for apache integration.
    # scraping agent endpoint is required for apache histogram metric collection.
      - source_labels: [exported_job]
        target_label: job
      - source_labels: [exported_instance]
        target_label: instance
      - regex: (exported_instance|exported_job)
        action: labeldrop
logs:
  configs:
  - clients:
    - basic_auth:
        password: <your_loki_pass>
        username: <your_loki_user>
      url: <your_loki_url>
    name: integrations
    positions:
      filename: /tmp/positions.yaml
    scrape_configs:
      # Add here any snippet that belongs to the `logs.configs.scrape_configs` section.
      # For a correct indentation, paste snippets copied from Grafana Cloud at the beginning of the line.
    - job_name: integrations/apache_error
      static_configs:
      - targets:
        - localhost
        labels:
          __path__: /var/log/apache2/error.log
          job: integrations/apache_http
          instance: '<your-instance-name>'
      pipeline_stages:
        - regex:
            expression: '^\[[^ ]* (?P<timestamp>[^\]]*)\] \[(?:(?P<module>[^:\]]+):)?(?P<level>[^\]]+)\](?: \[pid (?P<pid>[^\]]*)\])?(?: \[client (?P<client>[^\]]*)\])? (?P<message>.*)$'
        - labels:
            module:
            level:
        - static_labels:
            logtype: error
    - job_name: integrations/apache_access
      static_configs:
      - targets:
        - localhost
        labels:
          __path__: /var/log/apache2/access.log
          job: integrations/apache_http
          instance: '<your-instance-name>'
      pipeline_stages:
        - regex:
            expression: '^(?P<ip>[^ ]*) [^ ]* (?P<user>[^ ]*) \[(?P<timestamp>[^\]]*)\] "(?P<method>\S+)(?: +(?P<path>[^ ]*) +\S*)?" (?P<code>[^ ]*) (?P<size>[^ ]*)(?: "(?P<referer>[^\"]*)" "(?P<agent>.*)")?$'
        - metrics:
            response_http_codes:
              type: Histogram
              description: "Apache responses by HTTP codes"
              prefix: apache_
              source: code
              config:
                buckets: [199,299,399,499,599]
        - labels:
            method:
        - static_labels:
            logtype: access
metrics:
  configs:
  - name: integrations
    remote_write:
    - basic_auth:
        password: <your_prom_pass>
        username: <your_prom_user>
      url: <your_prom_url>
    scrape_configs:
      # Add here any snippet that belongs to the `metrics.configs.scrape_configs` section.
      # For a correct indentation, paste snippets copied from Grafana Cloud at the beginning of the line.
  global:
    scrape_interval: 60s
  wal_directory: /tmp/grafana-agent-wal
Dashboards
The Apache HTTP server integration installs the following dashboards in your Grafana Cloud instance to help monitor your system.
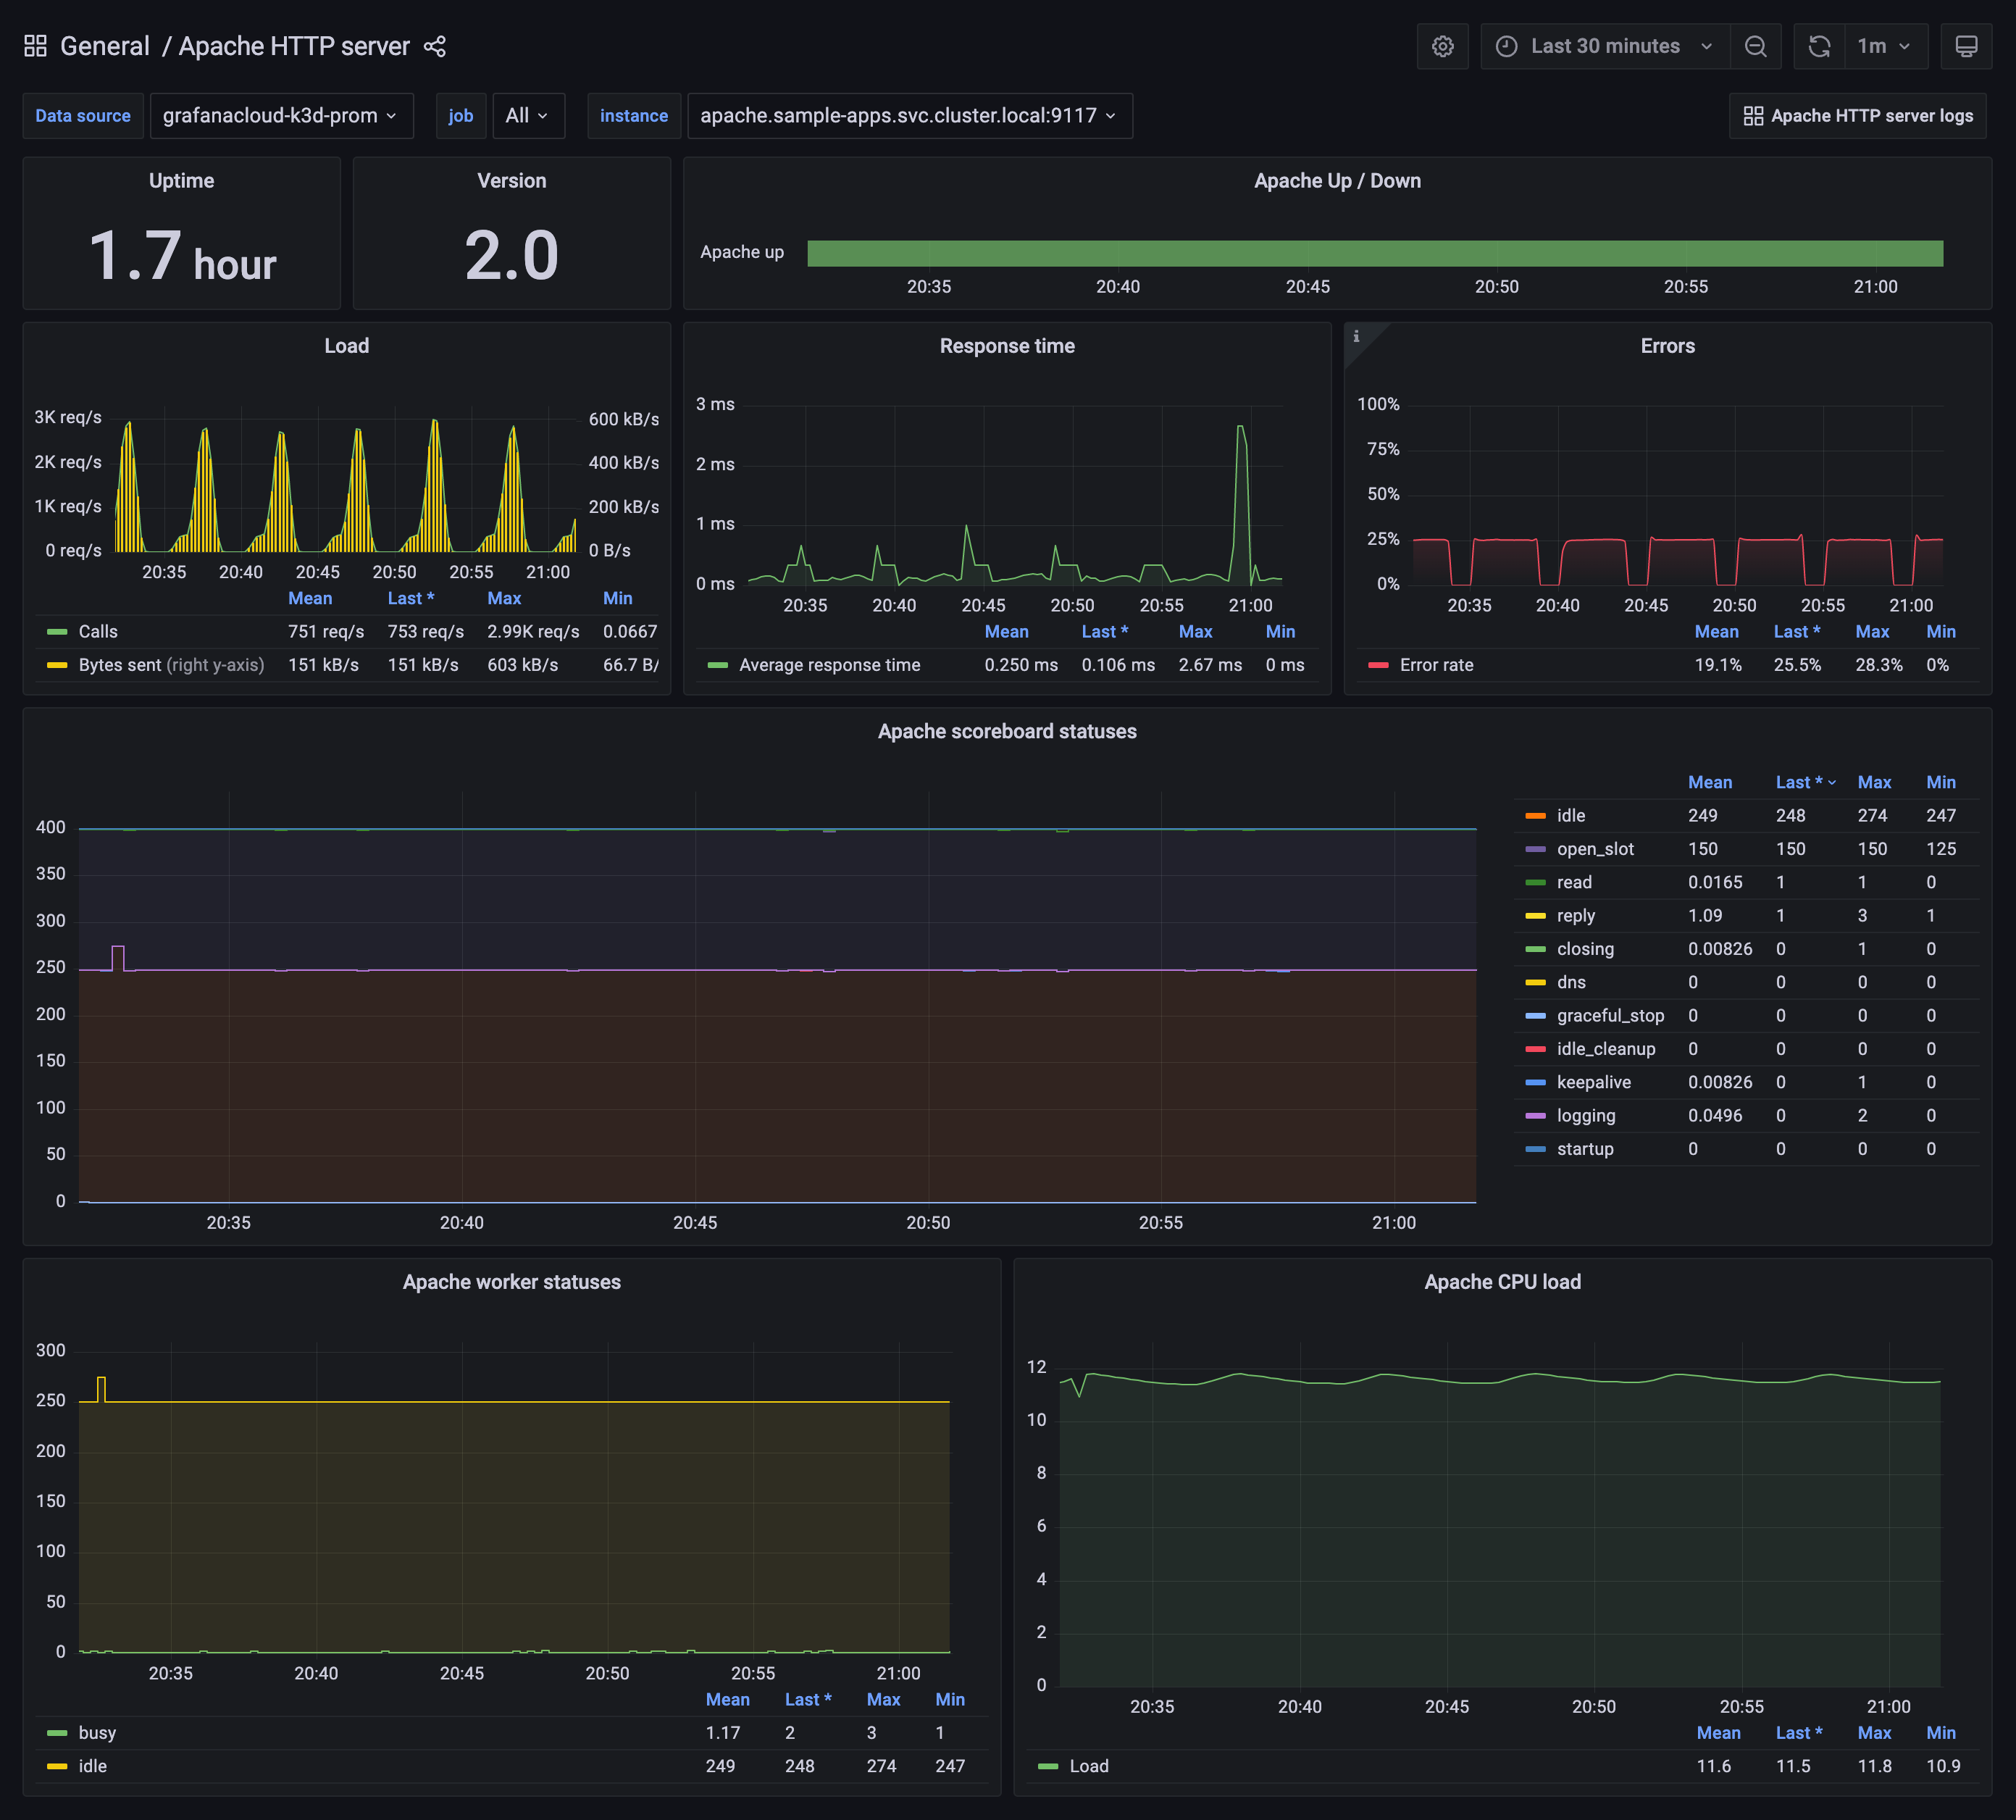
- Apache HTTP server
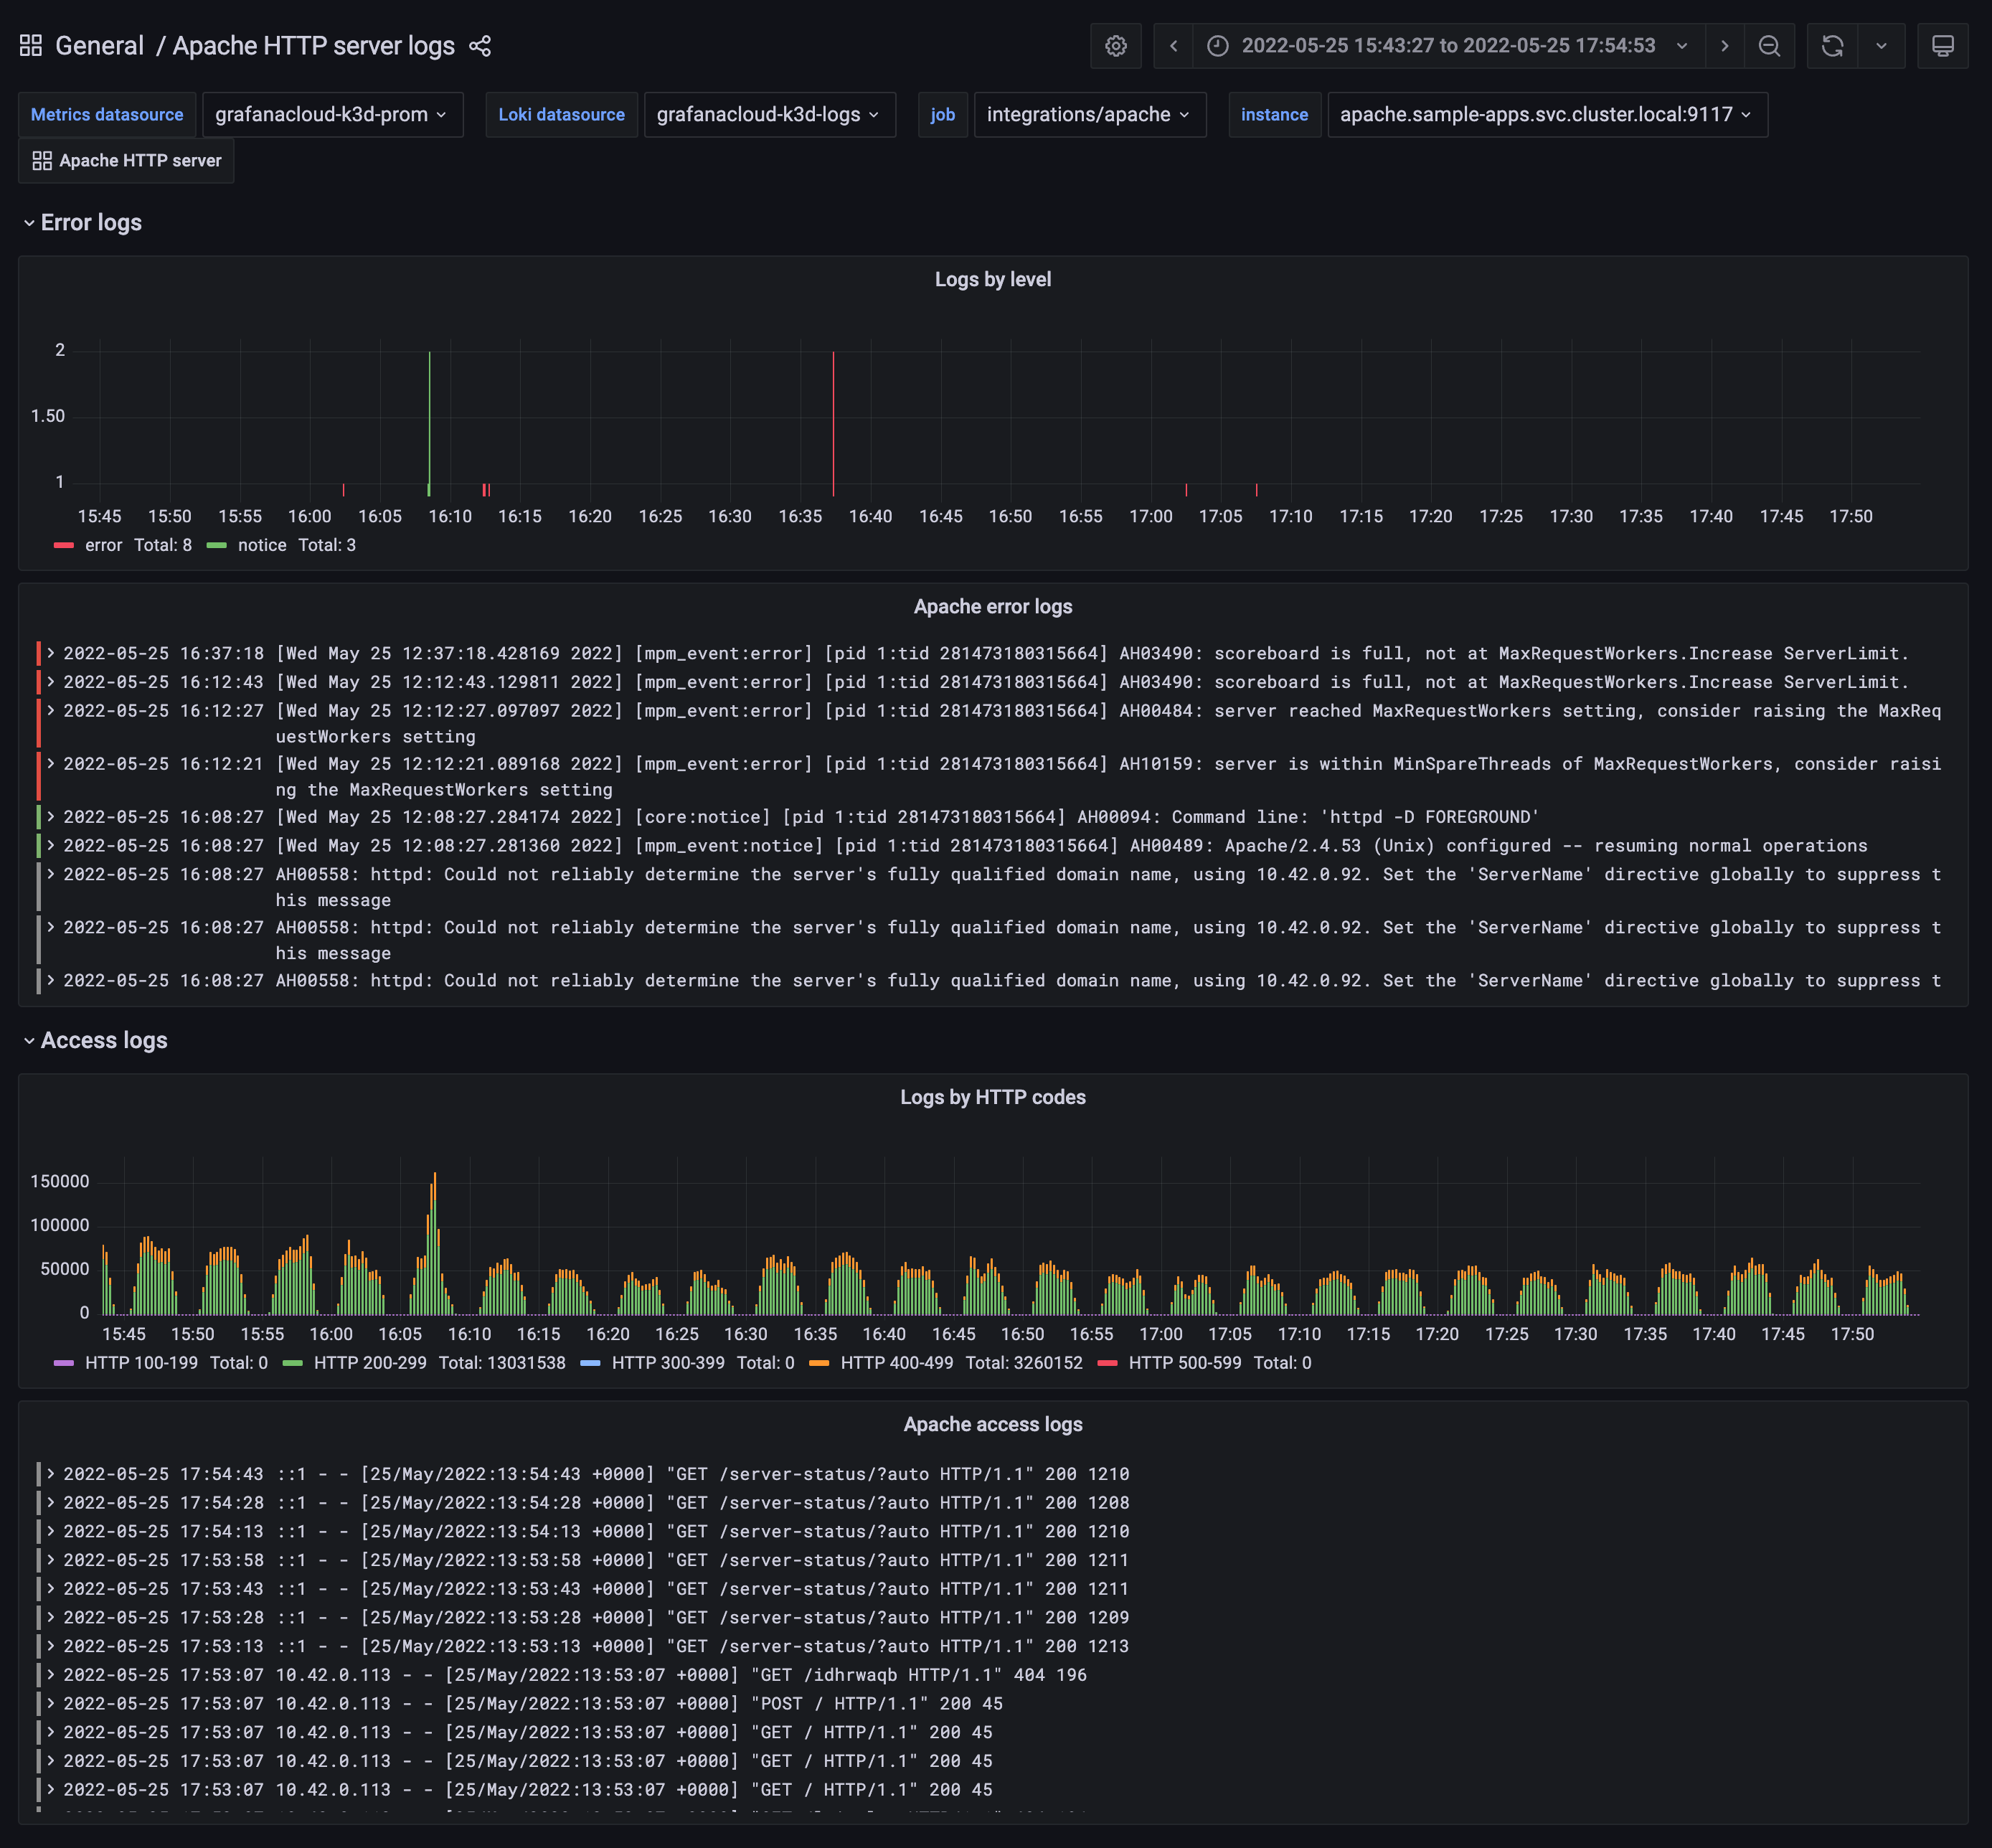
- Apache HTTP server logs
Apache HTTP server overview
Apache logs
Alerts
The Apache HTTP server integration includes the following useful alerts:
| Alert | Description |
|---|---|
| ApacheDown | Warning: Apache is down. |
| ApacheRestart | Info: Apache restart. |
| ApacheWorkersLoad | Warning: Apache workers load is too high. |
| ApacheResponseTimeTooHigh | Warning: Apache response time is too high. |
| ApacheErrorsRateTooHigh | Critical: Apache errors rate is too high. |
Metrics
The most important metrics provided by the Apache HTTP server integration, which are used on the pre-built dashboards and Prometheus alerts, are as follows:
- apache_accesses_total
- apache_cpuload
- apache_duration_ms_total
- apache_info
- apache_response_http_codes_bucket
- apache_response_http_codes_count
- apache_scoreboard
- apache_sent_kilobytes_total
- apache_up
- apache_uptime_seconds_total
- apache_workers
- up
Changelog
# 0.0.3 - September 2023

* New Filter Metrics option for configuring the Grafana Agent, which saves on metrics cost by dropping any metric not used by this integration. Beware that anything custom built using metrics that are not on the snippet will stop working.
* New hostname relabel option, which applies the instance name you write on the text box to the Grafana Agent configuration snippets, making it easier and less error prone to configure this mandatory label.

# 0.0.2 - August 2023

* Add regex filter for logs datasource

# 0.0.1 - June 2022

* Initial release
Cost
By connecting your Apache HTTP server instance to Grafana Cloud, you might incur charges. To view information on the number of active series that your Grafana Cloud account uses for metrics included in each Cloud tier, see Active series and dpm usage and Cloud tier pricing.
Was this page helpful?
Related resources from Grafana Labs


