
Apache HBase integration for Grafana Cloud
Apache HBase is an open-source non-relational distributed database modeled after Google’s Bigtable and written in Java. It is developed as part of Apache Software Foundation’s Apache Hadoop project and runs on top of HDFS or Alluxio, providing Bigtable-like capabilities for Hadoop.
This integration supports Apache HBase versions 3.0.0+
This integration includes 5 useful alerts and 3 pre-built dashboards to help monitor and visualize Apache HBase metrics and logs.
Before you begin
Apache HBase requires a JDK, Apache Zookeeper, and one of Hadoop or Alluxio. Ensure that each of these is installed and configured. Refer to this documentation for prerequisites and compatible versions for Apache HBase.
Apache HBase exposes a Prometheus metrics endpoint that is enabled by default.
Install Apache HBase integration for Grafana Cloud
- In your Grafana Cloud stack, click Connections in the left-hand menu.
- Find Apache HBase and click its tile to open the integration.
- Review the prerequisites in the Configuration Details tab and set up Grafana Agent to send Apache HBase metrics and logs to your Grafana Cloud instance.
- Click Install to add this integration’s pre-built dashboards and alerts to your Grafana Cloud instance, and you can start monitoring your Apache HBase setup.
Configuration snippets for Grafana Alloy
Advanced mode
The following snippets provide examples to guide you through the configuration process.
To instruct Grafana Alloy to scrape your Apache HBase instances, manually copy and append the snippets to your alloy configuration file, then follow subsequent instructions.
Advanced metrics snippets
prometheus.scrape "metrics_integrations_integrations_apache_hbase" {
	targets = [{
		__address__   = "localhost:<hostport>",
		hbase_cluster = "<your-cluster-name>",
		instance      = constants.hostname,
	}]
	forward_to   = [prometheus.remote_write.metrics_service.receiver]
	job_name     = "integrations/apache-hbase"
	metrics_path = "/prometheus"
}
To monitor your Apache HBase instance, you must use a discovery.relabel component to discover your Apache HBase Prometheus endpoint and apply appropriate labels, followed by a prometheus.scrape component to scrape it.
Configure the following properties within each discovery.relabel component:
__address__: The address to your Apache HBase Prometheus metrics endpoint.instancelabel:constants.hostnamesets theinstancelabel to your Grafana Alloy server hostname. If that is not suitable, change it to a value uniquely identifies this Apache HBase instance. Make sure this label value is the same for all telemetry data collected for this instance.hbase_clusterlabel must be set to a value that identifies your Apache HBase cluster.
If you have multiple Apache HBase servers to scrape, configure one discovery.relabel for each and scrape them by including each under targets within the prometheus.scrape component.
Advanced logs snippets
linux
local.file_match "logs_integrations_integrations_apache_hbase" {
	path_targets = [{
		__address__   = "localhost",
		__path__      = "<hbase_home>/logs/*.log",
		hbase_cluster = "<your-cluster-name>",
		instance      = constants.hostname,
		job           = "integrations/apache-hbase",
	}]
}

loki.process "logs_integrations_integrations_apache_hbase" {
	forward_to = [loki.write.grafana_cloud_loki.receiver]

	stage.multiline {
		firstline     = "\\d{4}-\\d{2}-\\d{2}T\\d{2}:\\d{2}:\\d{2},\\d{3}"
		max_lines     = 0
		max_wait_time = "3s"
	}

	stage.regex {
		expression = "\\d{4}-\\d{2}-\\d{2}T\\d{2}:\\d{2}:\\d{2},\\d{3} (?P<level>\\w+)  \\[(.*)\\] (?P<logger>\\w+.\\w+): (?P<message>(?s:.*))$"
	}

	stage.labels {
		values = {
			level  = null,
			logger = null,
		}
	}
}

loki.source.file "logs_integrations_integrations_apache_hbase" {
	targets    = local.file_match.logs_integrations_integrations_apache_hbase.targets
	forward_to = [loki.process.logs_integrations_integrations_apache_hbase.receiver]
}
To monitor your Apache HBase instance logs, you will use a combination of the following components:
local.file_match defines where to find the log file to be scraped. Change the following properties according to your environment:
__address__: The Apache HBase instance address__path__: The path to the log file.instancelabel:constants.hostnamesets theinstancelabel to your Grafana Alloy server hostname. If that is not suitable, change it to a value uniquely identifies this Apache HBase instance. Make sure this label value is the same for all telemetry data collected for this instance.hbase_clusterlabel must be set to a value that identifies your Apache HBase cluster.
loki.process defines how to process logs before sending it to Loki.
loki.source.file sends logs to Loki.
Grafana Agent static configuration (deprecated)
The following section shows configuration for running Grafana Agent in static mode which is deprecated. You should use Grafana Alloy for all new deployments.
Before you begin
Apache HBase requires a JDK, Apache Zookeeper, and one of Hadoop or Alluxio. Ensure that each of these is installed and configured. Refer to this documentation for prerequisites and compatible versions for Apache HBase.
Apache HBase exposes a Prometheus metrics endpoint that is enabled by default.
Install Apache HBase integration for Grafana Cloud
- In your Grafana Cloud stack, click Connections in the left-hand menu.
- Find Apache HBase and click its tile to open the integration.
- Review the prerequisites in the Configuration Details tab and set up Grafana Agent to send Apache HBase metrics and logs to your Grafana Cloud instance.
- Click Install to add this integration’s pre-built dashboards and alerts to your Grafana Cloud instance, and you can start monitoring your Apache HBase setup.
Post-install configuration for the Apache HBase integration
After enabling the metrics generation, instruct the Grafana Agent to scrape your Apache HBase instance.
If you want to show logs and metrics signals correlated in your dashboards, as a single pane of glass, ensure the following:
job,hbase_cluster, andinstancelabel values must match for metrics and logs scrape config in your agent configuration file.joblabel must be set tointegrations/apache-hbase(already configured in the snippets).hbase_clusterlabel must be set to a value that identifies your Apache HBase cluster.instancelabel must be set to a value that uniquely identifies your Apache HBase node. Please replace the default hostname value according to your environment - it must be set manually.
Configuration snippets for Grafana Agent
Below metrics.configs.scrape_configs, insert the following lines and change the URLs according to your environment:
    - job_name: integrations/apache-hbase
      metrics_path: /prometheus
      static_configs:
        - targets: ["localhost:<hostport>"]
          labels:
            hbase_cluster: '<your-cluster-name>'
            instance: '<your-instance-name>'
Below logs.configs.scrape_configs, insert the following lines according to your environment.
    - job_name: integrations/apache-hbase
      static_configs:
        - targets: [localhost]
          labels:
            job: integrations/apache-hbase
            hbase_cluster: '<your-cluster-name>'
            instance: '<your-instance-name>'
            __path__: <hbase_home>/logs/*.log
      pipeline_stages:
        - multiline:
            firstline: '\d{4}-\d{2}-\d{2}T\d{2}:\d{2}:\d{2},\d{3}'
        - regex:
            expression: '\d{4}-\d{2}-\d{2}T\d{2}:\d{2}:\d{2},\d{3} (?P<level>\w+)  \[(.*)\] (?P<logger>\w+.\w+): (?P<message>(?s:.*))$'
        - labels:
            level:
            logger:
Full example configuration for Grafana Agent
Refer to the following Grafana Agent configuration for a complete example that contains all the snippets used for the Apache HBase integration. This example also includes metrics that are sent to monitor your Grafana Agent instance.
integrations:
  prometheus_remote_write:
  - basic_auth:
      password: <your_prom_pass>
      username: <your_prom_user>
    url: <your_prom_url>
  agent:
    enabled: true
    relabel_configs:
    - action: replace
      source_labels:
      - agent_hostname
      target_label: instance
    - action: replace
      target_label: job
      replacement: "integrations/agent-check"
    metric_relabel_configs:
    - action: keep
      regex: (prometheus_target_sync_length_seconds_sum|prometheus_target_scrapes_.*|prometheus_target_interval.*|prometheus_sd_discovered_targets|agent_build.*|agent_wal_samples_appended_total|process_start_time_seconds)
      source_labels:
      - __name__
  # Add here any snippet that belongs to the `integrations` section.
  # For a correct indentation, paste snippets copied from Grafana Cloud at the beginning of the line.
logs:
  configs:
  - clients:
    - basic_auth:
        password: <your_loki_pass>
        username: <your_loki_user>
      url: <your_loki_url>
    name: integrations
    positions:
      filename: /tmp/positions.yaml
    scrape_configs:
      # Add here any snippet that belongs to the `logs.configs.scrape_configs` section.
      # For a correct indentation, paste snippets copied from Grafana Cloud at the beginning of the line.
    - job_name: integrations/apache-hbase
      static_configs:
        - targets: [localhost]
          labels:
            job: integrations/apache-hbase
            hbase_cluster: '<your-cluster-name>'
            instance: '<your-instance-name>'
            __path__: <hbase_home>/logs/*.log
      pipeline_stages:
        - multiline:
            firstline: '\d{4}-\d{2}-\d{2}T\d{2}:\d{2}:\d{2},\d{3}'
        - regex:
            expression: '\d{4}-\d{2}-\d{2}T\d{2}:\d{2}:\d{2},\d{3} (?P<level>\w+)  \[(.*)\] (?P<logger>\w+.\w+): (?P<message>(?s:.*))$'
        - labels:
            level:
            logger:
metrics:
  configs:
  - name: integrations
    remote_write:
    - basic_auth:
        password: <your_prom_pass>
        username: <your_prom_user>
      url: <your_prom_url>
    scrape_configs:
      # Add here any snippet that belongs to the `metrics.configs.scrape_configs` section.
      # For a correct indentation, paste snippets copied from Grafana Cloud at the beginning of the line.
    - job_name: integrations/apache-hbase
      metrics_path: /prometheus
      static_configs:
        - targets: ["localhost:<hostport>"]
          labels:
            hbase_cluster: '<your-cluster-name>'
            instance: '<your-instance-name>'
  global:
    scrape_interval: 60s
  wal_directory: /tmp/grafana-agent-wal
Dashboards
The Apache HBase integration installs the following dashboards in your Grafana Cloud instance to help monitor your system.
- Apache HBase RegionServer overview
- Apache HBase cluster overview
- Apache HBase logs overview
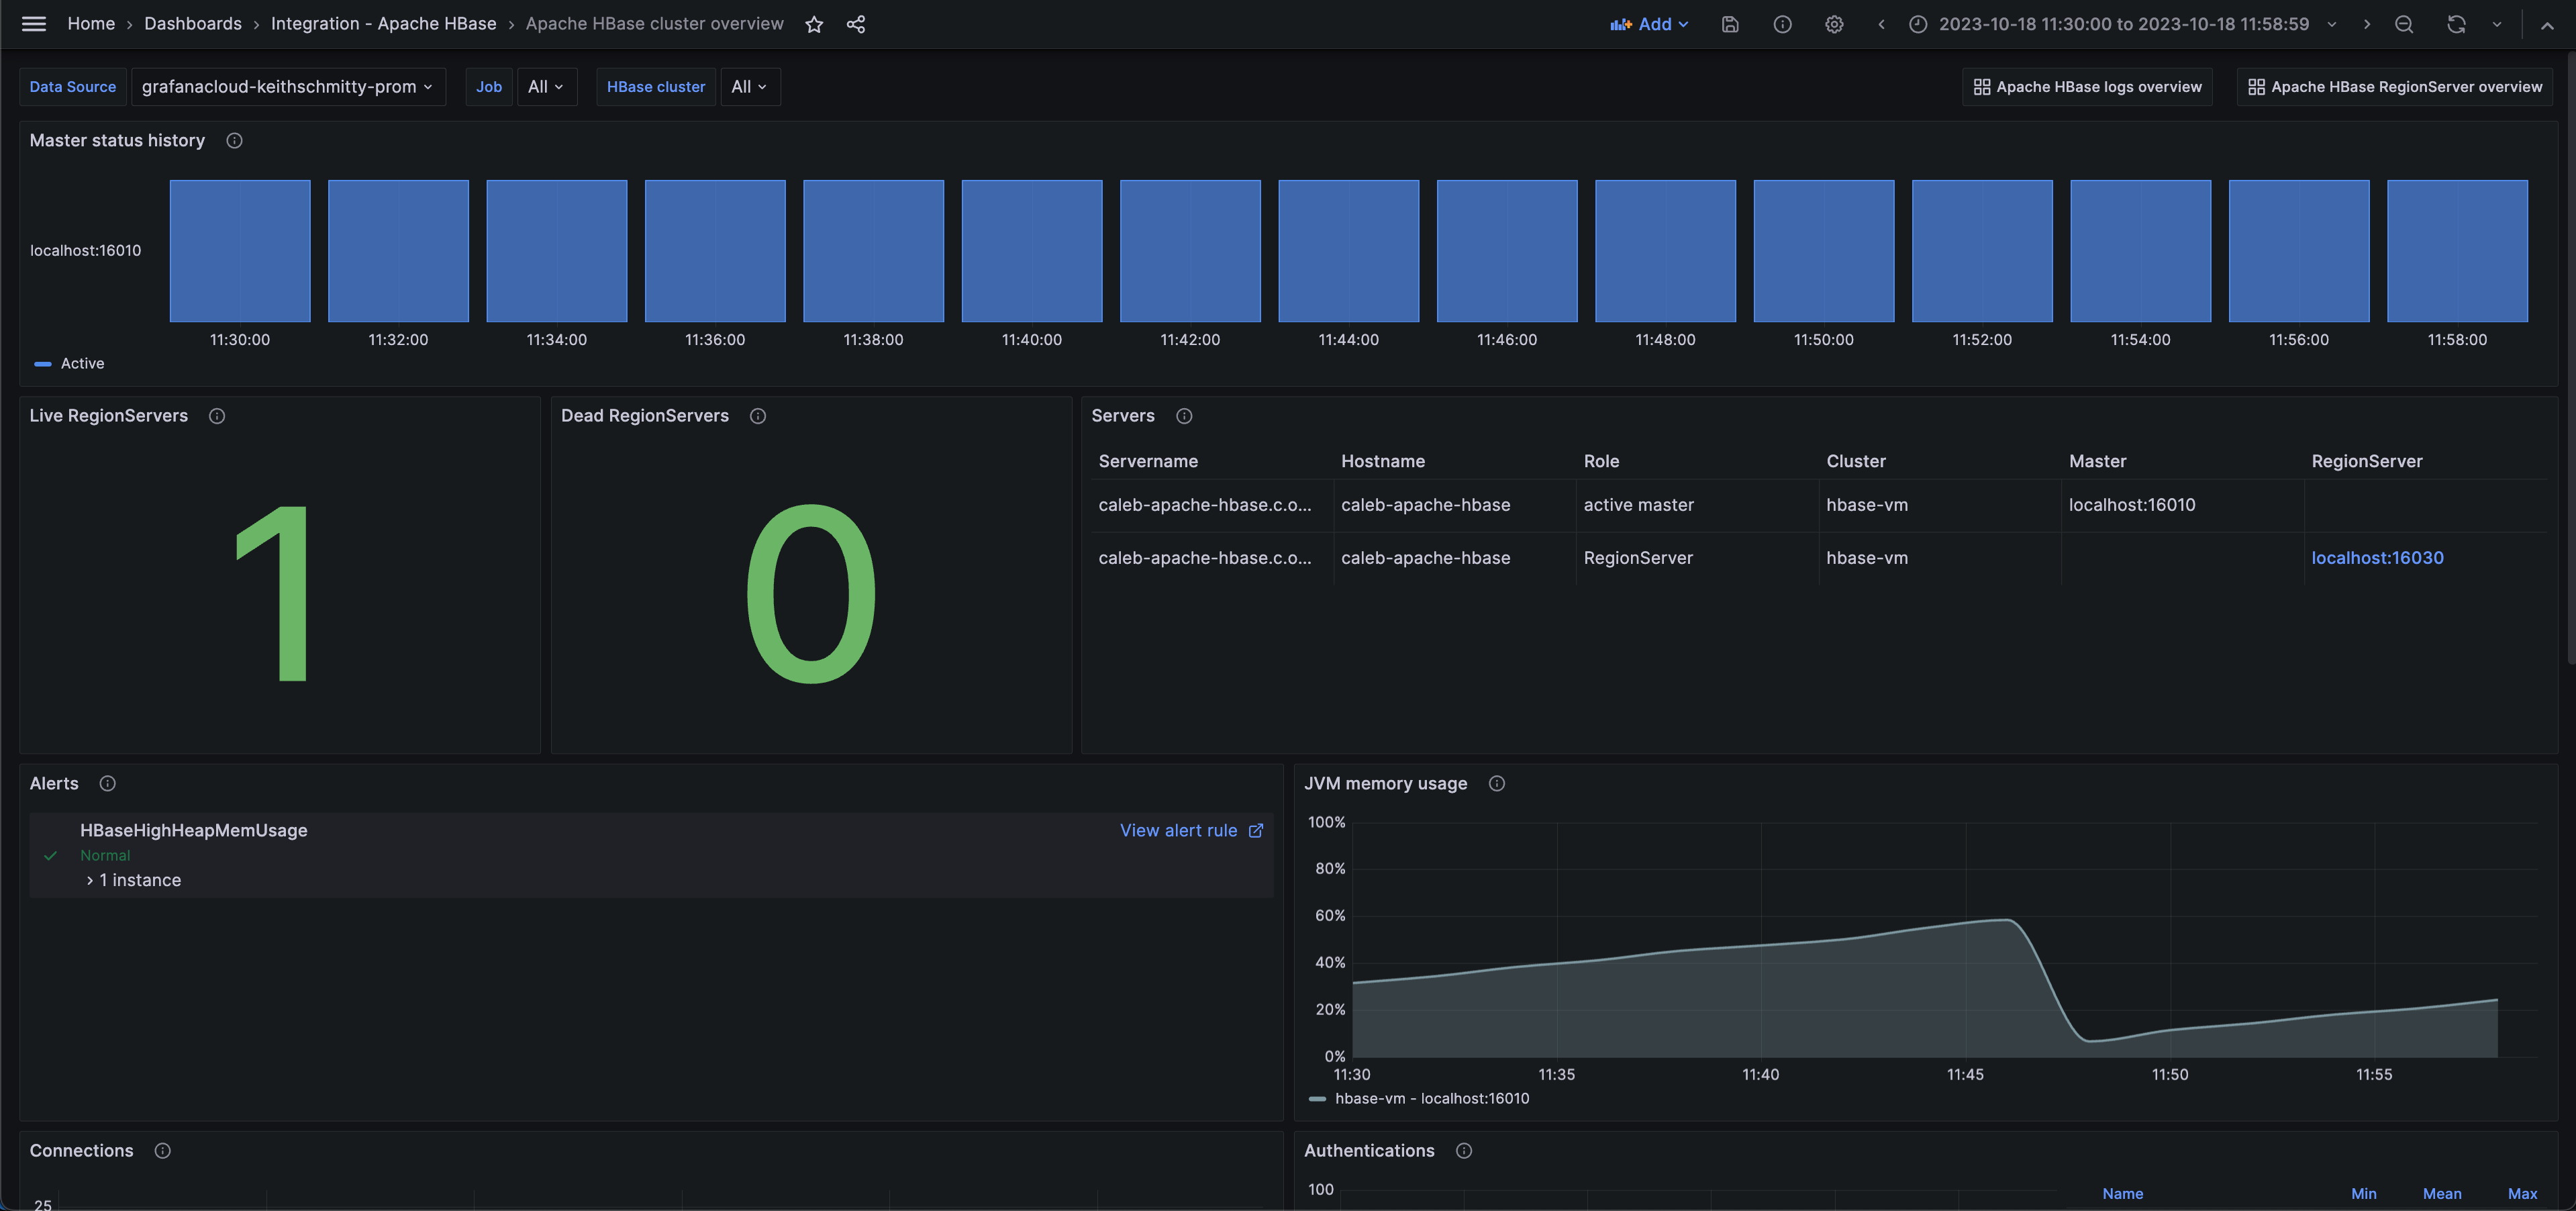
Apache HBase cluster overview (status)
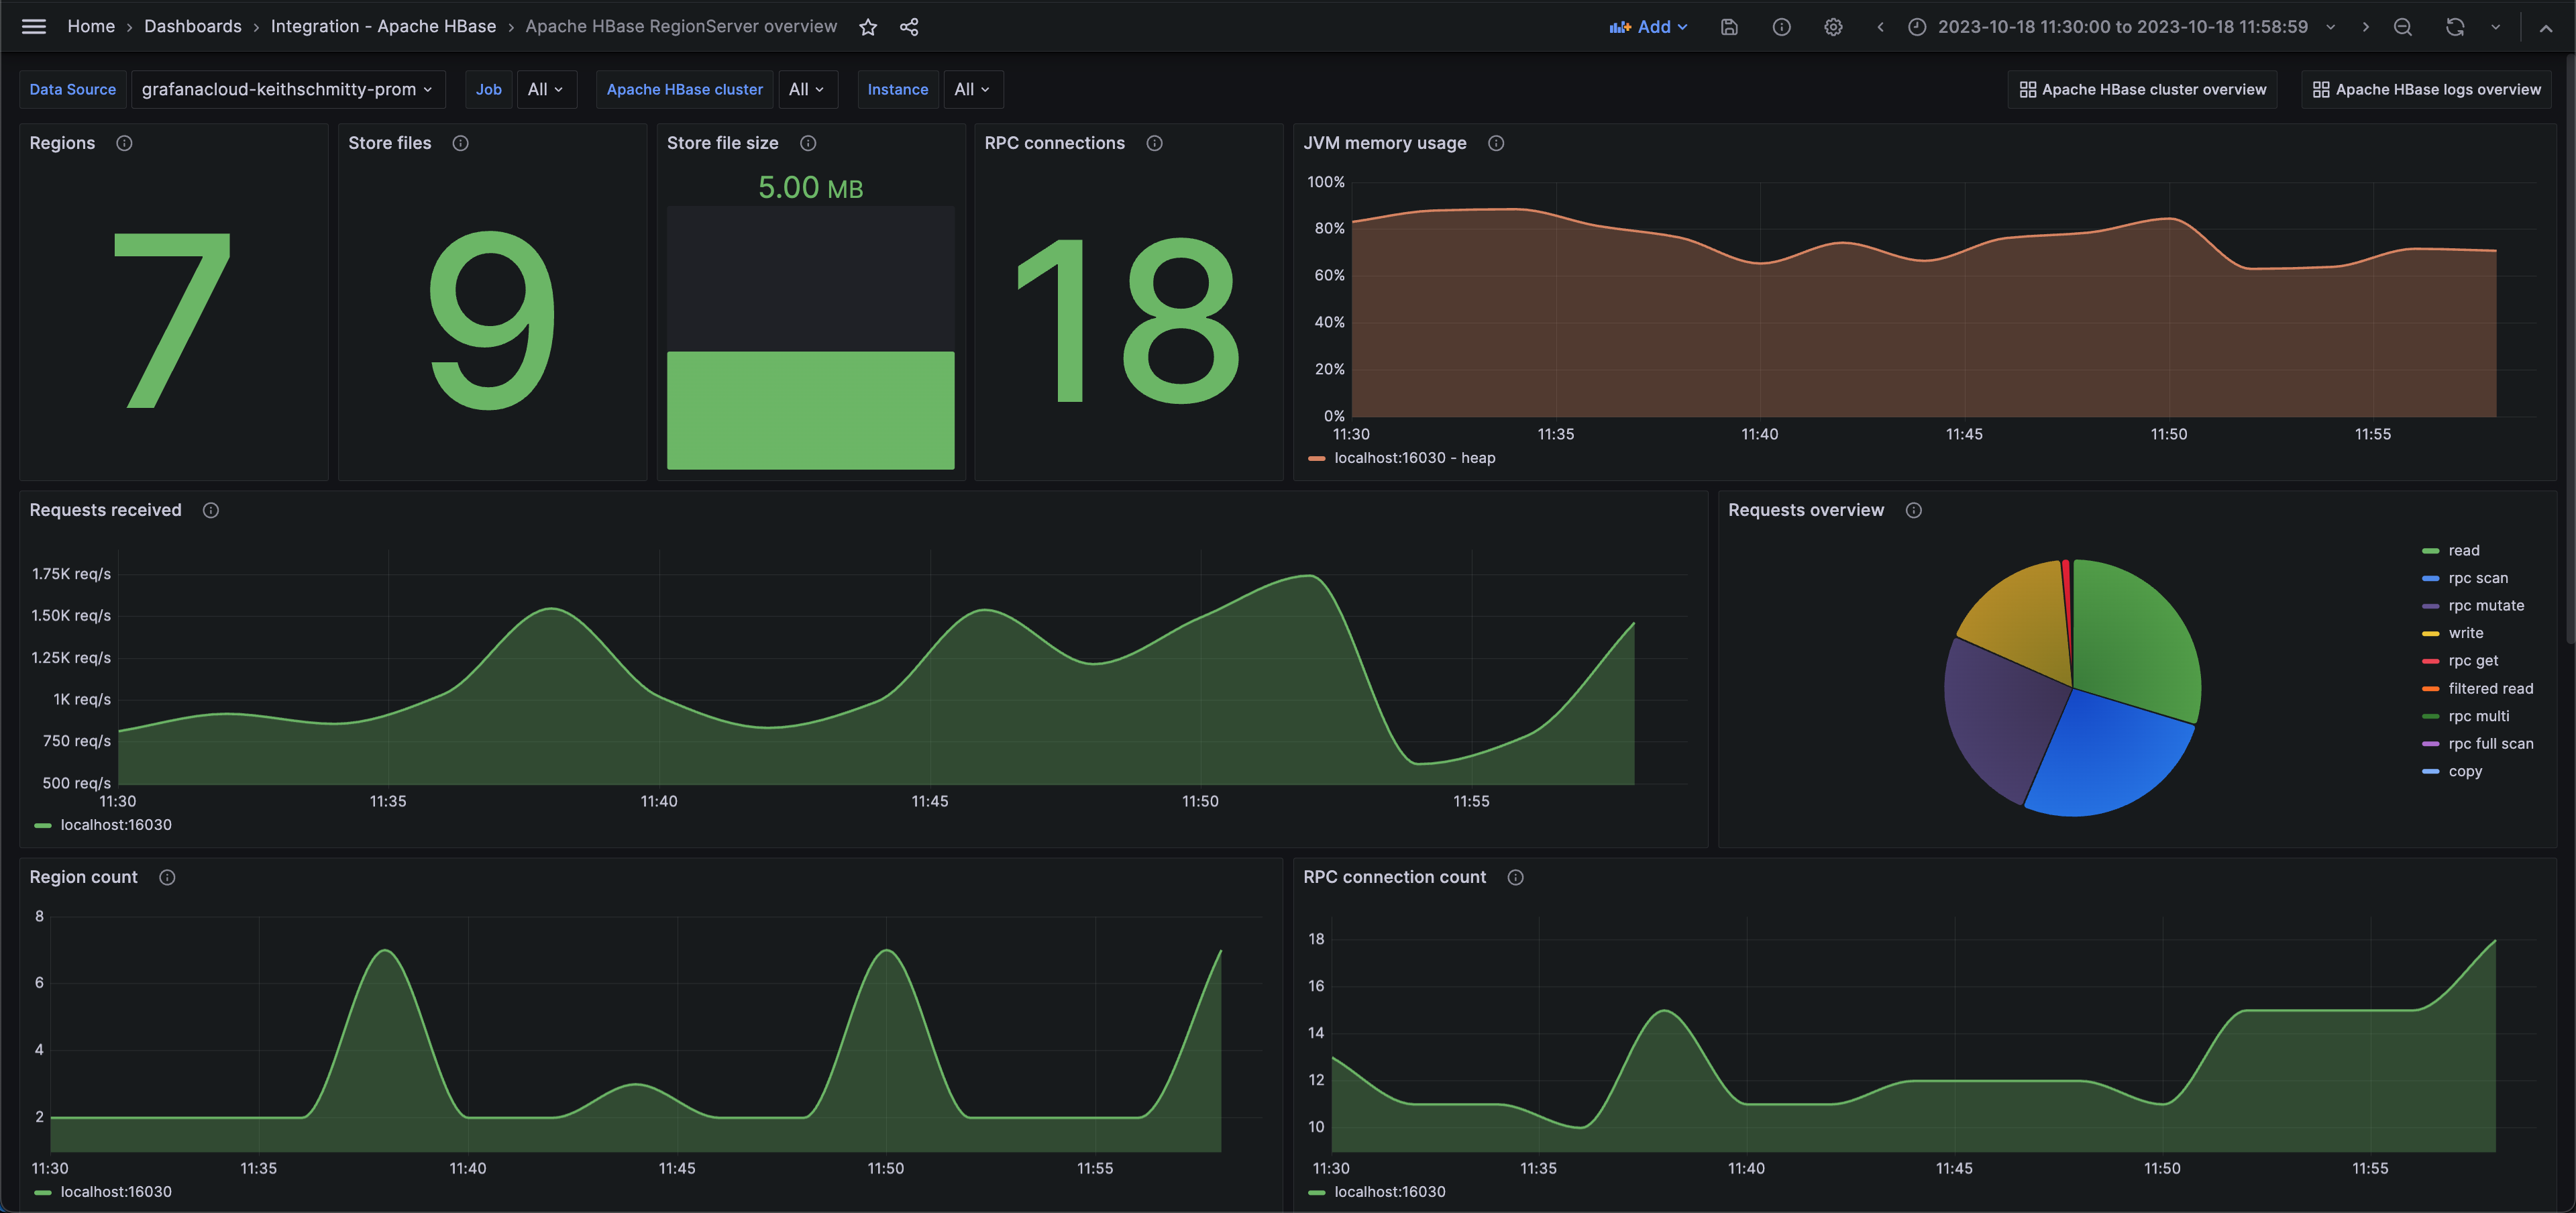
Apache HBase RegionServer overview (performance)
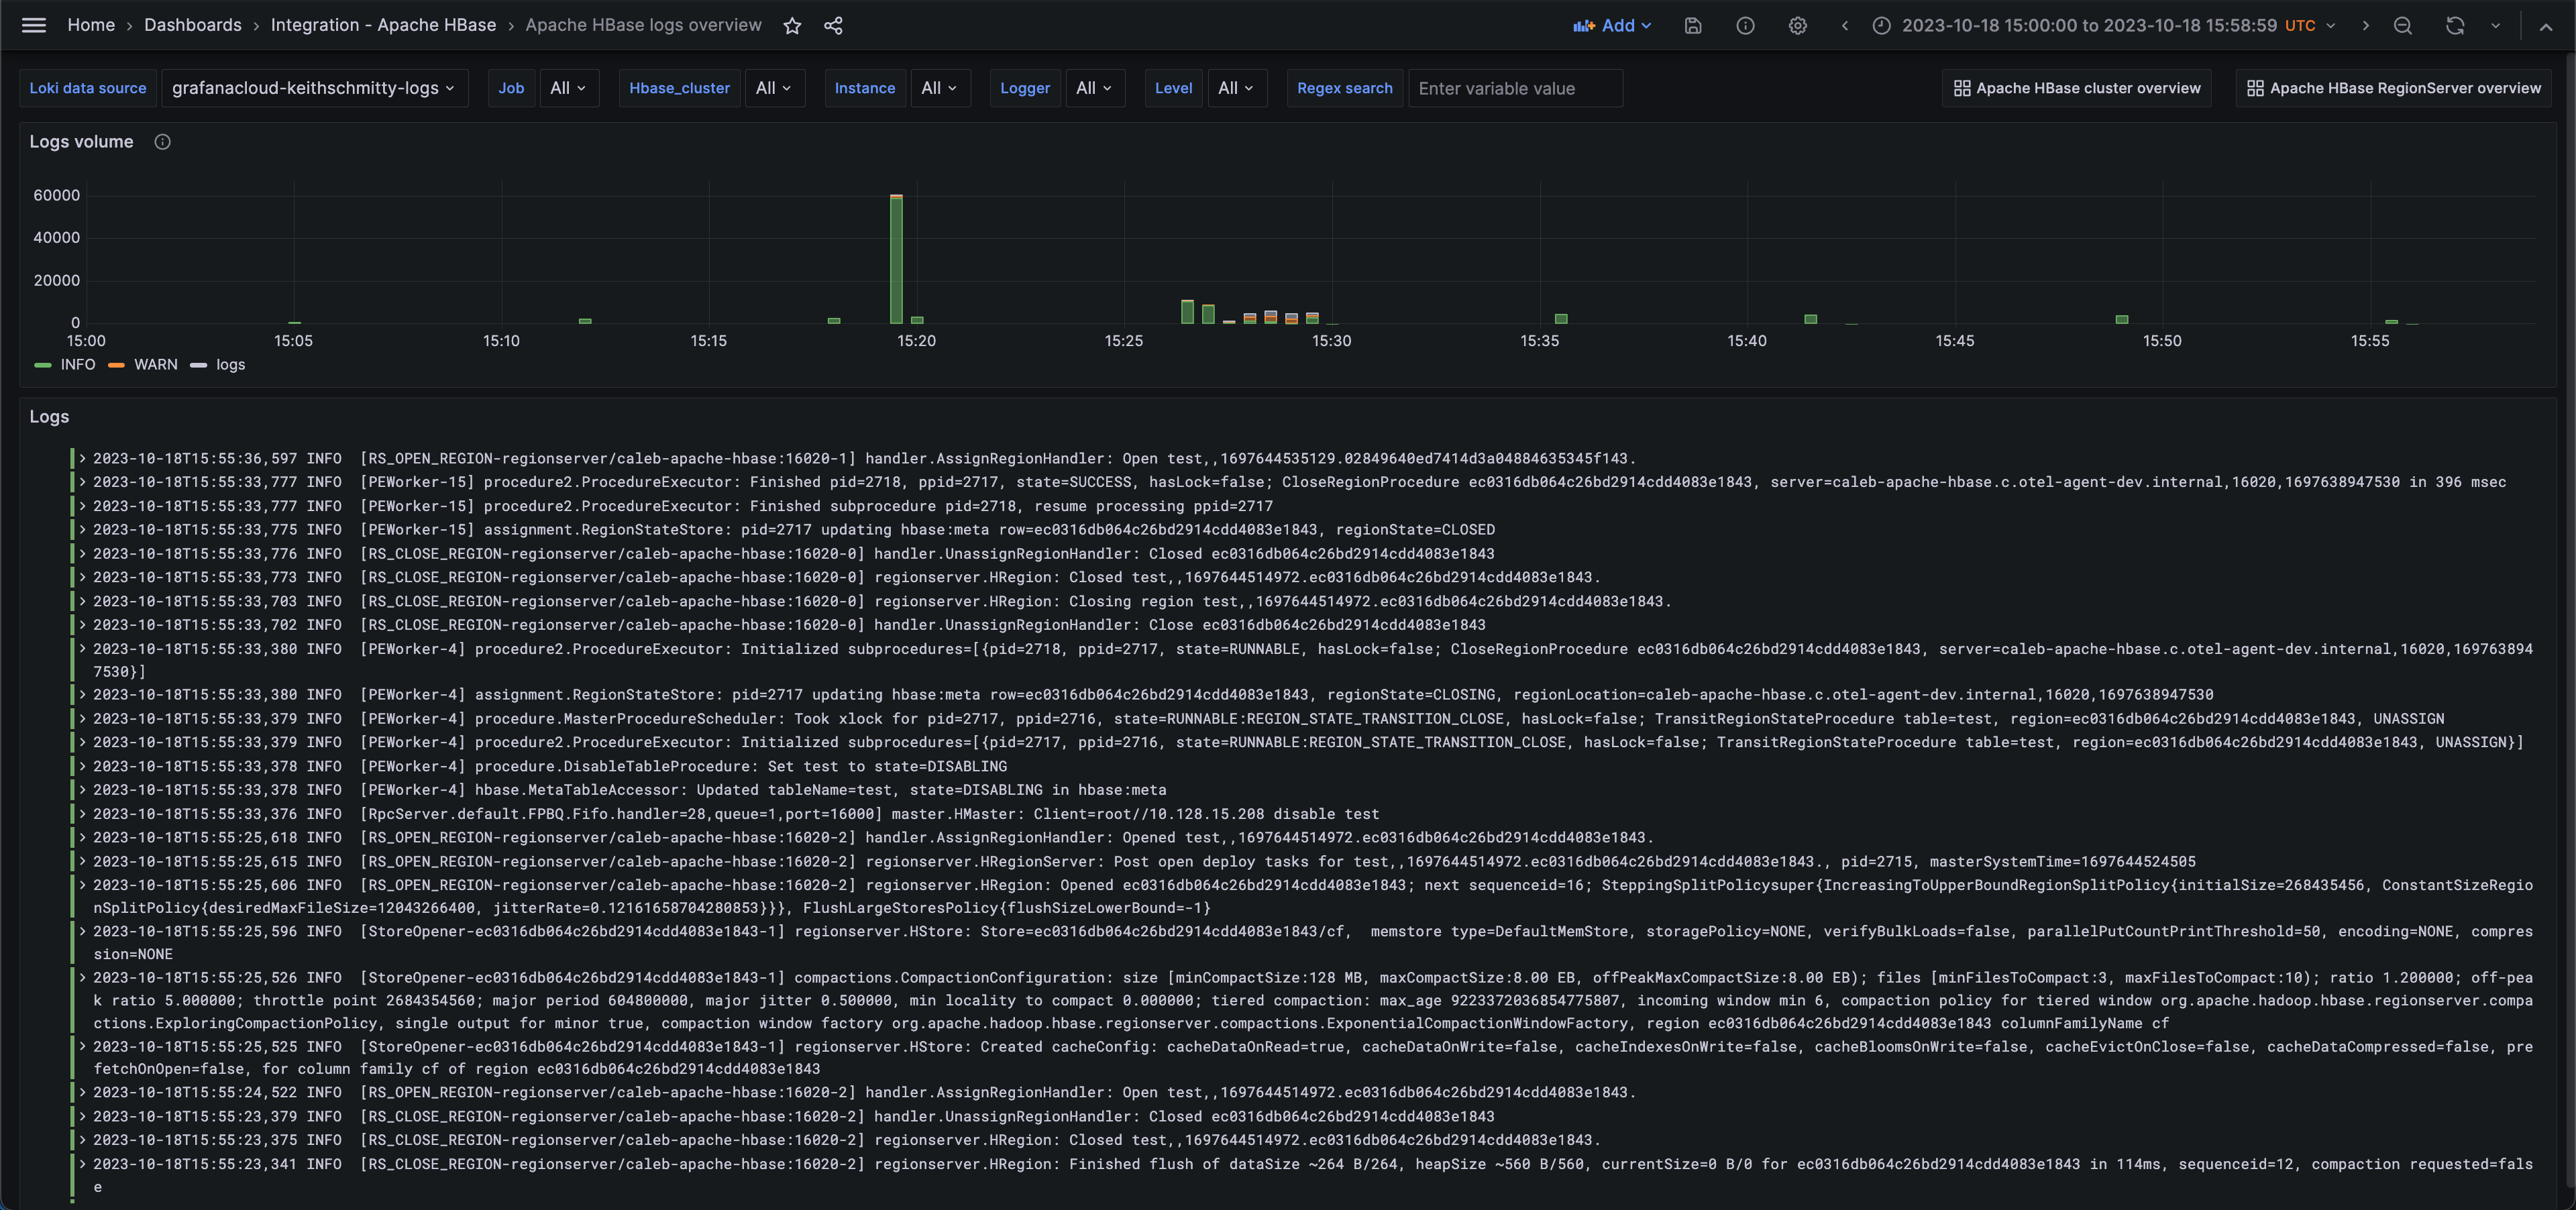
Apache HBase logs overview
Alerts
The Apache HBase integration includes the following useful alerts:
| Alert | Description |
|---|---|
| HBaseHighHeapMemUsage | Warning: There is a limited amount of heap memory available to the JVM. |
| HBaseDeadRegionServer | Warning: One or more RegionServer(s) has become unresponsive. |
| HBaseOldRegionsInTransition | Warning: RegionServers are in transition for longer than expected. |
| HBaseHighMasterAuthFailRate | Warning: A high percentage of authentication attempts to the master are failing. |
| HBaseHighRSAuthFailRate | Warning: A high percentage of authentication attempts to a RegionServer are failing. |
Metrics
The most important metrics provided by the Apache HBase integration, which are used on the pre-built dashboards and Prometheus alerts, are as follows:
- assignment_manager_rit_count
- assignment_manager_rit_count_over_threshold
- assignment_manager_rit_oldest_age
- jvm_metrics_mem_heap_committed_m
- jvm_metrics_mem_heap_used_m
- master_authentication_failures
- master_authentication_successes
- master_num_calls_in_general_queue
- master_num_calls_in_priority_queue
- master_num_calls_in_read_queue
- master_num_calls_in_replication_queue
- master_num_calls_in_scan_queue
- master_num_calls_in_write_queue
- master_num_open_connections
- master_queue_size
- region_server_authentication_failures
- region_server_authentication_successes
- region_server_num_calls_in_general_queue
- region_server_num_calls_in_priority_queue
- region_server_num_calls_in_read_queue
- region_server_num_calls_in_replication_queue
- region_server_num_calls_in_scan_queue
- region_server_num_calls_in_write_queue
- region_server_num_open_connections
- server_block_cache_express_hit_percent
- server_num_dead_region_servers
- server_num_reference_files
- server_num_region_servers
- server_region_count
- server_slow_append_count
- server_slow_delete_count
- server_slow_get_count
- server_slow_increment_count
- server_slow_put_count
- server_store_file_count
- server_store_file_size
- server_total_request_count
- up
Changelog
# 1.0.0 - November 2023

- Initial release
Cost
By connecting your Apache HBase instance to Grafana Cloud, you might incur charges. To view information on the number of active series that your Grafana Cloud account uses for metrics included in each Cloud tier, see Active series and dpm usage and Cloud tier pricing.
Was this page helpful?
Related resources from Grafana Labs


