
Apache Airflow integration for Grafana Cloud
Apache Airflow is an open-source platform for programmatically authoring, scheduling, and monitoring workflows, enabling the orchestration of complex data pipelines and task dependencies. This integration for Grafana Cloud allows users to collect metrics, scheduler logs, and task logs for monitoring an Apache Airflow system.
Metrics include DAG (Directed Acyclic Graph) failures, DAG durations, task failures, task durations, scheduler details, executor tasks, and pool task slots for an Apache Airflow system.
This integration supports Apache Airflow versions 2.5.0+.
This integration includes 4 useful alerts and 1 pre-built dashboard to help monitor and visualize Apache Airflow metrics and logs.
Before you begin
In order for the integration to properly work, Airflow must be setup to send metrics to StatsD.
Setup Airflow to send metrics to StatsD
First you must install the StatsD requirement:
pip install 'apache-airflow[statsd]'Also, the following lines must be added to your airflow.cfg:
[metrics]
statsd_on = True
statsd_host = localhost
statsd_port = 8125
statsd_prefix = airflow
Install Apache Airflow integration for Grafana Cloud
- In your Grafana Cloud stack, click Connections in the left-hand menu.
- Find Apache Airflow and click its tile to open the integration.
- Review the prerequisites in the Configuration Details tab and set up Grafana Agent to send Apache Airflow metrics and logs to your Grafana Cloud instance.
- Click Install to add this integration’s pre-built dashboard and alerts to your Grafana Cloud instance, and you can start monitoring your Apache Airflow setup.
Configuration snippets for Grafana Alloy
Simple mode
These snippets are configured to scrape a single Apache Airflow instance running locally with default ports.
First, manually copy and append the following snippets into your alloy configuration file.
Integrations snippets
prometheus.exporter.statsd "integrations_statsd_exporter" {
	listen_udp = "localhost:8125"
  mapping_config_path = "statsd_mapping.yaml"
}

discovery.relabel "integrations_statsd_exporter" {
	targets = prometheus.exporter.statsd.integrations_statsd_exporter.targets

	rule {
		target_label = "job"
		replacement  = "integrations/apache-airflow"
	}

	rule {
		target_label = "instance"
		replacement  = constants.hostname
	}
}

prometheus.scrape "integrations_statsd_exporter" {
	targets    = discovery.relabel.integrations_statsd_exporter.output
	forward_to = [prometheus.remote_write.metrics_service.receiver]
	job_name   = "integrations/statsd_exporter"
}
Advanced mode
The following snippets provide examples to guide you through the configuration process.
To instruct Grafana Alloy to scrape your Apache Airflow instances, manually copy and append the snippets to your alloy configuration file, then follow subsequent instructions.
Advanced integrations snippets
prometheus.exporter.statsd "integrations_statsd_exporter" {
	listen_udp = "localhost:8125"
  mapping_config_path = "statsd_mapping.yaml"
}

discovery.relabel "integrations_statsd_exporter" {
	targets = prometheus.exporter.statsd.integrations_statsd_exporter.targets

	rule {
		target_label = "job"
		replacement  = "integrations/apache-airflow"
	}

	rule {
		target_label = "instance"
		replacement  = constants.hostname
	}
}

prometheus.scrape "integrations_statsd_exporter" {
	targets    = discovery.relabel.integrations_statsd_exporter.output
	forward_to = [prometheus.remote_write.metrics_service.receiver]
	job_name   = "integrations/statsd_exporter"
}
This integrations uses the prometheus.exporter.statsd component to generate metrics from a Apache Airflow instance.
Make sure to change listen_udp in the snippet according to your environment.
The statsd exporter component requires an external mapping configuration file. You can download the correct mapping file for this integration here.
For the full array of configuration options, refer to the prometheus.exporter.statsd component reference documentation.
This exporter must be linked with a discovery.relabel component to apply the necessary relabelings.
For each Apache Airflow instance to be monitored you must create a pair of these components.
Configure the following properties within each discovery.relabel component:
instancelabel:constants.hostnamesets theinstancelabel to your Grafana Alloy server hostname. If that is not suitable, change it to a value uniquely identifies this Apache Airflow instance. Make sure this label value is the same for all telemetry data collected for this instance.
You can then scrape them by including each discovery.relabel under targets within the prometheus.scrape component.
Advanced logs snippets
darwin
local.file_match "logs_integrations_integrations_apache_airflow" {
	path_targets = [{
		__address__ = "localhost",
		__path__    = "<airflow_home>/logs/dag_id=*/**/*.log",
		instance    = constants.hostname,
		job         = "integrations/apache-airflow",
	}, {
		__address__ = "localhost",
		__path__    = "<airflow_home>/logs/scheduler/latest/*.py.log",
		instance    = constants.hostname,
		job         = "integrations/apache-airflow",
	}]
}

loki.process "logs_integrations_integrations_apache_airflow" {
	forward_to = [loki.write.grafana_cloud_loki.receiver]

	stage.match {
		selector = format("{job=\"integrations/apache-airflow\",instance=\"%s\"}", constants.hostname)

		stage.regex {
			expression = "<airflow_home>/logs/dag_id=(?P<dag_id>\\S+?)/.*/task_id=(?P<task_id>\\S+?)/.*log"
			source     = "filename"
		}

		stage.labels {
			values = {
				dag_id  = null,
				task_id = null,
			}
		}
	}

	stage.match {
		selector = format("{job=\"integrations/apache-airflow\",instance=\"%s\"}", constants.hostname)

		stage.regex {
			expression = "<airflow_home>/logs/scheduler/latest/(?P<dag_file>\\S+?)\\.log"
			source     = "filename"
		}

		stage.labels {
			values = {
				dag_file = null,
			}
		}
	}

	stage.multiline {
		firstline     = "\\[\\d+-\\d+-\\d+T\\d+:\\d+:\\d+\\.\\d+\\+\\d+\\]"
		max_lines     = 0
		max_wait_time = "3s"
	}
}

loki.source.file "logs_integrations_integrations_apache_airflow" {
	targets    = local.file_match.logs_integrations_integrations_apache_airflow.targets
	forward_to = [loki.process.logs_integrations_integrations_apache_airflow.receiver]
}
To monitor your Apache Airflow instance logs, you will use a combination of the following components:
local.file_match defines where to find the log file to be scraped. Change the following properties according to your environment:
__address__: The Apache Airflow instance address__path__: The path to the log file.instancelabel:constants.hostnamesets theinstancelabel to your Grafana Alloy server hostname. If that is not suitable, change it to a value uniquely identifies this Apache Airflow instance. Make sure this label value is the same for all telemetry data collected for this instance.
loki.process defines how to process logs before sending it to Loki.
loki.source.file sends logs to Loki.
linux
local.file_match "logs_integrations_integrations_apache_airflow" {
	path_targets = [{
		__address__ = "localhost",
		__path__    = "<airflow_home>/logs/dag_id=*/**/*.log",
		instance    = constants.hostname,
		job         = "integrations/apache-airflow",
	}, {
		__address__ = "localhost",
		__path__    = "<airflow_home>/logs/scheduler/latest/*.py.log",
		instance    = constants.hostname,
		job         = "integrations/apache-airflow",
	}]
}

loki.process "logs_integrations_integrations_apache_airflow" {
	forward_to = [loki.write.grafana_cloud_loki.receiver]

	stage.match {
		selector = format("{job=\"integrations/apache-airflow\",instance=\"%s\"}", constants.hostname)

		stage.regex {
			expression = "<airflow_home>/logs/dag_id=(?P<dag_id>\\S+?)/.*/task_id=(?P<task_id>\\S+?)/.*log"
			source     = "filename"
		}

		stage.labels {
			values = {
				dag_id  = null,
				task_id = null,
			}
		}
	}

	stage.match {
		selector = format("{job=\"integrations/apache-airflow\",instance=\"%s\"}", constants.hostname)

		stage.regex {
			expression = "<airflow_home>/logs/scheduler/latest/(?P<dag_file>\\S+?)\\.log"
			source     = "filename"
		}

		stage.labels {
			values = {
				dag_file = null,
			}
		}
	}

	stage.multiline {
		firstline     = "\\[\\d+-\\d+-\\d+T\\d+:\\d+:\\d+\\.\\d+\\+\\d+\\]"
		max_lines     = 0
		max_wait_time = "3s"
	}
}

loki.source.file "logs_integrations_integrations_apache_airflow" {
	targets    = local.file_match.logs_integrations_integrations_apache_airflow.targets
	forward_to = [loki.process.logs_integrations_integrations_apache_airflow.receiver]
}
To monitor your Apache Airflow instance logs, you will use a combination of the following components:
local.file_match defines where to find the log file to be scraped. Change the following properties according to your environment:
__address__: The Apache Airflow instance address__path__: The path to the log file.instancelabel:constants.hostnamesets theinstancelabel to your Grafana Alloy server hostname. If that is not suitable, change it to a value uniquely identifies this Apache Airflow instance. Make sure this label value is the same for all telemetry data collected for this instance.
loki.process defines how to process logs before sending it to Loki.
loki.source.file sends logs to Loki.
Grafana Agent static configuration (deprecated)
The following section shows configuration for running Grafana Agent in static mode which is deprecated. You should use Grafana Alloy for all new deployments.
Before you begin
In order for the integration to properly work, Airflow must be setup to send metrics to StatsD.
Setup Airflow to send metrics to StatsD
First you must install the StatsD requirement:
pip install 'apache-airflow[statsd]'Also, the following lines must be added to your airflow.cfg:
[metrics]
statsd_on = True
statsd_host = localhost
statsd_port = 8125
statsd_prefix = airflow
Install Apache Airflow integration for Grafana Cloud
- In your Grafana Cloud stack, click Connections in the left-hand menu.
- Find Apache Airflow and click its tile to open the integration.
- Review the prerequisites in the Configuration Details tab and set up Grafana Agent to send Apache Airflow metrics and logs to your Grafana Cloud instance.
- Click Install to add this integration’s pre-built dashboard and alerts to your Grafana Cloud instance, and you can start monitoring your Apache Airflow setup.
Post-install configuration for the Apache Airflow integration
After enabling the metrics generation, instruct the Grafana Agent to scrape your Apache Airflow system.
Make sure to change listen_udp in the snippet according to your environment.
If you want to show logs and metrics signals correlated in your dashboards as a single pane of glass, ensure the following:
jobandinstancelabel values must match for the Apache Airflow integration and logs scrape config in your agent configuration file.jobmust be set tointegrations/apache-airflow. Ensure that thejobunder theagentrelabel_configsmatches thejoblabels under thelogsstatic_configsas well as thepipeline_stagesmatchselector.instancelabel must be set to a value that uniquely identifies your Apache Airflow system. Ensure that theinstanceunder theagentstatsd_exportermatches theinstancelabels under thelogsstatic_configsas well as thepipeline_stagesmatchselector.
Configuration snippets for Grafana Agent
Below integrations, insert the following lines and change the URLs according to your environment:
  statsd_exporter:
    enabled: true
    instance: '<your-instance-name>'
    listen_udp: '<your-instance-hostname>:8125'
    scrape_interval: 60s
    scrape_integration: true
    relabel_configs:
    - target_label: job
      replacement: 'integrations/apache-airflow'
    mapping_config:
      mappings:
      - match: "airflow.dag.*.*.duration"
        match_metric_type: observer
        name: "airflow_dag_task_duration"
        labels:
          dag_id: "$1"
          task_id: "$2"
      - match: "airflow.dagrun.duration.success.*"
        match_metric_type: observer
        name: "airflow_dagrun_duration_success"
        labels:
          dag_id: "$1"
      - match: "airflow.dagrun.duration.failed.*"
        match_metric_type: observer
        name: "airflow_dagrun_duration_failed"
        labels:
          dag_id: "$1"
      - match: "airflow.ti.start.*.*"
        match_metric_type: counter
        name: "airflow_task_start_total"
        labels:
          dag_id: "$1"
          task_id: "$2"
      - match: "airflow.ti.finish.*.*.*"
        match_metric_type: counter
        name: "airflow_task_finish_total"
        labels:
          dag_id: "$1"
          task_id: "$2"
          state: "$3"
      - match: "airflow.dagrun.schedule_delay.*"
        match_metric_type: observer
        name: "airflow_dagrun_schedule_delay"
        labels:
          dag_id: "$1"
      - match: "airflow.pool.running_slots.*"
        match_metric_type: gauge
        name: "airflow_pool_running_slots"
        labels:
          pool_name: "$1"
      - match: "airflow.pool.queued_slots.*"
        match_metric_type: gauge
        name: "airflow_pool_queued_slots"
        labels:
          pool_name: "$1"
      - match: "airflow.pool.open_slots.*"
        match_metric_type: gauge
        name: "airflow_pool_open_slots"
        labels:
          pool_name: "$1"
      - match: "airflow.pool.starving_tasks.*"
        match_metric_type: gauge
        name: "airflow_pool_starving_tasks"
        labels:
          pool_name: "$1"
Below logs.configs.scrape_configs, insert the following lines according to your environment.
    - job_name: integrations/apache-airflow
      static_configs:
      - targets: [localhost]
        labels:
          job: integrations/apache-airflow
          instance: '<your-instance-name>'
          __path__: '<airflow_home>/logs/dag_id=*/**/*.log'
      - targets: [localhost]
        labels:
          job: integrations/apache-airflow
          instance: '<your-instance-name>'
          __path__: '<airflow_home>/logs/scheduler/latest/*.py.log'
      pipeline_stages:
      - match:
          selector: '{job="integrations/apache-airflow",instance="<your-instance-name>"}'
          stages:
          - regex:
              source: filename
              expression: "<airflow_home>/logs/dag_id=(?P<dag_id>\\S+?)/.*/task_id=(?P<task_id>\\S+?)/.*log"
          - labels:
              dag_id:
              task_id:
      - match:
          selector: '{job="integrations/apache-airflow",instance="<your-instance-name>"}'
          stages:
          - regex:
              source: filename
              expression: "<airflow_home>/logs/scheduler/latest/(?P<dag_file>\\S+?)\\.log"
          - labels:
              dag_file:
      - multiline:
          # match on timestamp. Format should be like '[2023-05-09T11:58:53.205+0000]'
          firstline: '\[\d+-\d+-\d+T\d+:\d+:\d+\.\d+\+\d+\]'
Full example configuration for Grafana Agent
Refer to the following Grafana Agent configuration for a complete example that contains all the snippets used for the Apache Airflow integration. This example also includes metrics that are sent to monitor your Grafana Agent instance.
integrations:
  prometheus_remote_write:
  - basic_auth:
      password: <your_prom_pass>
      username: <your_prom_user>
    url: <your_prom_url>
  agent:
    enabled: true
    relabel_configs:
    - action: replace
      source_labels:
      - agent_hostname
      target_label: instance
    - action: replace
      target_label: job
      replacement: "integrations/agent-check"
    metric_relabel_configs:
    - action: keep
      regex: (prometheus_target_sync_length_seconds_sum|prometheus_target_scrapes_.*|prometheus_target_interval.*|prometheus_sd_discovered_targets|agent_build.*|agent_wal_samples_appended_total|process_start_time_seconds)
      source_labels:
      - __name__
  # Add here any snippet that belongs to the `integrations` section.
  # For a correct indentation, paste snippets copied from Grafana Cloud at the beginning of the line.
  statsd_exporter:
    enabled: true
    instance: '<your-instance-name>'
    listen_udp: '<your-instance-hostname>:8125'
    scrape_interval: 60s
    scrape_integration: true
    relabel_configs:
    - target_label: job
      replacement: 'integrations/apache-airflow'
    mapping_config:
      mappings:
      - match: "airflow.dag.*.*.duration"
        match_metric_type: observer
        name: "airflow_dag_task_duration"
        labels:
          dag_id: "$1"
          task_id: "$2"
      - match: "airflow.dagrun.duration.success.*"
        match_metric_type: observer
        name: "airflow_dagrun_duration_success"
        labels:
          dag_id: "$1"
      - match: "airflow.dagrun.duration.failed.*"
        match_metric_type: observer
        name: "airflow_dagrun_duration_failed"
        labels:
          dag_id: "$1"
      - match: "airflow.ti.start.*.*"
        match_metric_type: counter
        name: "airflow_task_start_total"
        labels:
          dag_id: "$1"
          task_id: "$2"
      - match: "airflow.ti.finish.*.*.*"
        match_metric_type: counter
        name: "airflow_task_finish_total"
        labels:
          dag_id: "$1"
          task_id: "$2"
          state: "$3"
      - match: "airflow.dagrun.schedule_delay.*"
        match_metric_type: observer
        name: "airflow_dagrun_schedule_delay"
        labels:
          dag_id: "$1"
      - match: "airflow.pool.running_slots.*"
        match_metric_type: gauge
        name: "airflow_pool_running_slots"
        labels:
          pool_name: "$1"
      - match: "airflow.pool.queued_slots.*"
        match_metric_type: gauge
        name: "airflow_pool_queued_slots"
        labels:
          pool_name: "$1"
      - match: "airflow.pool.open_slots.*"
        match_metric_type: gauge
        name: "airflow_pool_open_slots"
        labels:
          pool_name: "$1"
      - match: "airflow.pool.starving_tasks.*"
        match_metric_type: gauge
        name: "airflow_pool_starving_tasks"
        labels:
          pool_name: "$1"
logs:
  configs:
  - clients:
    - basic_auth:
        password: <your_loki_pass>
        username: <your_loki_user>
      url: <your_loki_url>
    name: integrations
    positions:
      filename: /tmp/positions.yaml
    scrape_configs:
      # Add here any snippet that belongs to the `logs.configs.scrape_configs` section.
      # For a correct indentation, paste snippets copied from Grafana Cloud at the beginning of the line.
    - job_name: integrations/apache-airflow
      static_configs:
      - targets: [localhost]
        labels:
          job: integrations/apache-airflow
          instance: '<your-instance-name>'
          __path__: '<airflow_home>/logs/dag_id=*/**/*.log'
      - targets: [localhost]
        labels:
          job: integrations/apache-airflow
          instance: '<your-instance-name>'
          __path__: '<airflow_home>/logs/scheduler/latest/*.py.log'
      pipeline_stages:
      - match:
          selector: '{job="integrations/apache-airflow",instance="<your-instance-name>"}'
          stages:
          - regex:
              source: filename
              expression: "<airflow_home>/logs/dag_id=(?P<dag_id>\\S+?)/.*/task_id=(?P<task_id>\\S+?)/.*log"
          - labels:
              dag_id:
              task_id:
      - match:
          selector: '{job="integrations/apache-airflow",instance="<your-instance-name>"}'
          stages:
          - regex:
              source: filename
              expression: "<airflow_home>/logs/scheduler/latest/(?P<dag_file>\\S+?)\\.log"
          - labels:
              dag_file:
      - multiline:
          # match on timestamp. Format should be like '[2023-05-09T11:58:53.205+0000]'
          firstline: '\[\d+-\d+-\d+T\d+:\d+:\d+\.\d+\+\d+\]'
metrics:
  configs:
  - name: integrations
    remote_write:
    - basic_auth:
        password: <your_prom_pass>
        username: <your_prom_user>
      url: <your_prom_url>
    scrape_configs:
      # Add here any snippet that belongs to the `metrics.configs.scrape_configs` section.
      # For a correct indentation, paste snippets copied from Grafana Cloud at the beginning of the line.
  global:
    scrape_interval: 60s
  wal_directory: /tmp/grafana-agent-wal
Dashboards
The Apache Airflow integration installs the following dashboards in your Grafana Cloud instance to help monitor your system.
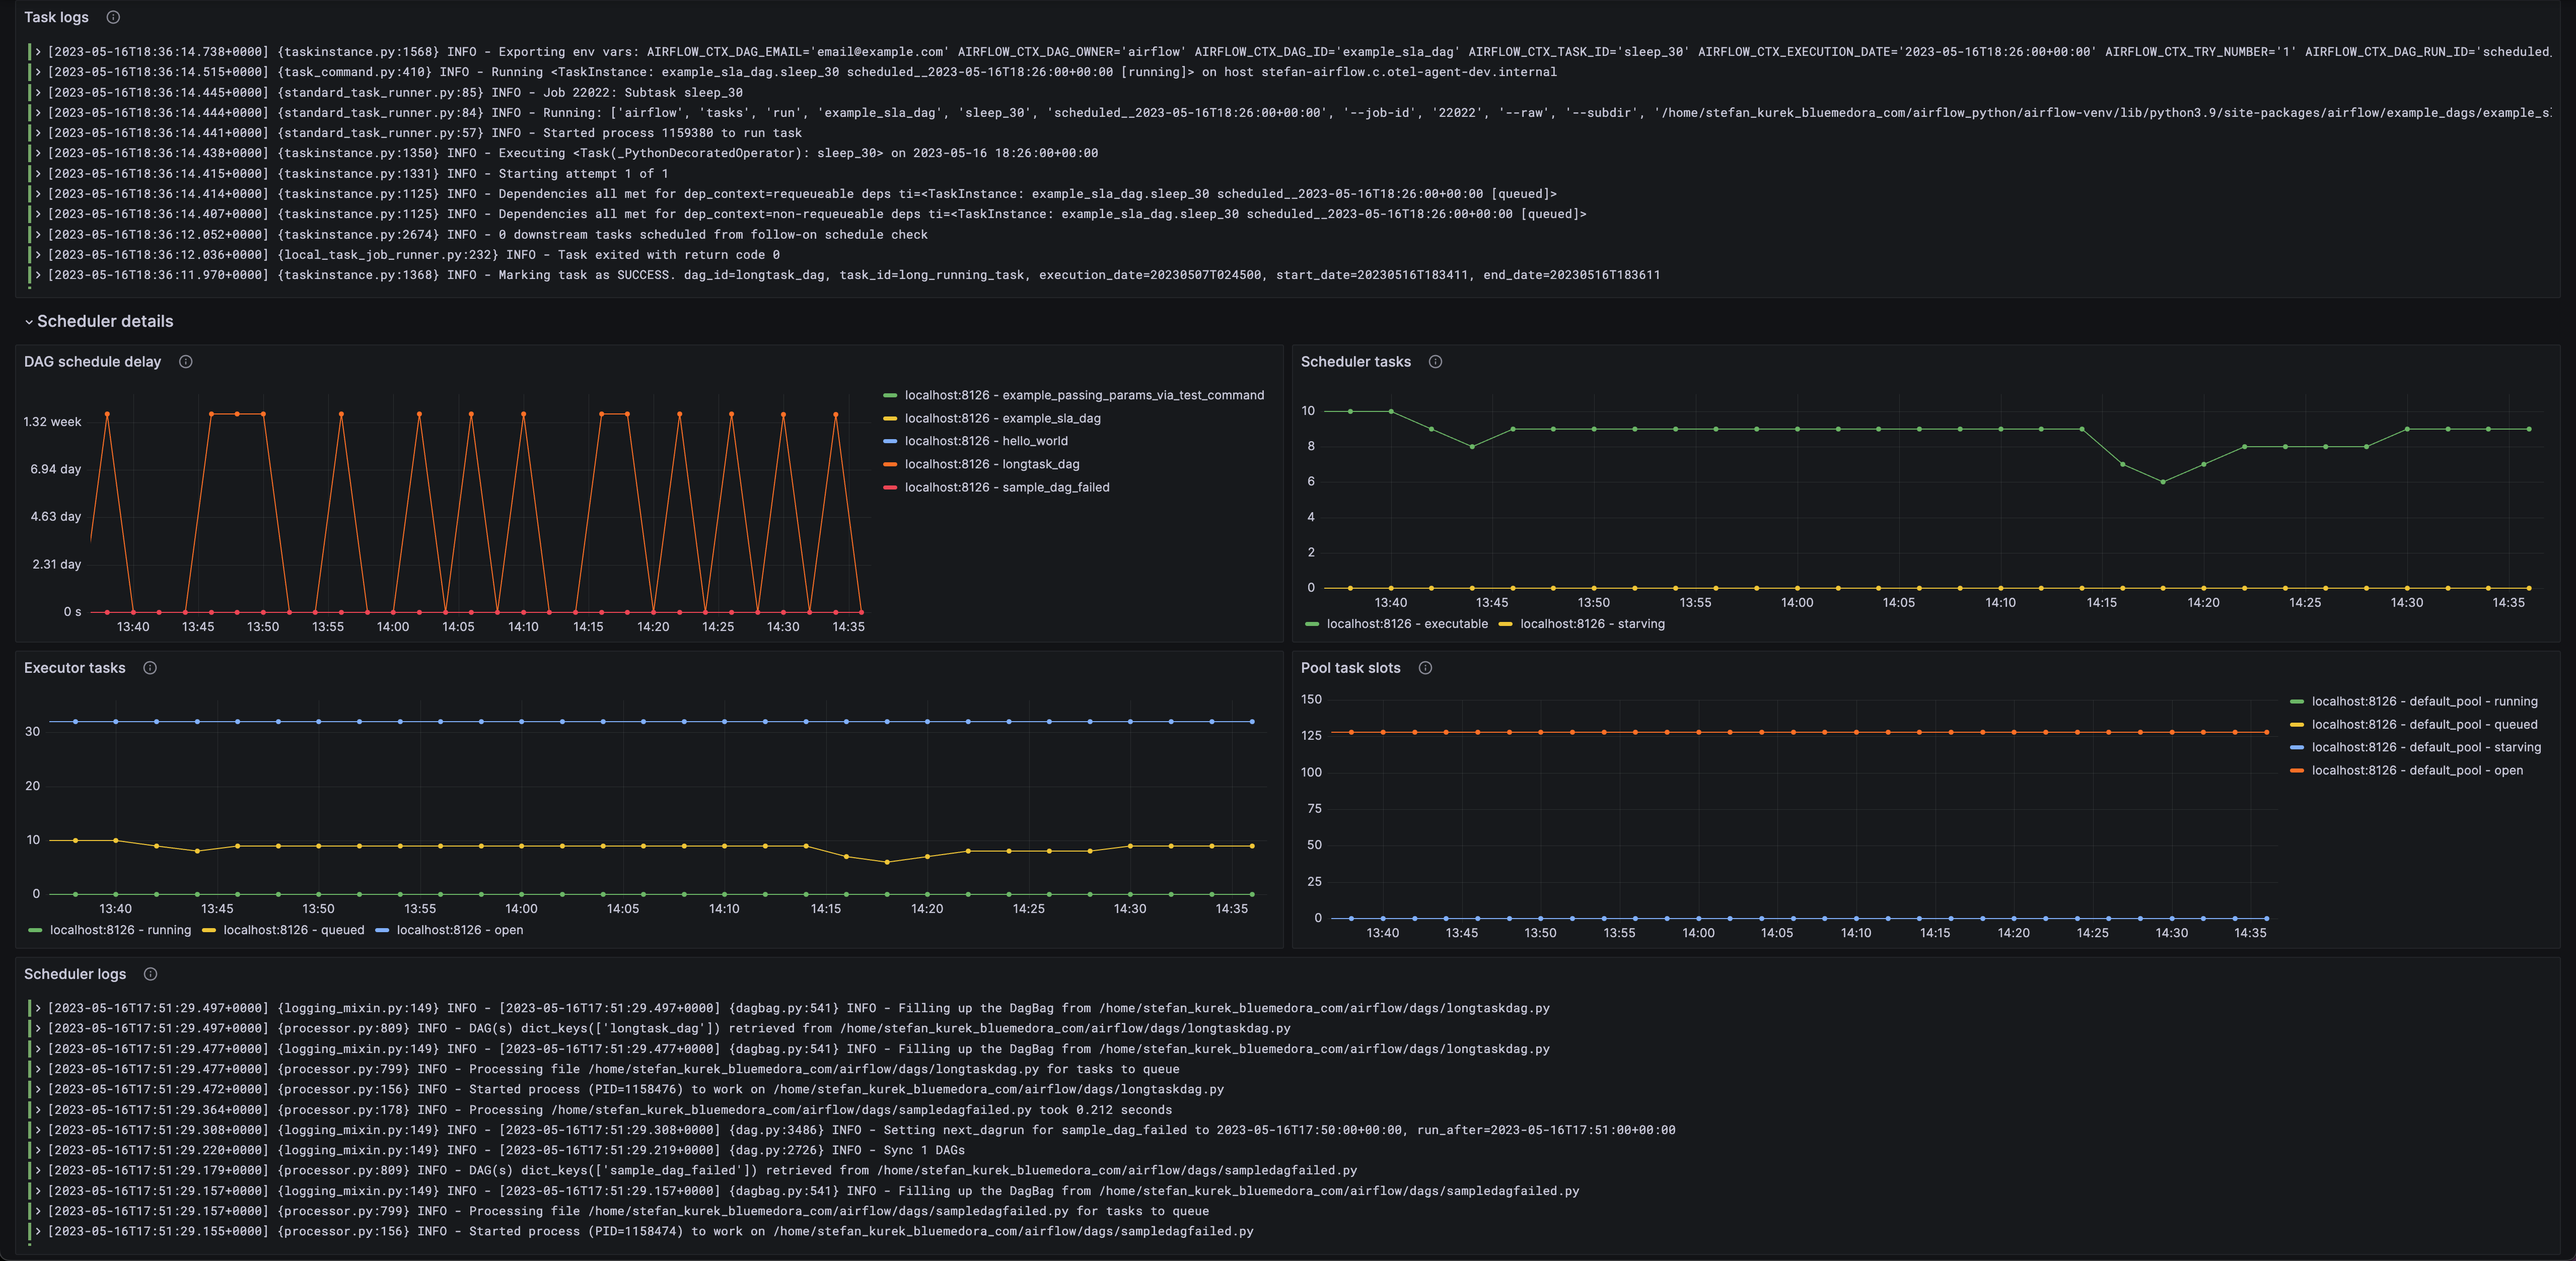
- Apache Airflow overview
Apache Airflow overview (general)
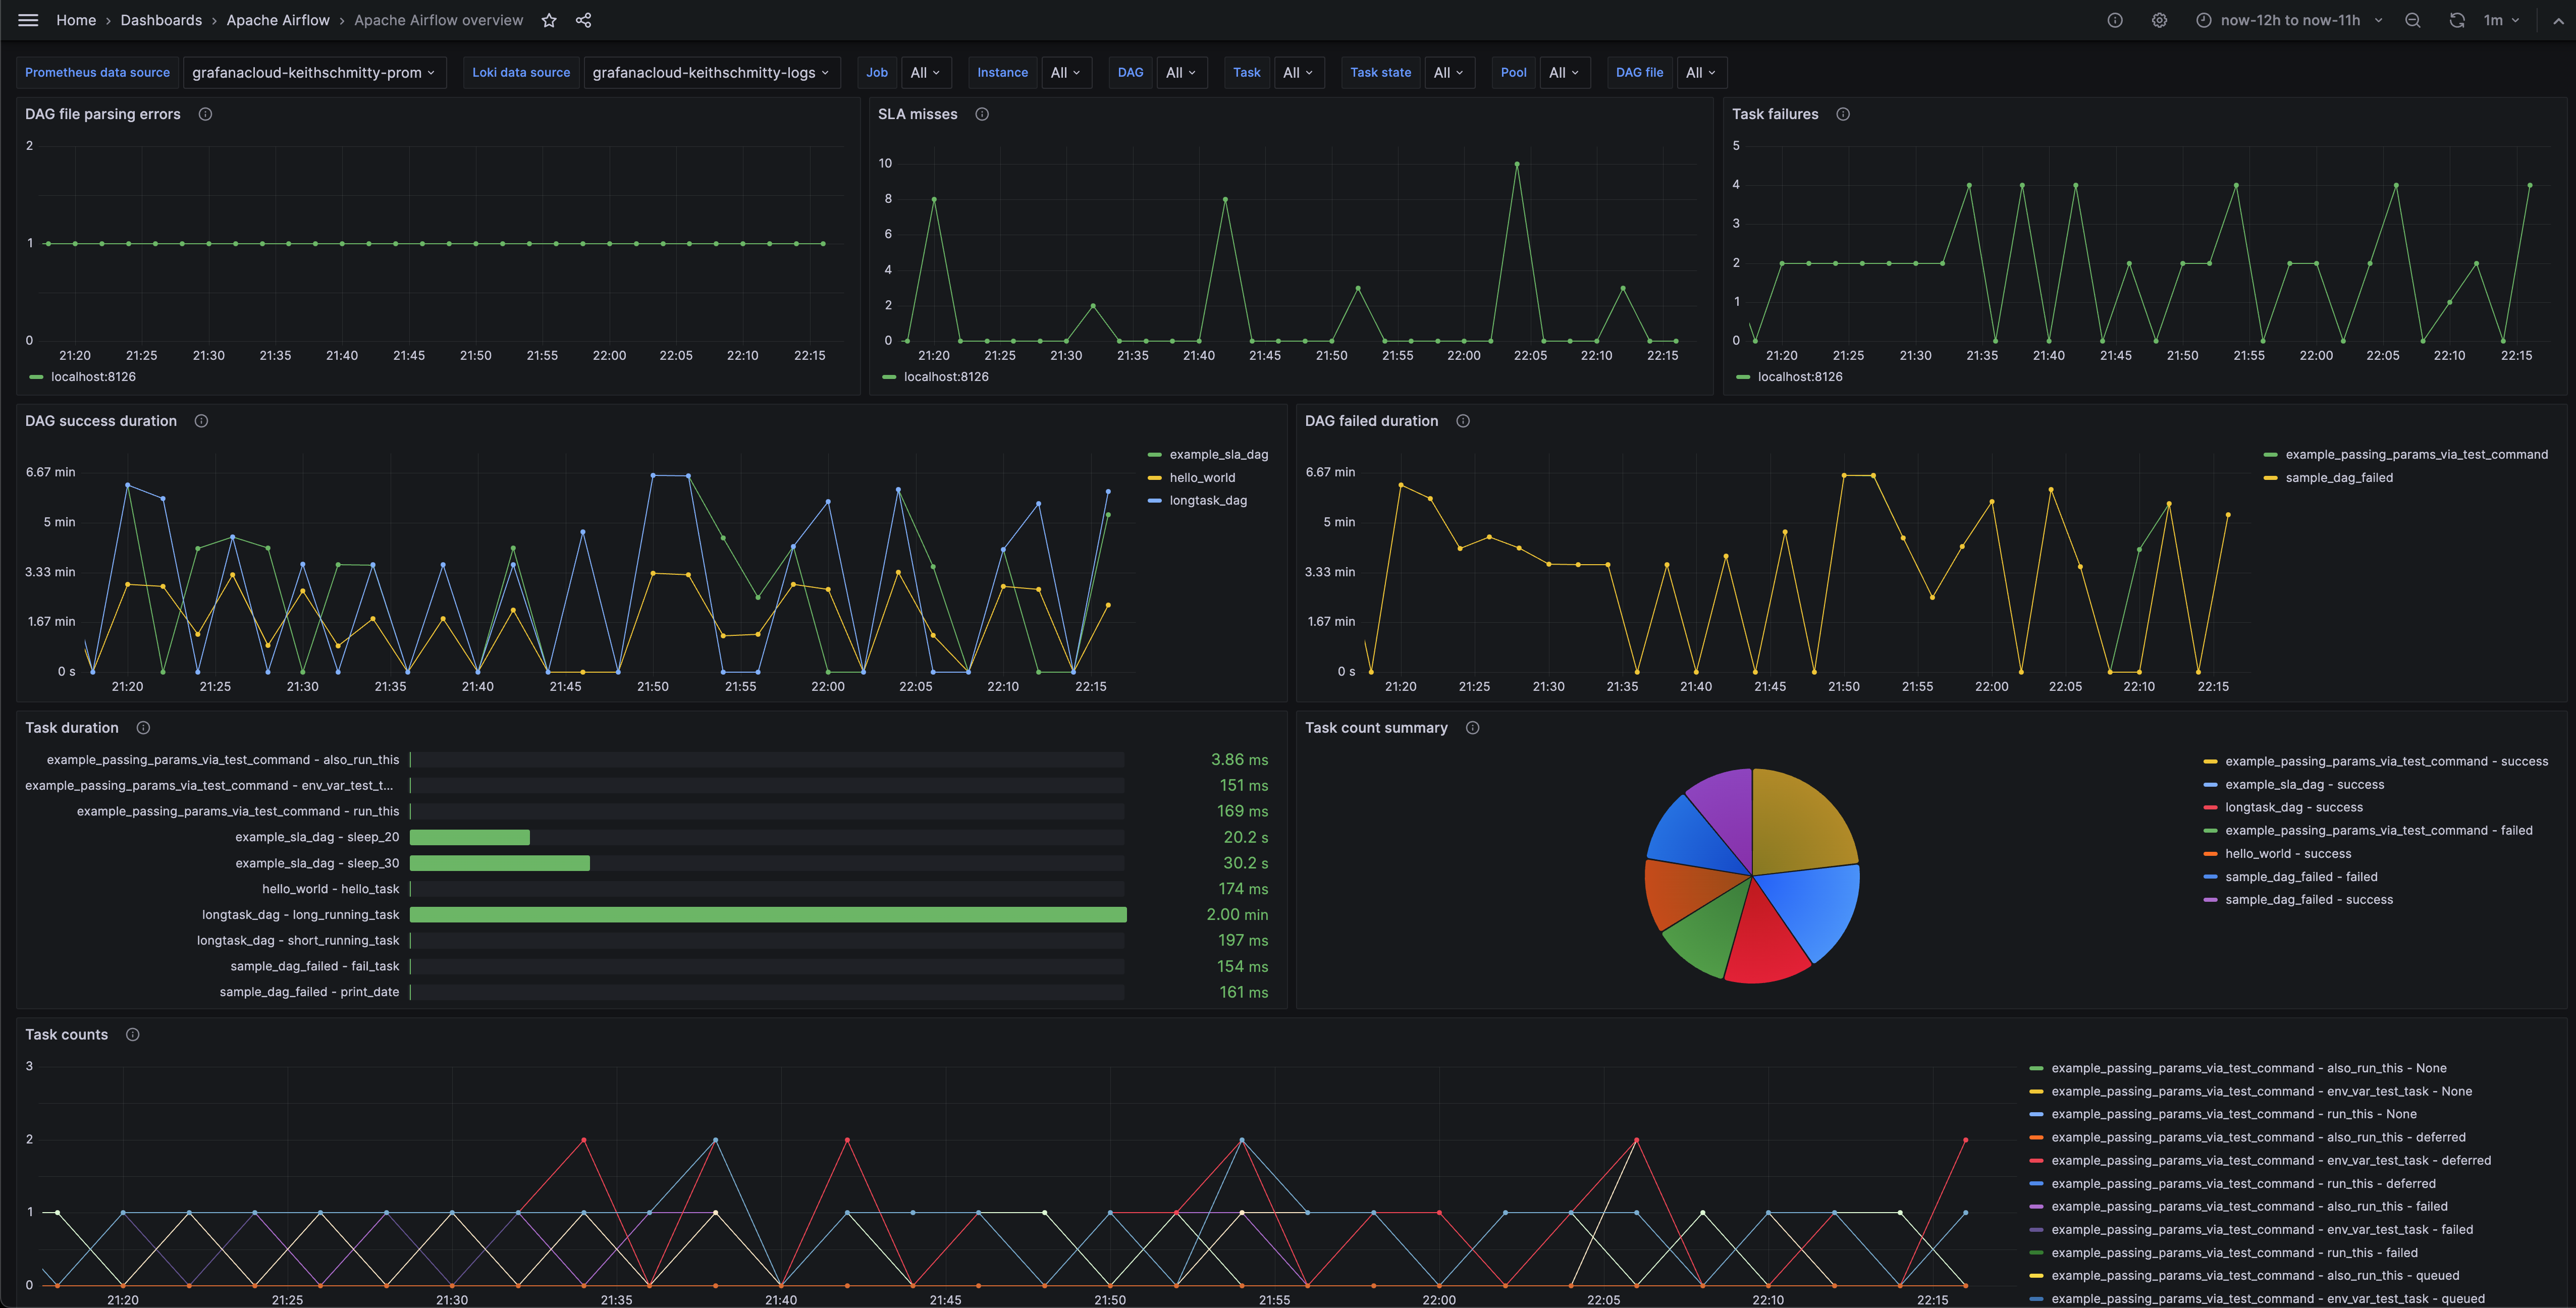
Apache Airflow overview (scheduler)
Alerts
The Apache Airflow integration includes the following useful alerts:
| Alert | Description |
|---|---|
| ApacheAirflowStarvingPoolTasks | Critical: There are starved tasks detected in the Apache Airflow pool. |
| ApacheAirflowDAGScheduleDelayWarningLevel | Warning: The delay in DAG schedule time to DAG run time has reached the warning threshold. |
| ApacheAirflowDAGScheduleDelayCriticalLevel | Critical: The delay in DAG schedule time to DAG run time has reached the critical threshold. |
| ApacheAirflowDAGFailures | Critical: There have been DAG failures detected. |
Metrics
The most important metrics provided by the Apache Airflow integration, which are used on the pre-built dashboard and Prometheus alerts, are as follows:
- airflow_dag_processing_import_errors
- airflow_dag_task_duration_count
- airflow_dag_task_duration_sum
- airflow_dagrun_duration_failed_count
- airflow_dagrun_duration_failed_sum
- airflow_dagrun_duration_success_count
- airflow_dagrun_duration_success_sum
- airflow_dagrun_schedule_delay_count
- airflow_dagrun_schedule_delay_sum
- airflow_executor_open_slots
- airflow_executor_queued_tasks
- airflow_executor_running_tasks
- airflow_pool_open_slots
- airflow_pool_queued_slots
- airflow_pool_running_slots
- airflow_pool_starving_tasks
- airflow_scheduler_tasks_executable
- airflow_scheduler_tasks_starving
- airflow_sla_missed
- airflow_task_finish_total
- airflow_task_start_total
- airflow_ti_failures
- up
Changelog
# 0.0.4 - September 2023

* Update Grafana Agent configuration snippets to include filtered metrics used in gauge panels

# 0.0.3 - September 2023

* New Filter Metrics option for configuring the Grafana Agent, which saves on metrics cost by dropping any metric not used by this integration. Beware that anything custom built using metrics that are not on the snippet will stop working.
* New hostname relabel option, which applies the instance name you write on the text box to the Grafana Agent configuration snippets, making it easier and less error prone to configure this mandatory label.

# 0.0.2 - August 2023

* Add regex filter for logs datasource

# 0.0.1 - June 2023

* Initial release
Cost
By connecting your Apache Airflow instance to Grafana Cloud, you might incur charges. To view information on the number of active series that your Grafana Cloud account uses for metrics included in each Cloud tier, see Active series and dpm usage and Cloud tier pricing.
Was this page helpful?
Related resources from Grafana Labs


