
Aerospike integration for Grafana Cloud
Aerospike is a high-performance, NoSQL, key-value database designed for ultra-low-latency and high-throughput applications. It offers fast data storage and retrieval, scalability, and ACID compliance, making it suitable for real-time, mission-critical data processing.
This integration supports Aerospike versions 6.2.0+
This integration includes 8 useful alerts and 4 pre-built dashboards to help monitor and visualize Aerospike metrics and logs.
Before you begin
Aerospike
This integration is designed to target clustered Aerospike environments. For best results, namespaces within a single cluster should have unique names.
By default, Aerospike logs to STDERR. To enable log collection for your Aerospike instance, create the /var/log/aerospike directory and modify the logging section of the instance’s aerospike.conf file to send logs to a file. Save these changes and restart Aerospike to begin logging to a file.
context anyinstructs Aerospike to capture log messages from all contexts. For a full list of logging contexts, see this documentation.infoinstructs Aerospike to capture log messages of severity level info or higher. Other possible values arecritical,warning,debug, anddetail.
This example is the recommended configuration for an Aerospike instance, but if your log file path or name differs, modify your configuration accordingly.
logging {
        file /var/log/aerospike/aerospike.log {
                context any info
        }
}
Certain metrics used in this integration may not appear depending on your Aerospike instance’s configuration (aerospike.conf):
- to monitor disk metrics, one or more namespaces must be configured to use
storage-engine device - to monitor cache metrics, one or more namespace must be configured to use
storage-engine devicewithdata-in-memory false
Example namespace configuration:
namespace test {
        replication-factor 2
        memory-size 1G

        storage-engine device {
                file /opt/aerospike/data/test.data
                filesize 1G
                data-in-memory false
                read-page-cache true
        }
}
Aerospike prometheus exporter
This integration supports metrics and logs from an Aerospike instance. It is configured to work with the Aerospike Prometheus Exporter, which must be installed and configured separately from Grafana Alloy.
To export logs from your Aerospike instance, modify the logging configuration section of ape.toml:
log_file = "/var/log/aerospike/aerospike.log"
log_level = "info"
Install Aerospike integration for Grafana Cloud
- In your Grafana Cloud stack, click Connections in the left-hand menu.
- Find Aerospike and click its tile to open the integration.
- Review the prerequisites in the Configuration Details tab and set up Grafana Agent to send Aerospike metrics and logs to your Grafana Cloud instance.
- Click Install to add this integration’s pre-built dashboards and alerts to your Grafana Cloud instance, and you can start monitoring your Aerospike setup.
Configuration snippets for Grafana Alloy
Advanced mode
The following snippets provide examples to guide you through the configuration process.
To instruct Grafana Alloy to scrape your Aerospike instances, manually copy and append the snippets to your alloy configuration file, then follow subsequent instructions.
Advanced metrics snippets
prometheus.scrape "metrics_integrations_integrations_aerospike" {
	targets = [{
		__address__       = "<node-hostname>:9145",
		aerospike_cluster = "<as-cluster-name>",
	}]
	forward_to = [prometheus.remote_write.metrics_service.receiver]
	job_name   = "integrations/aerospike"
}
To monitor your Aerospike instance, you must use a discovery.relabel component to discover your Aerospike Prometheus endpoint and apply appropriate labels, followed by a prometheus.scrape component to scrape it.
Configure the following properties within each discovery.relabel component:
__address__: The address to your Aerospike Prometheus metrics endpoint.instancelabel:constants.hostnamesets theinstancelabel to your Grafana Alloy server hostname. If that is not suitable, change it to a value uniquely identifies this Aerospike instance. Make sure this label value is the same for all telemetry data collected for this instance.aerospike_cluster: Theaerospike_clusterlabel to group your Aerospike instances within a cluster. Set the same value for all nodes within your cluster.
If you have multiple Aerospike servers to scrape, configure one discovery.relabel for each and scrape them by including each under targets within the prometheus.scrape component.
Advanced logs snippets
linux
local.file_match "logs_integrations_integrations_aerospike" {
	path_targets = [{
		__address__       = "localhost",
		__path__          = "/var/log/aerospike/aerospike.log",
		aerospike_cluster = "<as-cluster-name>",
		instance          = "<node-hostname>:9145",
		job               = "integrations/aerospike",
	}]
}

loki.process "logs_integrations_integrations_aerospike" {
	forward_to = [loki.write.grafana_cloud_loki.receiver]

	stage.multiline {
		firstline     = "\\w{3} \\d{2} \\d{4}"
		max_lines     = 0
		max_wait_time = "3s"
	}

	stage.regex {
		expression = "\\w{3} \\d{2} \\d{4} \\d{2}:\\d{2}:\\d{2} \\w{3}: (?P<level>\\w+) \\((?P<context>\\w+)\\): (?P<trace>\\(\\S+\\))\\s+(?P<message>(?s:.*))$"
	}

	stage.labels {
		values = {
			context = null,
			level   = null,
		}
	}
}

loki.source.file "logs_integrations_integrations_aerospike" {
	targets    = local.file_match.logs_integrations_integrations_aerospike.targets
	forward_to = [loki.process.logs_integrations_integrations_aerospike.receiver]
}
To monitor your Aerospike instance logs, you will use a combination of the following components:
local.file_match defines where to find the log file to be scraped. Change the following properties according to your environment:
__address__: The Aerospike instance address__path__: The path to the log file.instancelabel:constants.hostnamesets theinstancelabel to your Grafana Alloy server hostname. If that is not suitable, change it to a value uniquely identifies this Aerospike instance. Make sure this label value is the same for all telemetry data collected for this instance.aerospike_cluster: Theaerospike_clusterlabel to group your Aerospike instances within a cluster. Set the same value for all nodes within your cluster.
loki.process defines how to process logs before sending it to Loki.
loki.source.file sends logs to Loki.
Grafana Agent static configuration (deprecated)
The following section shows configuration for running Grafana Agent in static mode which is deprecated. You should use Grafana Alloy for all new deployments.
Before you begin
Aerospike
This integration is designed to target clustered Aerospike environments. For best results, namespaces within a single cluster should have unique names.
By default, Aerospike logs to STDERR. To enable log collection for your Aerospike instance, create the /var/log/aerospike directory and modify the logging section of the instance’s aerospike.conf file to send logs to a file. Save these changes and restart Aerospike to begin logging to a file.
context anyinstructs Aerospike to capture log messages from all contexts. For a full list of logging contexts, see this documentation.infoinstructs Aerospike to capture log messages of severity level info or higher. Other possible values arecritical,warning,debug, anddetail.
This example is the recommended configuration for an Aerospike instance, but if your log file path or name differs, modify your configuration accordingly.
logging {
        file /var/log/aerospike/aerospike.log {
                context any info
        }
}
Certain metrics used in this integration may not appear depending on your Aerospike instance’s configuration (aerospike.conf):
- to monitor disk metrics, one or more namespaces must be configured to use
storage-engine device - to monitor cache metrics, one or more namespace must be configured to use
storage-engine devicewithdata-in-memory false
Example namespace configuration:
namespace test {
        replication-factor 2
        memory-size 1G

        storage-engine device {
                file /opt/aerospike/data/test.data
                filesize 1G
                data-in-memory false
                read-page-cache true
        }
}
Aerospike prometheus exporter
This integration supports metrics and logs from an Aerospike instance. It is configured to work with the Aerospike Prometheus Exporter, which must be installed and configured separately from the Grafana Agent.
To export logs from your Aerospike instance, modify the logging configuration section of ape.toml:
log_file = "/var/log/aerospike/aerospike.log"
log_level = "info"
Install Aerospike integration for Grafana Cloud
- In your Grafana Cloud stack, click Connections in the left-hand menu.
- Find Aerospike and click its tile to open the integration.
- Review the prerequisites in the Configuration Details tab and set up Grafana Agent to send Aerospike metrics and logs to your Grafana Cloud instance.
- Click Install to add this integration’s pre-built dashboards and alerts to your Grafana Cloud instance, and you can start monitoring your Aerospike setup.
Post-install configuration for the Aerospike integration
After enabling the metrics generation, instruct the Grafana Agent to scrape your Aerospike Prometheus Exporter.
If you want to show logs and metrics signals correlated in your dashboards, as a single pane of glass, ensure the following:
job,aerospike_cluster, andinstancelabel values must match for metrics and logs scrape config in your agent configuration file.joblabel must be set tointegrations/aerospike(already configured in the snippets).aerospike_clusterlabel must be set to a value that identifies your Aerospike cluster.instancelabel must be set to a value that uniquely identifies your Aerospike node. Please replace the default hostname value according to your environment - it must be set manually.
Configuration snippets for Grafana Agent
Below metrics.configs.scrape_configs, insert the following lines and change the URLs according to your environment:
    - job_name: integrations/aerospike
      metrics_path: /metrics
      static_configs:
        - targets: ["<node-hostname>:9145"]
          labels:
            aerospike_cluster: '<as-cluster-name>'
Below logs.configs.scrape_configs, insert the following lines according to your environment.
    - job_name: integrations/aerospike
      static_configs:
        - targets: [localhost]
          labels:
            job: integrations/aerospike
            aerospike_cluster: '<as-cluster-name>'
            instance: '<node-hostname>:9145'
            __path__: /var/log/aerospike/aerospike.log
      pipeline_stages:
        - multiline:
            firstline: '\w{3} \d{2} \d{4}'
        - regex:
            expression: '\w{3} \d{2} \d{4} \d{2}:\d{2}:\d{2} \w{3}: (?P<level>\w+) \((?P<context>\w+)\): (?P<trace>\(\S+\))\s+(?P<message>(?s:.*))$'
        - labels:
            level:
            context:
Full example configuration for Grafana Agent
Refer to the following Grafana Agent configuration for a complete example that contains all the snippets used for the Aerospike integration. This example also includes metrics that are sent to monitor your Grafana Agent instance.
integrations:
  prometheus_remote_write:
  - basic_auth:
      password: <your_prom_pass>
      username: <your_prom_user>
    url: <your_prom_url>
  agent:
    enabled: true
    relabel_configs:
    - action: replace
      source_labels:
      - agent_hostname
      target_label: instance
    - action: replace
      target_label: job
      replacement: "integrations/agent-check"
    metric_relabel_configs:
    - action: keep
      regex: (prometheus_target_sync_length_seconds_sum|prometheus_target_scrapes_.*|prometheus_target_interval.*|prometheus_sd_discovered_targets|agent_build.*|agent_wal_samples_appended_total|process_start_time_seconds)
      source_labels:
      - __name__
  # Add here any snippet that belongs to the `integrations` section.
  # For a correct indentation, paste snippets copied from Grafana Cloud at the beginning of the line.
logs:
  configs:
  - clients:
    - basic_auth:
        password: <your_loki_pass>
        username: <your_loki_user>
      url: <your_loki_url>
    name: integrations
    positions:
      filename: /tmp/positions.yaml
    scrape_configs:
      # Add here any snippet that belongs to the `logs.configs.scrape_configs` section.
      # For a correct indentation, paste snippets copied from Grafana Cloud at the beginning of the line.
    - job_name: integrations/aerospike
      static_configs:
        - targets: [localhost]
          labels:
            job: integrations/aerospike
            aerospike_cluster: '<as-cluster-name>'
            instance: '<node-hostname>:9145'
            __path__: /var/log/aerospike/aerospike.log
      pipeline_stages:
        - multiline:
            firstline: '\w{3} \d{2} \d{4}'
        - regex:
            expression: '\w{3} \d{2} \d{4} \d{2}:\d{2}:\d{2} \w{3}: (?P<level>\w+) \((?P<context>\w+)\): (?P<trace>\(\S+\))\s+(?P<message>(?s:.*))$'
        - labels:
            level:
            context:
metrics:
  configs:
  - name: integrations
    remote_write:
    - basic_auth:
        password: <your_prom_pass>
        username: <your_prom_user>
      url: <your_prom_url>
    scrape_configs:
      # Add here any snippet that belongs to the `metrics.configs.scrape_configs` section.
      # For a correct indentation, paste snippets copied from Grafana Cloud at the beginning of the line.
    - job_name: integrations/aerospike
      metrics_path: /metrics
      static_configs:
        - targets: ["<node-hostname>:9145"]
          labels:
            aerospike_cluster: '<as-cluster-name>'
  global:
    scrape_interval: 60s
  wal_directory: /tmp/grafana-agent-wal
Dashboards
The Aerospike integration installs the following dashboards in your Grafana Cloud instance to help monitor your system.
- Aerospike instance overview
- Aerospike logs
- Aerospike namespace overview
- Aerospike overview
Aerospike overview (cluster overview)
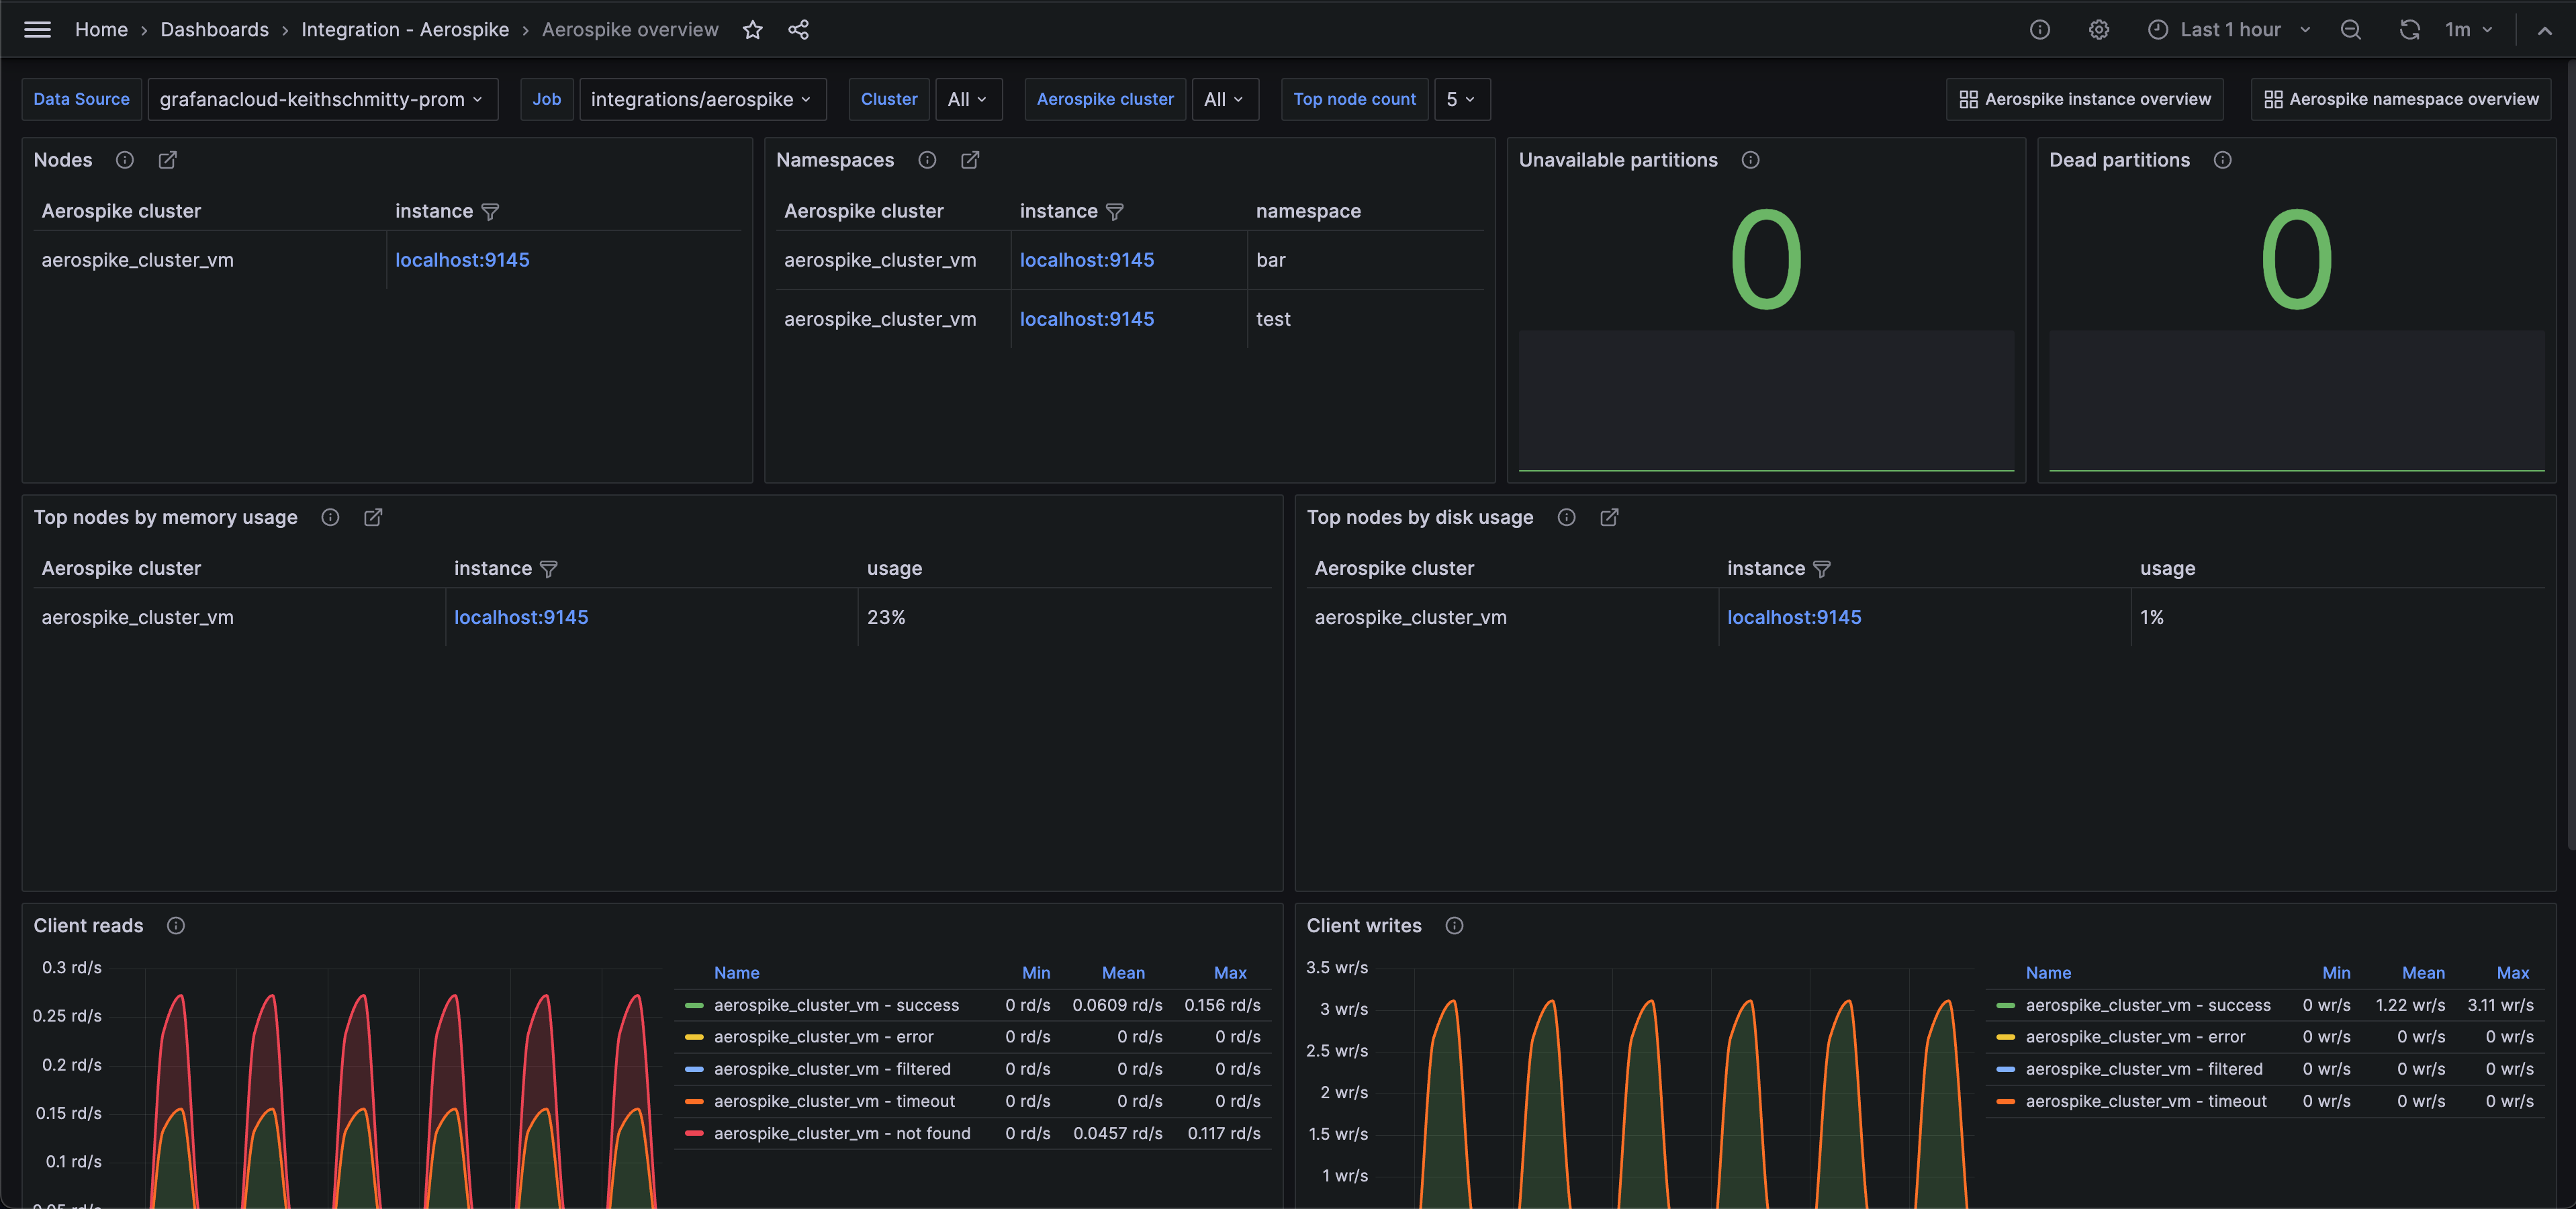
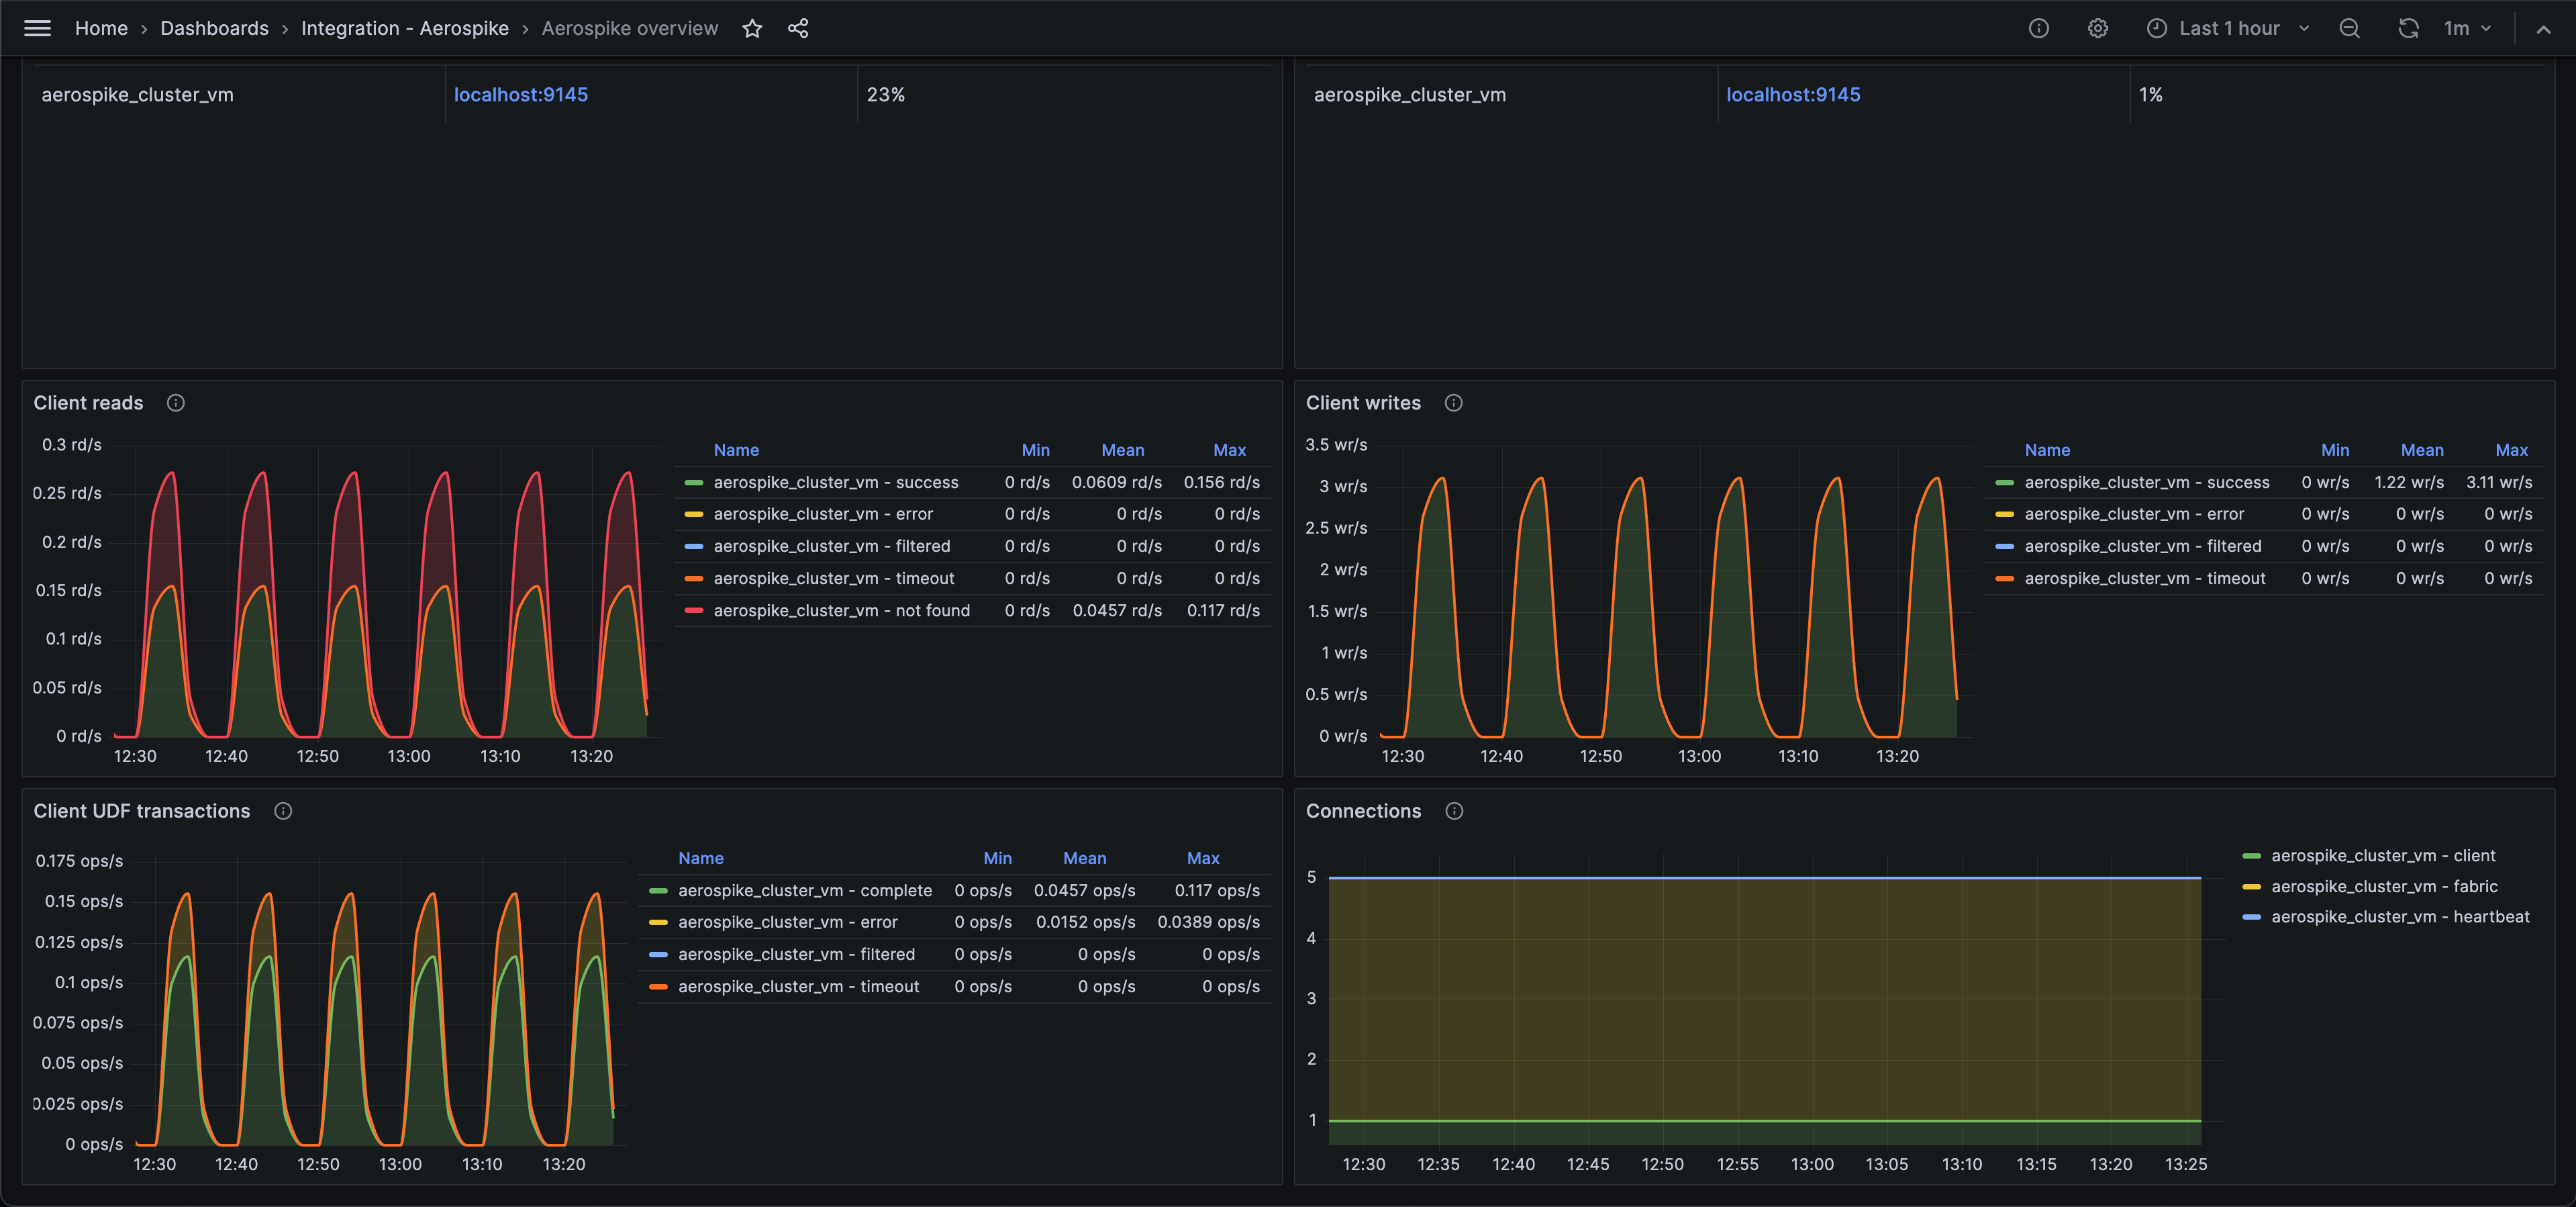
Aerospike overview (client requests)
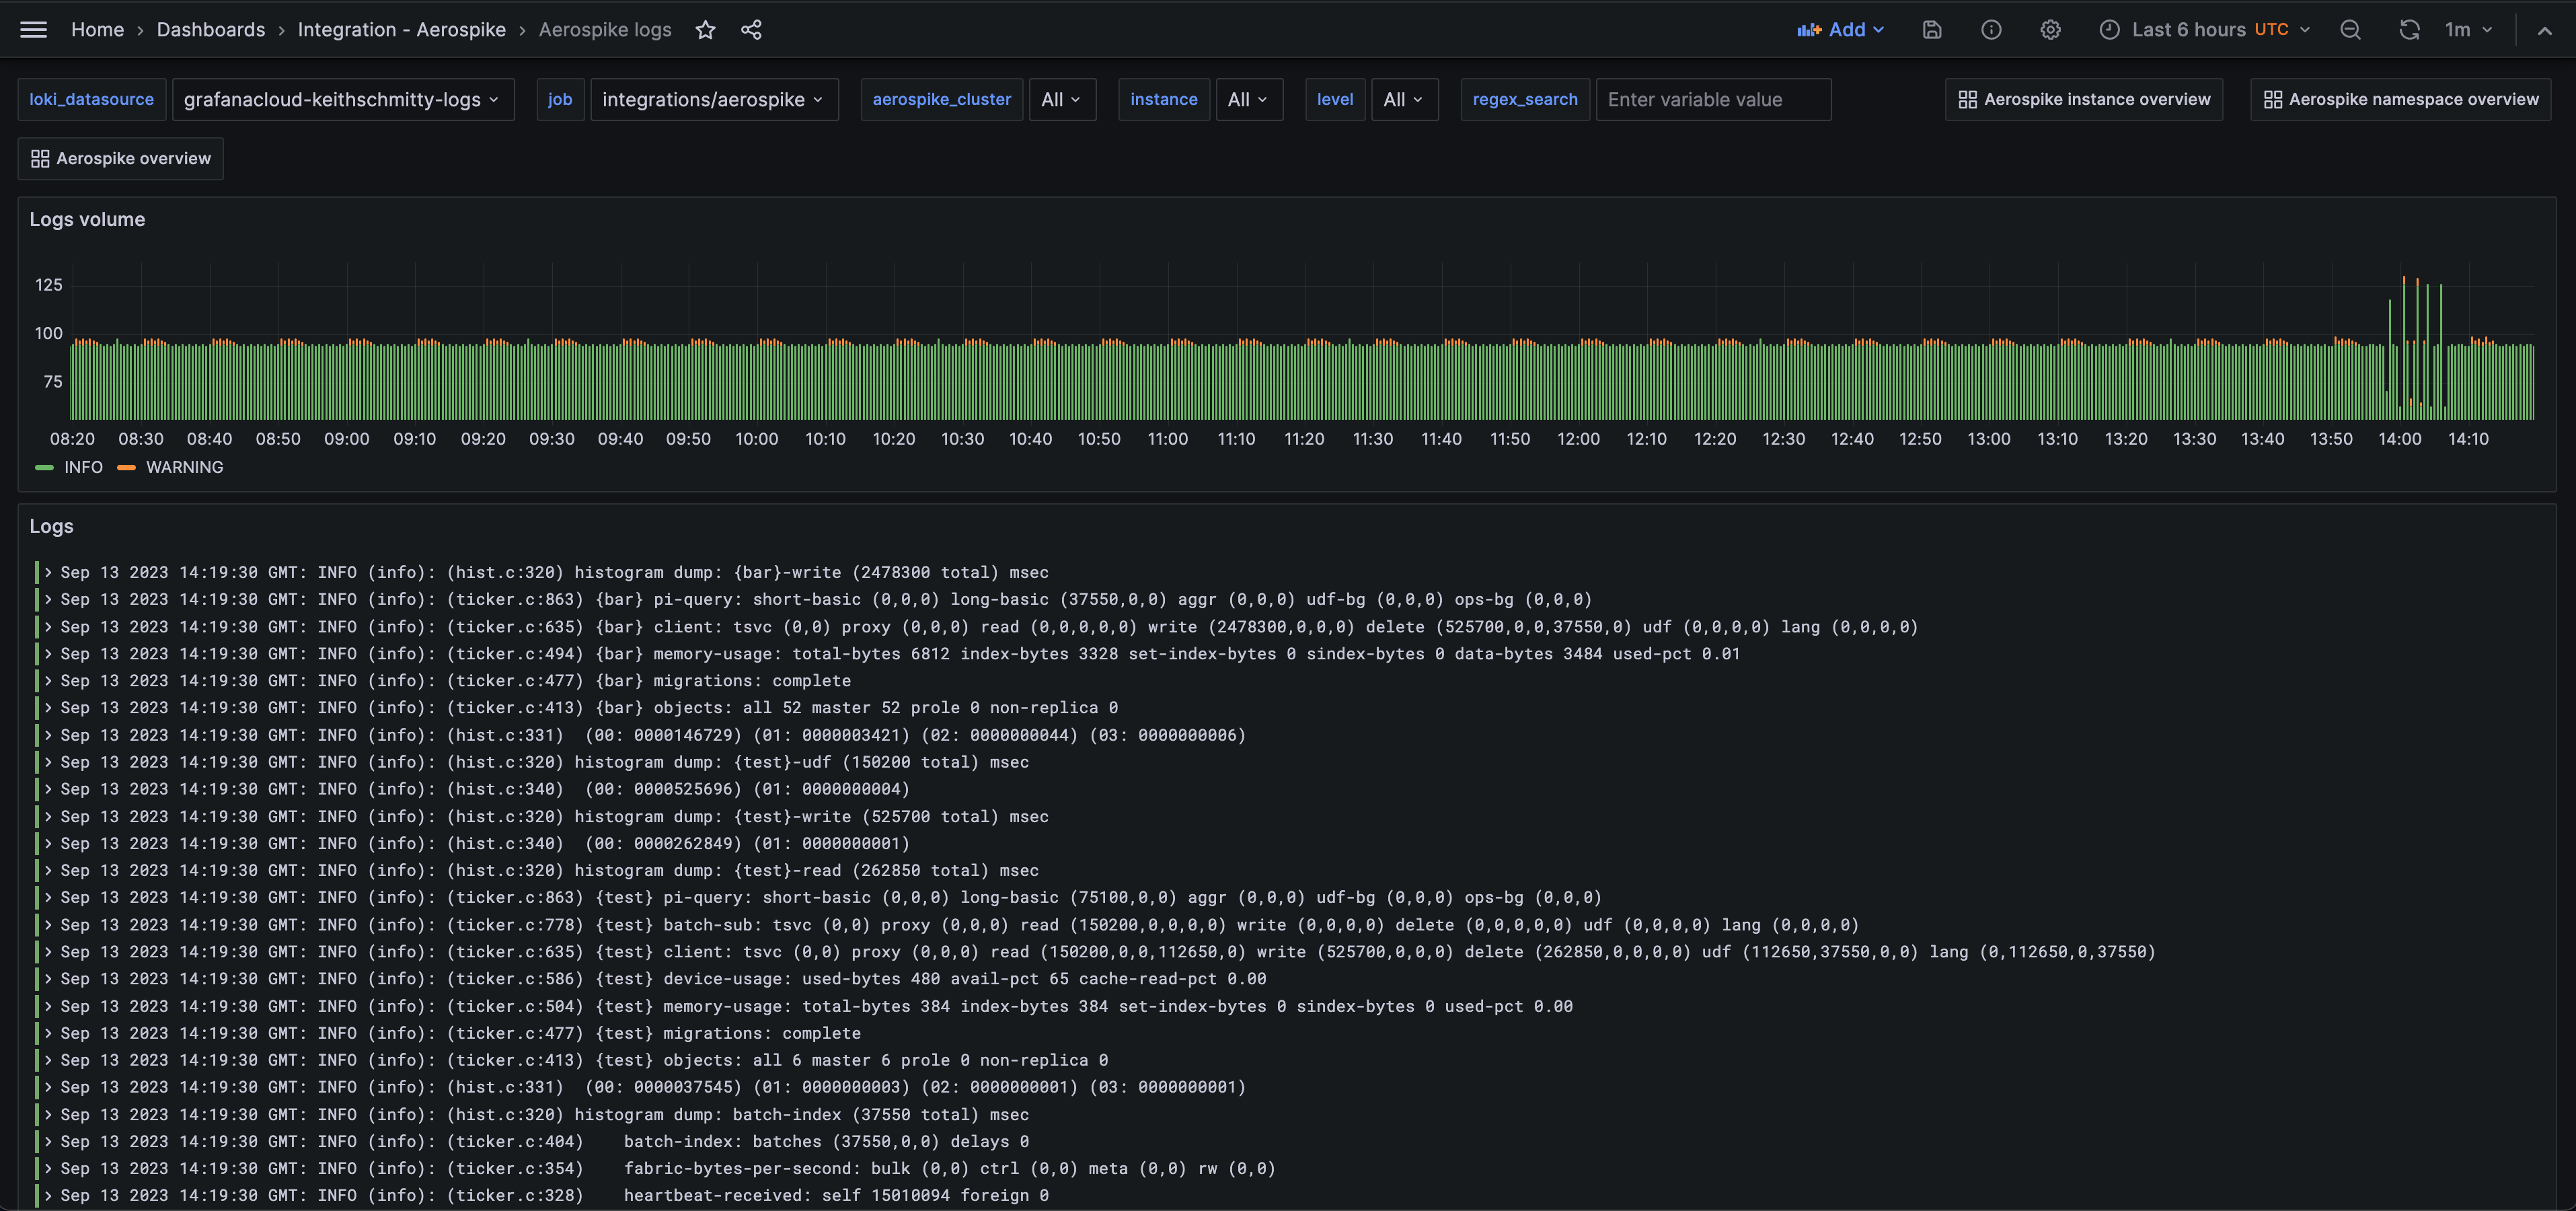
Aerospike logs (logs)
Alerts
The Aerospike integration includes the following useful alerts:
| Alert | Description |
|---|---|
| AerospikeNodeHighMemoryUsage | Critical: There is a limited amount of memory available for a node. |
| AerospikeNamespaceHighDiskUsage | Critical: There is a limited amount of disk space available for a node. |
| AerospikeUnavailablePartitions | Critical: There are unavailable partitions in the Aerospike cluster. |
| AerospikeDeadPartitions | Critical: There are dead partitions in the Aerospike cluster. |
| AerospikeNamespaceRejectingWrites | Critical: A namespace is currently rejecting all writes. Check for unavailable/dead partitions, clock skew, or nodes running out of memory/disk. |
| AerospikeHighClientReadErrorRate | Warning: There is a high rate of errors for client read transactions. |
| AerospikeHighClientWriteErrorRate | Warning: There is a high rate of errors for client write transactions. |
| AerospikeHighClientUDFErrorRate | Warning: There is a high rate of errors for client UDF transactions. |
Metrics
The most important metrics provided by the Aerospike integration, which are used on the pre-built dashboards and Prometheus alerts, are as follows:
- aerospike_namespace_cache_read_pct
- aerospike_namespace_client_read_error
- aerospike_namespace_client_read_filtered_out
- aerospike_namespace_client_read_not_found
- aerospike_namespace_client_read_success
- aerospike_namespace_client_read_timeout
- aerospike_namespace_client_udf_complete
- aerospike_namespace_client_udf_error
- aerospike_namespace_client_udf_filtered_out
- aerospike_namespace_client_udf_timeout
- aerospike_namespace_client_write_error
- aerospike_namespace_client_write_filtered_out
- aerospike_namespace_client_write_success
- aerospike_namespace_client_write_timeout
- aerospike_namespace_clock_skew_stop_writes
- aerospike_namespace_dead_partitions
- aerospike_namespace_device_free_pct
- aerospike_namespace_memory_free_pct
- aerospike_namespace_ns_cluster_size
- aerospike_namespace_stop_writes
- aerospike_namespace_unavailable_partitions
- aerospike_namespace_xmem_id
- aerospike_node_stats_client_connections
- aerospike_node_stats_fabric_connections
- aerospike_node_stats_heap_efficiency_pct
- aerospike_node_stats_heartbeat_connections
- aerospike_node_stats_system_free_mem_pct
- aerospike_node_up
- up
Changelog
# 0.0.1 - September 2023

- Initial release
Cost
By connecting your Aerospike instance to Grafana Cloud, you might incur charges. To view information on the number of active series that your Grafana Cloud account uses for metrics included in each Cloud tier, see Active series and dpm usage and Cloud tier pricing.
Was this page helpful?
Related resources from Grafana Labs


